An Objective and Subjective Quality
Assessment for Passive Gaming Video
Streaming
Nabajeet Barman
Faculty of Science, Engineering and Computing
Kingston University London, United Kingdom
Supervisor: Prof Maria G. Martini
A thesis submitted for the degree of
Doctor of Philosophy
“Find something to believe in and find it yourself. When you do, pass it on to the future.” – Metal Gear Solid 2: Sons of Liberty (Video Game 2001)
Declaration of Authorship
I, Nabajeet Barman, declare that this thesis titled, “An Objective and Subjective Quality Assessment for Passive Gaming Video Streaming” and the work presentedin it are my own. I confirm that:
• This work was done wholly or mainly while in candidature for a research degree at this University.
• Where any part of this thesis has previously been submitted for a degree or any other qualification at this University or any other institution, this has been clearly stated.
• Where I have consulted the published work of others, this is always clearly attributed.
• Where I have quoted from the work of others, the source is always given. With the exception of such quotations, this thesis is entirely my work.
• I have acknowledged all main sources of help.
Nabajeet BARMAN August 16, 2019
Acknowledgements
Personal
I owe my deepest gratitude to my supervisor and line manager, Professor Maria G. Martini, for her belief in me and giving me this opportunity to pursue this PhD. Her encouragement, support, and guidance throughout these past three years, not only limited to scientific research have helped me to finish this marathon while fulfilling many other goals and objectives of mine. Her personality and kindness will continue to inspire me beyond my professional career.
Also, my heartiest thanks to my colleagues and friends, Saman Zadtootaghaj and Steven Schmidt without whose collaboration, many of these works would not have been possible. Special thanks to Professor Sebastian Möller from the Berlin Institute of Technology for his guidance and support during my secondment at Technische Universität Berlin, Germany.
Thanks to the team at Multidimensional Insight Laboratory, Yonsei University, especially to Prof Sanghoon Lee, Woojae Kim, Duc Nguyen and Sewoong Ahn for hosting me at their institute for my secondment, leading to the completion of one of my earliest works.
Special thanks to all QoENet colleagues for all the training and network-wide events, online courses, scientific discussions and their continuous support during this period. Special thanks to Arslan Ahmad, Werner Robitza and Alcardo Barakabitze.
Thanks to Dr Manzoor Razaak and Dr Ognen Ognenoski for their guidance and tremendous help, especially during the initial few months, to help understand and overcome different challenges, both personal and professional.
Also my heartiest thanks to the previous and current team members at our WMN lab: Prof. Christos Politis, Dr Nabeel Khan, Dr Deepak G C, Alexandrous Ladas, Nikolaos, Solomon, Obinna, Bola, Silvia, Hadi for the friendly and supportive environment in the lab. Special thanks to my friends Sana, Bakhtiyar, Ioannis and Olga for the wonderful time together. My sincere thanks to the Tim and Tom from SEC-IT team and Nick, Lina and Karen Ingyon at Kingston University who during the course of the studies helped me with many of the project as well as personal requirements. My deepest gratitude to Rosalind Percival for being very kind, helpful and accommodating with the various requirements during the course of this PhD.
No story is complete without the support of a family behind. I would not be here without the support, encouragement, and love of my parents, G C Barman and Mrinalinee Barman. Thanks to my brother, Debjeet Barman for all his help and love throughout my life. Special thanks to my sister-in-law Jucy and my beautiful, recently born nephew, Nishkarsh.
Institutional
This work is part of a project that has received funding from the European Union’s Horizon 2020 research and innovation programme under the Marie Skłodowska-Curie grant agreement No 643072.
Abstract
Gaming video streaming has become increasingly popular in recent times. Along with the rise and popularity of cloud gaming services and e-sports, passive gaming video streaming services such as Twitch.tv, YouTubeGaming, etc. where viewers watch the gameplay of other gamers, have seen increasing acceptance. Twitch.tv alone has over 2.2 million monthly streamers and 15 million daily active users with almost a million average concurrent users, making Twitch.tv the 4th biggestinternet traffic generator, just after Netflix, YouTube and Apple. Despite the increasing importance and popularity of such live gaming video streaming services, they have until recently not caught the attention of the quality assessment research community. For the continued success of such services, it is imperative to maintain and satisfy the end user Quality of Experience (QoE), which can be measured using various Video Quality Assessment (VQA) methods. Gaming videos are synthetic and artificial in nature and have different streaming requirements as compared to traditional non-gaming content. While there exist a lot of subjective and objective studies in the field of quality assessment of Video-on-demand (VOD) streaming services, such as Netflix and YouTube, along with the design of many
VQA metrics, no work has been done previously towards quality assessment of live passive gaming video streaming applications.
The research work in this thesis tries to address this gap by using various subjective and objective quality assessment studies. A codec comparison using the three most popular and widely used compression standards is performed to determine their compression efficiency. Furthermore, a subjective and objective comparative study is carried out to find out the difference between gaming and non-gaming videos in terms of the trade-off between quality and data-rate after compression. This is followed by the creation of an open source gaming video dataset, which is then used for a performance evaluation study of the eight most popular
VQA metrics. Different temporal pooling strategies and content based classification approaches are evaluated to assess their effect on theVQA metrics. Finally, due to the low performance of existing No-Reference (NR) VQA metrics on gaming video content, two machine learning based NR models are designed using NR features and existing NR metrics, which are shown to outperform existingNR metrics while performing on par with state-of-the-art Full-Reference (FR) VQA metrics.
Preface
This doctoral thesis presents my research work in the field of gaming video streaming applications, which I performed at the School of Computer Science and Mathematics at Faculty of Science, Engineering and Technology, Kingston University. The results presented in this thesis have been published in the following publications:• N. Barman, E. Jammeh, S. A. Ghorashi and M. G. Martini, “No-reference Video Quality Estimation Based on Machine Learning for Passive Gaming Video Streaming Applications”, IEEE Access, vol. 7, pp. 74511-74527, 2019.
• N. Barman and M. G. Martini, “A Survey of QoE Modeling for HTTP Adaptive Video Streaming”, IEEE Access, vol. 7, pp. 30831-30859, 2019.
• N. Barman, S. Zadtootaghaj, S. Schmidt, M. G. Martini and S. Möller, “An Objective and Subjective Quality Assessment Study of Passive Gaming
Video Streaming”, International Journal of Network Management. 2018. https://doi.org/10.1002/nem.2054.
• N. Barman, S. Schmidt, S. Zadtootaghaj, M. G. Martini, and S. Möller, “An Evaluation of Video Quality Assessment Metrics for Passive Gaming Video Streaming”, In Proceedings of 23rd Packet Video Workshop 2018 (PV’ 18), ACM, Amsterdam, Netherlands, June 2018, pp. 7-12.
• N. Barman, S. Zadtootaghaj, S. Schmidt, M. G. Martini, and S. Möller, “GamingVideoSET: A Dataset for Gaming Video Streaming Applications”, 2018 16th Annual Workshop on Network and Systems Support for Games (NetGames), Amsterdam, Netherlands, June 2018, pp. 1-6.
• N. Barman, S. Zadtootaghaj, M. G. Martini, S. Möller, and S. Lee, “A Comparative Quality Assessment Study for Gaming and Non-Gaming Videos”, 2018 Tenth International Conference on Quality of Multimedia Experience (QoMEX), Sardinia, Italy, May 2018, pp. 1-6.
• N. Barman and M. G. Martini, “H.264/MPEG-AVC, H.265/MPEG-HEVC and VP9 Codec Comparison for Live Gaming Video Streaming”, in 2017 Ninth International Conference on Quality of Multimedia Experience (QoMEX 2017), Erfurt, Germany, May 2017, pp. 1-6.
Additionally, during the course of my PhD studies, I have also been involved in differ-ent collaborative works mdiffer-entioned below which are not an integral part of this thesis.
• A. A. Barakabitze, N. Barman, A. Ahmad, S. Zadtootaghaj, L. Sun, M. G. Martini, L. Atzori, “QoE Management of Multimedia Services using SDN and NFV: State-of-the-Art and Future Challenges”, in IEEE Communications Surveys & Tutorials. Revision.
• S. Zadtootaghaj, N. Barman, S. Schmidt, M. Martini, and S. Möller, “NR-GVQM: A No Reference Gaming Video Quality Metric”, in 20th IEEE International Symposium on Multimedia (IEEE ISM 2018), Taichung, Taiwan, 2018, pp. 131-134.
• S. Zadtootaghaj, S. Schmidt, N. Barman, S. Möller, and M. G. Martini, “A Classification of Video Games based on Game Characteristics linked to Video Coding Complexity”, in 2018 16th Annual Workshop on Network and Systems Support for Games (NetGames 2018), (Amsterdam, Netherlands), 2018. Best Paper Award.
• N. Barman, S. Valentin, and M. G. Martini, “Predicting Link Quality of Wireless Channel of Vehicular Users Using Street and Coverage Maps”, in 27th Annual IEEE International Symposium on Personal, Indoor and Mobile Radio Communications (PIMRC 2016), (Valencia, Spain), Sept 2016.
ITU-T Contribution
• N. Barman, M. Martini, and S. Zadtootaghaj, “Impact of video codecs on Gaming Quality of Experience”, ITU-T Study Group 12, ITU-T Contribution C.096 (2017) Available: https://www.itu.int/md/T17-SG12-C-0096/en.
• S. Schmidt, S. Zadtootaghaj, S. Möller, F. Metzger, M. Hirth, M. Su˘znjević, N. Barman, and M. G. Martini, “Requirement Specification and Possible Structure for an Opinion Model Predicting Gaming QoE (G.OMG)”, ITU-T Contribution C.200-R1 (2018). Available: https://www.itu.int/md/T17-SG12-C-0200/en
• S. Schmidt, S. Zadtootaghaj, F. Schiffner, S. Möller, S. S. Sabet, C. Griwodz, N. Barman, and M. G. Martini, “Data Assessment for an Opinion Model Pre-dicting Gaming QoE (G.OMG)”, ITU-T Contribution C.293 (2018). Available: https://www.itu.int/md/T17-SG12-C-0293/en
• S. Zadtootaghaj, S. Schmidt, M. Utke, S. Möller, N. Barman, and M. G. Martini, S. S. Sabet, and C. Griwodz, “Evaluation of Standardized Video Quality Models for Assessing Video Quality of Cloud Gaming Services”, ITU-T Contribution C.294 (2018). Available: https://www.itu.int/md/T17-SG12-C-0294/en
• S. Schmidt, S. Zadtootaghaj, M. Utke, S. Möller, N. Barman, M. G. Martini, S. S. Sabet, and C. Griwodz, “First Draft for an Opinion Model Predicting Gaming QoE (G.OMG)”, ITU-T Contribution C.387 (2019). Available: https://www.itu.int/md/T17-SG12-C-0387/en
Contents
List of Figures xix
List of Tables xxiii
1 Introduction 1 1.1 Gaming Entertainment . . . 3 1.2 Objectives . . . 5 1.3 Contributions to Knowledge . . . 8 1.4 Ethics Consideration . . . 9 1.5 Thesis Structure. . . 10 2 Background 11 2.1 Introduction . . . 12
2.2 HTTP Adaptive Video Streaming . . . 12
2.2.1 Concept Overview . . . 13
2.2.2 Quality Switching Dimensions . . . 14
2.3 QoE: Definition and Assessment Methodologies . . . 15
2.3.1 QoE Definition . . . 15
2.3.2 QoE Influence Factors . . . 16
2.3.3 QoE Assessment . . . 17
2.4 VQA Methodologies . . . 18
2.4.1 Subjective Quality Assessment . . . 18
2.4.2 Objective Quality Assessment . . . 19
2.4.3 Discussion . . . 25
2.5 Importance of QoE Modeling and Performance Evaluation of QoE Models . . . 26
2.5.1 Importance of QoE Modeling for Different Stakeholders . . . 27
2.5.2 QoE Model Performance Evaluation. . . 28
2.6 QoE Awareness for Video Coding . . . 29
2.6.1 Compression. . . 30
2.6.2 State of the Art Encoder: High Efficiency Video Coding (HEVC) 30 2.6.3 Content Aware Coding Strategies . . . 31
xvi Contents
2.6.4 Context Aware Coding Strategies . . . 34
2.6.5 Discussion . . . 35
2.7 Conclusion . . . 36
3 H.264/MPEG-AVC, H.265/MPEG-HEVC and VP9 Codec Com-parison for Live Gaming Video Streaming 39 3.1 Introduction . . . 40
3.2 Related Work . . . 41
3.3 Evaluation Methodology . . . 43
3.3.1 Reference Videos . . . 43
3.3.2 Encoding Parameters . . . 45
3.4 Results and Discussions . . . 46
3.4.1 Objective Quality Assessment . . . 46
3.4.2 Bjontegaard-Delta Bitrate (BD-BR) Analysis of the Codecs. 47 3.5 Conclusion . . . 49
4 A Comparative Quality Assessment Study for Gaming and Non-Gaming Videos 53 4.1 Introduction . . . 54
4.2 Test Methodology . . . 54
4.2.1 Source Videos . . . 54
4.2.2 Encoding Parameters . . . 55
4.3 Spatial and Temporal Complexity Comparison . . . 55
4.3.1 Results for Spatial Complexity. . . 58
4.3.2 Results for Temporal Complexity . . . 58
4.4 Objective Assessment . . . 59
4.5 Subjective Assessment . . . 60
4.5.1 Test Setting and Environment . . . 60
4.5.2 Subjective Test Results . . . 60
4.5.3 Subjective and Objective Scores Correlation . . . 61
4.5.4 Discussion . . . 62
4.6 Conclusion . . . 65
5 An Objective and Subjective Quality Assessment Study of Passive Gaming Video Streaming 67 5.1 Introduction . . . 68
5.2 Dataset and Evaluation Methodology . . . 68
5.2.1 Description of the Games . . . 68
5.2.2 Source Videos . . . 69
Contents xvii
5.3 Subjective Assessment . . . 72
5.3.1 Test Environment and Set up . . . 73
5.3.2 Subjective Scores . . . 74
5.4 Objective Assessment . . . 75
5.4.1 Objective Metric Performance Evaluation . . . 75
5.4.2 Effect of Temporal Pooling on VQA Performance . . . 80
5.4.3 Effect of Content Complexity on VQA Performance . . . 82
5.5 Conclusion . . . 84
6 No-reference Video Quality Estimation Based on Machine Learn-ing for Passive GamLearn-ing Video StreamLearn-ing Applications 87 6.1 Introduction . . . 88
6.2 Related Work . . . 89
6.3 Datasets . . . 92
6.3.1 Description of the Datasets . . . 94
6.3.2 Test Environment and Set up . . . 95
6.3.3 Aligning Subjective Tests Scores . . . 95
6.4 Methodology . . . 96
6.4.1 Feature Extraction . . . 97
6.4.2 Feature Selection . . . 99
6.4.3 Model Development. . . 99
6.5 NR Estimation of Subjective Scores (Mean Opinion Scores (MOS)) 101 6.5.1 Feature Selection and Model Development . . . 101
6.5.2 Discussion on Feature Selection . . . 106
6.6 NR Estimation of FR Objective Metric (Video Multimethod Assess-ment Fusion (VMAF)) . . . 106
6.6.1 Feature Reduction and Model Development . . . 107
6.7 Discussion . . . 113
6.8 Conclusion . . . 115
7 Conclusions and Future Work 117 7.1 Overview. . . 117
7.2 Research Outcomes . . . 118
7.3 Future Work . . . 120
List of Figures
1.1 Average concurrent streamers and viewers by platform. Adaptedbased on input from [8]. . . 4
1.2 Illustration of cloud gaming and passive gaming video streaming. . 5
2.1 HTTP Adaptive Streaming (HAS) Schematic (Q3, Q2 and Q1 denotes high, medium and low quality level respectively). . . 13
2.2 Video quality switching dimensions. . . 14
2.3 Quality of Service (QoS) and QoE encapsulation. . . 16
2.4 Subjective test procedure used in this thesis. . . 20
2.5 VMAF system diagram. Reproduced from [29]. . . 22
2.6 Full Blind/Referenceless Image Spatial Quality Evaluator (BRISQUE) workflow [37]. . . 24
2.7 Full Natural Image Quality Evaluator (NIQE) workflow [37]. . . 25
2.8 QoE Management Process. . . 26
2.9 HEVC video encoder (with decoder modeling elements shaded in light gray) Courtesy of [50]. . . 32
3.1 Sample videos used in this work.. . . 44
3.2 Spatial-Temporal plot for the videos used in this work. . . 45
3.3 Objective quality vs. Bitrate for three codecs for one of the sample videos (Counter Strike: Global Offensive (CSGO)). . . 51
3.4 Objective quality vs. Bitrate for three codecs considering the average value of the respective score of the eight video sequences. . . 52
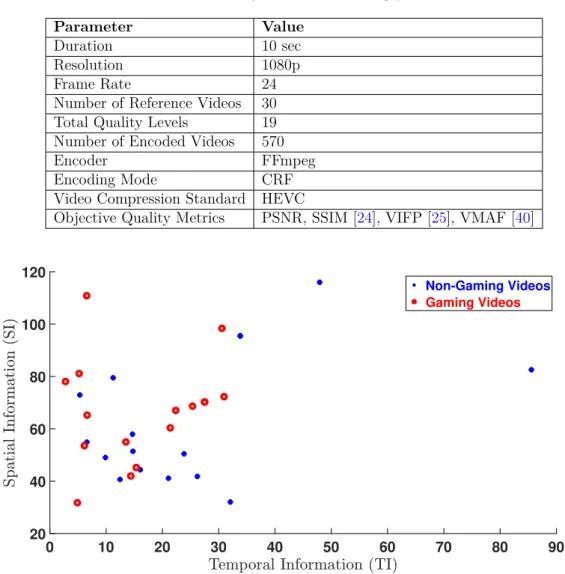
4.1 Some of the sample non-gaming and gaming videos used in this work. 56 4.2 Spatial Information (SI) vs. Temporal Information (TI) plot of the videos used in this work. . . 57
4.3 Box Plot for SI values of the 30 reference videos used in this work (Videos 1-15, Green: non-gaming videos; Videos 16-30, cyan, dashed boxes: gaming videos). . . 58
4.4 Box Plot for TI values of the 30 reference videos used in this work (Videos 1-15, Green: non-gaming videos; Videos 16-30, cyan, dashed boxes: gaming videos). . . 59
xx List of Figures
4.5 Quality (VMAF)-Bitrate curves for the 15 non-gaming videos (top) and the 15 gaming videos (bottom) encoded at 19 different Constant Rate Factor (CRF) values. . . 59
4.6 MOS vs. objective metrics for the twelve videos. . . 62
4.7 The heatmap of the Partial PSNR (PPSNR) values (dB) for a sample gaming video sequence, Defense of the Ancients 2 (Dota2). . . 63
4.8 Venn Diagram illustrating the percentage of test participants inter-ested in the three activities. . . 65
5.1 Screenshots of the gaming videos used in this work . . . 69
5.2 SI and TI plot for the 24 gaming video sequences. . . 71
5.3 Box plot of SI (top) and TI (bottom) values for short duration gaming video sequences. . . 72
5.4 Barplots of video quality ratings for the six selected games for the used bitrates at different resolutions. . . 74
5.5 Heat map of acceptance rate at each video quality level (regardless of condition) for six gaming video sequences. . . 75
5.6 MOS (with 95% confidence interval), Peak Signal to Noise Ratio (PSNR) and VMAF values for the CSGO video sequence at different resolution-bitrate pairs. A similar behavior is observed for other video sequences (relevant results not reported here due to lack of space). . . 78
5.7 Scatter plot showing the variation of the NR metrics and PSNR wrt. VMAF scores considering all three resolutions over the whole dataset. 80
6.1 Some of the sample videos used in this work. . . 89
6.2 SI and TI plot for 12 gaming video sequences, six each from Gam-ingVideoSET and KUGVD. . . 94
6.3 Scatter plot of MOS scores and the linear fit corresponding to the anchor conditions (15 conditions of CSGO sequence). . . 96
6.4 Methodological framework used in this work. . . 97
6.5 Pearson Linear Correlation Coefficient (PLCC) (%) variation with different number of features, for different training and test scenarios. 103
6.6 Histogram showing the distribution of the Quality (VMAF) of the encoded video sequences from GamingVideoSET used for training of the model. . . 108
6.7 Impact of number of features on prediction accuracy for Gaussian Process (GP), MLP, Support Vector Regression (SVR), and Random Forest (RF) learning algorithms. . . 110
List of Figures xxi
6.8 Prediction performance of GP, MLP, RF and SVR prediction models on the training dataset (GamingVideoSET). . . 111
6.9 No-Reference Gaming Video Streaming Quality Estimator (NR-GVSQE) (Predicted VMAF) scores vs. (true) VMAF scores considering
List of Tables
3.1 Resolution-Bitrate pairs for all three codecs. . . 453.2 Encoder settings summary. . . 46
3.3 BD-BR Results (PSNR-based) for all videos. . . 48
3.4 Encoding Run Times (in seconds) for 1080p resolution videos. . . . 49
4.1 Summary of video encoding parameters. . . 57
4.2 PLCC and Spearman’s Rank Correlation Coefficient (SROCC) values of four objective metric scores with respect to MOS values . . . 62
5.1 Summary of selected games, respective genre and Twitch.tv ranking (RPG: Role Playing Game; MOBA: Multiplayer Online Battle Arena;
MMORPG: Massively Multiplayer Online Role-playing Game) . . . 70
5.2 Summary of video encoding parameters. . . 72
5.3 Resolution-Bitrate pairs used to obtain distorted (compressed) video sequences. The bitrates in bold text refer to the bitrates used in the subjective quality assessment. . . 72
5.4 Comparison of the performance of the VQA metric scores with MOS ratings in terms of PLCC and SROCC values. All Data refers to the combined data of all three resolution-bitrate pairs. The best performing metric is shown in bold. . . 76
5.5 Comparison of the performance of the VQA metric scores with VMAF scores in terms of PLCC and SROCC values. All Data refers to the combined data of all three resolution-bitrate pairs. The best performing metric is shown in bold. . . 77
5.6 Comparison of the performance of the VQA metric scores with MOS scores in terms of PLCC values for various pooling strategies. The pooling strategy with the highest score for a given VQA metric is shown in bold. . . 82
5.7 Comparison of the performance of the VQA metric scores with MOS scores in terms of PLCC values for various pooling strategies considering different complexity classes. The pooling strategy with the highest score for a given VQA metric for a certain complexity class is shown in bold. . . 83
xxiv List of Tables
6.1 Overview of the two datasets used in this work. . . 93
6.2 Resolution-Bitrate pairs of compressed video sequences. . . 94
6.3 Summary of the fifteen NR Features used in this work. The descrip-tion of some of the features (those extracted using the tool [125]) is based on the description in [126] and [127]. . . 98
6.4 Correlation (PLCC) between the various features and MOS. . . 99
6.5 Performance of various feature subsets for different training and test dataset combinations. The best performing cases are shown in bold. 103
6.6 VQA metrics performance on the two datasets. The proposed metric’s performance is shown in bold. . . 105
6.7 Correlation (PLCC) between the various features considering all 576 sequences from GamingVideoSET.. . . 107
6.8 Results of model development for different sub-features using GP, MLP, SVR and RFML algorithms. The best performing result is shown in bold italics. . . 108
6.9 Correlation (PLCC) of various VQA metrics and the proposed model, NR-GVSQE, w.r.t VMAF scores for KUGVD dataset. The best performing model is shown in bold. . . 112
6.10 Performance evaluation in terms of PLCC and SROCC of (true) VMAF and NR-GVSQE (predicted VMAF) scores w.r.t MOS scores from KUGVD dataset (excluding 15 anchor conditions). . . 113
List of Acronyms
ACR Absolute Category Rating
ACR-HR ACR with Hidden Reference
AOM Alliance for Open Media
AVC Advanced Video Coding
BR bitrate
BD-BR Bjontegaard-Delta Bitrate
BIQI Blind Image Quality Index
BP-ANN Back-Propagation Artificial Neural Network
BRISQUE Blind/Referenceless Image Spatial Quality Evaluator
CABAC Context-Adaptive Binary Arithmetic Coding
CAVLC Context-Adaptive Variable-Length Coding
CBR Constant Bitrate
CDN Content Delivery Network
CRF Constant Rate Factor
CSGO Counter Strike: Global Offensive
CTU Coding Transform Unit
CUQI Cardiac Ultrasound Video Quality Index
DASH Dynamic Adaptive Streaming over HTTP
DCR Degradation Category Rating
Diablo Diablo III
DCT Discrete Cosine Transform
DSCQS Double Stimulus Continuous Quality Scale
DLM Detail Loss Metric
DSIS Double Stimulus Impairment Scale
FIFA FIFA
FPS First Person Shooter
fps frames per second
FHD Full HD
FR Full-Reference
GOP Group of Pictures
GP Gaussian Process
GTA Grand Theft Auto
H1Z1 H1Z1: Just Survive
HAS HTTP Adaptive Streaming
HD High Definition
HDR High Dynamic Range
HDS Adobe HTTP Dynamic Streaming
HEVC High Efficiency Video Coding
HLS HTTP Live Streaming
HLS HTTP Live Streaming
HS Heathstone
HVS Human Visual System
IQA Image Quality Assessment
JCT-VC Joint Collaborative Team on Video Coding
LF Light Field
LoL League of Legends
MAE Mean Absolute Error
MLP Multilayer Perceptron
MOS Mean Opinion Scores
MPEG Moving Pictures Expert Group
MSCN Mean Subtracted Contrast Normalized
MSE Mean Square Error
MSS Microsoft Smooth Streaming
NFS Need for Speed
NIQE Natural Image Quality Evaluator
NN Neural Network
NR No-Reference
NR-GVSQE No-Reference Gaming Video Streaming Quality Estimator
NR-GVSQI No-Reference Gaming Video Streaming Quality Index
NSS Natural Scene Statistics
OTT Over The Top
OR Outlier Ratio
PC Project Cars
PCA Principal Component Analysis
PLCC Pearson Linear Correlation Coefficient
PLR Packet Loss Ratio
PSNR Peak Signal to Noise Ratio
PPSNR Partial PSNR
QoE Quality of Experience
QoS Quality of Service
QP Quantization Parameter
RD Rate-Distortion
RES Resolution
RF Random Forest
RMSE Root Mean Square Error
ROI Region of Interest
RR Reduced-Reference
SA Spatial Activity
SAO Sample Adaptive Offset
SC Starcraft 2
SD Standard Definition
SI Spatial Information
SpEEDQA Spatial Efficient Entropic Differencing for Quality Assessment
SROCC Spearman’s Rank Correlation Coefficient
SSIM Structural Similarity
SSCQE Single Stimulus Continuous Quality Rating
ST-RRED Spatio-Temporal-Reduced Reference Entropic Differences
SVM Support Vector Machine
SVR Support Vector Regression
TA Temporal Activity
TCP Transmission Control Protocol
TI Temporal Information
VMAF Video Multimethod Assessment Fusion
VOD Video-on-demand
VQA Video Quality Assessment
VQEG Video Quality Experts Group
VBR Variable Bit Rate
VIF Visual Information Fidelity
VIFP Visual Information Fidelity - Pixel Domain
VR Virtual Reality
WEKA Waikato Environment for Knowledge Analysis
Video games are bad for you? That’s what they said about rock ’n’ roll.
— Shigeru MiyamotoRepresentative Director/Fellow, Nintendo
1
Introduction
Contents
1.1 Gaming Entertainment . . . . 3 1.2 Objectives . . . . 5 1.3 Contributions to Knowledge . . . . 8 1.4 Ethics Consideration . . . . 9 1.5 Thesis Structure . . . . 10 12 1. Introduction
Humans like to be entertained and visual information is one of the most preferred forms of entertainment, courtesy of the fact that 70-90% of the neurons in the human brain is dedicated to vision [1]. The advancements in the field of video streaming have recently resulted in the rise of both Video-on-demand (VOD) (YouTube, Netflix, Amazon Video, Hulu, etc.) and Live (Twitch.tv, YouTubeGaming, Facebook Live Stream, etc.) streaming services. As evident, video streaming is not a niche market anymore, and there exist a wide range of options for the consumers to choose from. Hence, as a service provider, it is no more sufficient just to provide a service, but it is equally important to make sure that the needs and expectations of the end user of the offered services are met.
One of the reasons behind the rising popularity of such Over The Top (OTT)1
services is the constant improvement of the streaming technologies. There has been a considerable amount of work on video delivery over the Internet to meet this increased demand. With the deployment of new wireless technologies such as 4.5G LTE-Advanced, the available end-user bandwidth has increased considerably over the recent years, and it will further increase with 5G systems. OTT services are usually of two types: VOD and Live. VOD refers to the services which allow users to select and watch content as per their own choice. The content is usually encoded and put in a suitable container on the service providers’ server or a Content Delivery Network (CDN). The user then can select and demand which videos to watch and when. Services offering VOD have in recent years grown in much popularity such as the likes of YouTube, Netflix, Amazon Prime Video, Hulu etc. as they give the users more freedom on the choice of any content, any place and any time. Since the content can be prepared and stored (cached) without strict time constraints, such services can benefit from optimized encoding settings (e.g., Variable Bit Rate (VBR), multiple pass, per-title encoding [2], dynamic optimizer [3]) and client side optimization techniques (buffering, etc.). In VBR mode of encoding, the encoded audio or video data rate can vary over the duration of the audio or video depending on the content complexity. Multiple pass encoding allows the encoder to estimate the content complexity and hence achieve a better rate-distortion trade-off, resulting in higher quality encodes as compared to single pass encoding. Buffering refers to the downloading and storing of data ahead of time so that playback can continue without interruption in case of changing network throughput. Hence, such approaches can help mitigate some factors to improve the end user Quality of Experience (QoE).
1OTT media services refers to the services which provides delivery of media content via the
1. Introduction 3
In contrast, live streaming services are streamed in real-time and hence have strict encoding requirements. Due to the nature of such services, users generally have less tolerance towards playback issues such as stalling/rebuffering, low picture quality, etc., as that may result in missing out on an essential part of the stream (e.g., a player being bowled out during a cricket match). Traditionally used methods to overcome network outages, such as buffering, have limited applicability, as the media to be streamed is not yet created. Therefore, live streaming services have a different set of constraints and requirements than that of VOD streaming services, which need to be taken into account in order to improve the end user QoE.
The growth and success of existing and new services, in the end, depends on the acceptance by the end user. With the proliferation of many streaming services as well as the introduction of the latest video formats and services, the user has many options to choose from. Hence, it is no more sufficient for a service provider to just provide a service but also meet user expectations and satisfaction. Traditionally, the performance and hence success of a service has been based on Quality of Service (QoS) estimation which involves the measurement of network parameters such as Packet Loss Ratio (PLR), throughput, delay, jitter, etc. Such an approach does not necessarily correlate well with user expectations and experience. QoE, on the other hand, takes into account user expectations and experience and hence is considered a better indicator of user level satisfaction. This has led to a shift from traditional technical QoS based assessment (see, e.g., [4]) to QoE based assessment (see, e.g., [5], [6]).
1.1
Gaming Entertainment
Gaming has always been a prevalent and widely accepted form of entertainment, especially for the younger generation (usually 16-34 year olds). Over the years, it has evolved and come a long way from small abstract games, such as Mario and Pacman, to very complex and realistic games such as Battlefield, Grand Theft Auto (GTA), etc. A recent survey shows that over 87% of the internet users reportedly have played games on at least one device [7]. Gaming video streaming, in general, can be divided into two major applications: interactive (also called cloud gaming) and passive (also called spectator gaming).
Cloud gaming refers to applications such as PlayStation Now2 and GeForce
Now3, where the gameplay is performed by the user using the cloud services offered
2https://www.playstation.com/en-gb/explore/playstation-now/ 3https://www.nvidia.com/en-us/geforce/products/geforce-now/
4 1.1. Gaming Entertainment
by the client. Such applications eliminated the need for high performance hardware at the client (user) side while also addressing security and piracy concerns. Recent years have seen increasing acceptance of such services by the gaming community. Another form of gaming which has gained attention in recent years is mobile gaming, where the users primarily use their mobile devices such as tablets and smartphones to play games. Mobile gaming continues to grow in popularity due to the huge potential in monetization and improvements in the new generation smartphones. Mobile gamers nowadays spend approx. 3 hours and 20 minutes per day online via their smartphone [7]. With the rise of gaming and the growth of the gaming community worldwide, a new form of gaming termed as passive gaming video streaming (also referred to as Spectator Gaming) has gained popularity. A recent survey in [7] shows that 1 in 4 gamers have watched a live gaming stream in the past month with 18% having watched an eSports tournament. The increasing popularity of such genre of entertainment has lead to the rise of OTT streaming services such as Twitch.tv and YouTube gaming, with Twitch.tv alone consisting of over 2 million monthly streamers and over 15 million daily active visitors with almost a million concurrent users making it the 4th largest peak traffic generator in
the US, just after top three OTT on-demand streaming services, Netflix, Google and Apple. Figure 1.1 shows the number of average concurrent viewers and streamers for various live streaming platforms.
Figure 1.1: Average concurrent streamers and viewers by platform. Adapted based on
input from [8].
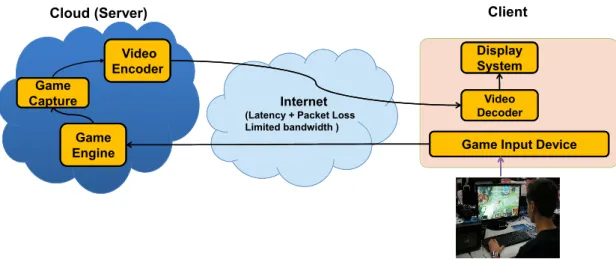
Figure 1.2a describes the major components and process of cloud gaming. The game engine processes the game related input commands which are then encoded
1. Introduction 5 Cloud (Server) Game Engine Video Encoder Internet
(Latency + Packet Loss Limited bandwidth )
Client
Game Input Device
Video Decoder Display System Player Game Capture Game Capture
(a) Illustration of cloud gaming concept. Designed with input from [9].
Game Engine Game Engine Video Encoder Video Encoder Player Distributor
(e.g., Twitch, YouTubeGaming) Viewers
Internet Server Game Input Device Broadcaster Game Capture Game Capture
(b) Illustration of passive gaming video streaming applications (Spectator Gaming).
Figure 1.2: Illustration of cloud gaming and passive gaming video streaming.
in a suitable format by the video encoders to be displayed at the end user after decoding using the video decoder. The encoding is challenging because, during transmission through the internet, the video could be impaired by many factors such as packet loss, delay, bandwidth limitation etc., hence affecting the end user received gaming video quality. Figure 1.2b shows the process of passive online gaming video streaming services over the internet as provided by Twitch.tv and YouTubeGaming. In such applications, the gameplay is usually performed at the client end. The gameplay video and/or audio is then encoded using a video encoder and sent over the internet to the respective OTT server which then transcodes it into different representations and then transmits them to the end user.
1.2
Objectives
This research aims to investigate gaming video quality using subjective and objective quality assessment methods considering passive live gaming video streaming
applica-6 1.2. Objectives
tions such as Twitch.tv, YouTubeGaming, etc. The major objectives of this work are:
(a) To evaluate the compression efficiency of the three most popular compression standards: H.264/AVC, H.265/HEVC and VP9 considering gaming video content.
One of the solutions to reduce the increasing demand for bandwidth is by achieving higher compression efficiency during the source encoding process without loss of visual quality, thus preserving the end user QoE. Our initial investigation showed that so far all major OTT gaming video streaming providers are using the H.264 encoder. The introduction of newer encoders such as VP9 and H.265/MPEG-HEVC results in much higher compression efficiency when considering non-gaming videos but at the cost of higher computational complexity. Many previous studies, depending on the configuration and videos considered, have reported different performance results for different codecs. So far, such a performance evaluation considering gaming videos and real-time streaming scenarios is missing. Therefore, to address this research gap, an objective evaluation of eight most popular games encoded using H.264/MPEG-AVC, H.265/MPEG-HEVC and VP9 encoders for live game video streaming applications as currently used by Twitch.tv and YouTubeGaming is performed. The results are reported in terms of three objective video quality metrics (Peak Signal to Noise Ratio (PSNR), Structural Similarity (SSIM), Visual Information Fidelity - Pixel Domain (VIFP)), Bjontegaard-Delta Bitrate (BD-BR) analysis, and encoding duration.
(b) To study and evaluate if there exist any objective and subjective difference in terms of the trade-off between quality and data-rate after compression between gaming and non-gaming videos.
Gaming videos are artificial and synthetic, and hence the user may perceive the quality differently and have a different set of expectations from such services. Additionally, they have different streaming requirements which can lead to a difference in QoE of the end user as compared to services streaming non-gaming videos. Therefore, it is worth investigating the specificity of non-gaming videos in relation to compression and the resulting end-user QoE. Towards this end, an objective and subjective quality comparison study for non-gaming videos and gaming videos, with 30 video sequences (15 per type), encoded using the High Efficiency Video Coding (HEVC) compression standard is carried out. The study to evaluate potential similarity and dissimilarity between the two video types is carried out considering various objective and subjective aspects.
1. Introduction 7
(c) To create a dataset of gaming videos to support reproducible research in the field of gaming video streaming.
One of the reasons behind the growth of the research in Video Quality Assessment (VQA) was the availability of publicly available databases. Such open source datasets have often been used by researchers as a baseline for performance evaluation of various existing and newly proposed quality estimation methods, hence helping in the advancement of the field of quality assessment. Therefore, an openly available dataset for gaming content will allow researchers to gain comparable and more generalizable results for gaming content, e.g., for VQA, QoE prediction modeling, and selection of optimized encoding settings. Towards this end, the GamingVideoSET dataset, consisting of twenty-four uncompressed raw gaming videos of 30 seconds duration, 1080p resolution, and 30 fps, is designed. The dataset includes subjective quality assessment results for 90 video sequences. In addition to the reference videos, the objective quality assessment results (average and per-frame) using three video quality assessment metrics is available for 576 video sequences obtained by encoding the reference videos in 24 different resolution-bitrate pairs.
(d) To evaluate the performance of the state-of-the-art VQA metrics for gaming videos considering real-time passive gaming video streaming applications. Video quality assessment is imperative to estimate and hence manage the QoE in video streaming applications to the end-user. Recent years have seen tremendous advancement in the field of objective VQA metrics, with the development of models that can predict the quality of the videos streamed over the Internet. However, no work so far has attempted to study the performance of such quality assessment metrics on gaming videos, which are artificial and synthetic and have different streaming requirements than traditionally streamed videos. To address this research gap, a study of the performance of objective quality assessment metrics for gaming videos considering passive streaming applications is carried out. Additionally, various temporal pooling methods are evaluated to see their effect on the performance of the evaluated VQA metrics.
(e) To design lightweight, machine learning based No-Reference (NR) VQA met-rics for passive gaming video streaming applications.
Previous gaming video quality assessment studies indicated a not so satisfac-tory performance of existing NR VQA metrics. Also, due to the inherent nature
8 1.3. Contributions to Knowledge
and different requirements of gaming video streaming applications, as well as the fact that gaming videos are perceived differently from non-gaming content (as they are usually computer generated and contain artificial/synthetic content), there is a need for application specific light-weight, no-reference gaming video quality prediction models. To address this requirement, two NR machine learning based quality estimation models for gaming video streaming, NR-GVSQI, and NR-GVSQE, using NR features such as bitrate, resolution, blockiness, etc. are designed.
1.3
Contributions to Knowledge
The contributions to knowledge as an outcome of my PhD research are listed below.
(a) A performance evaluation of three widely used codecs, H.264/MPEG-AVC, H.265/MPEG-HEVC, and VP9, for performance efficiency in terms of BD-BR savings and encoding times considering gaming videos is carried out. For the encoding settings and the encoders used, in terms of BD-BR analysis, H.265/MPEG-HEVC is found to provide the best compression efficiency but is 2.6 times slower than H.264/MPEG-AVC. The magnitude of bitrate savings for VP9 compared to H.264/MPEG-AVC is found to be highly dependent on the content type, with H.264/MPEG-AVC resulting in higher average bitrate savings with an encoding speed four times faster than VP9.
(b) A comparative objective and subjective study of the difference between gaming and non-gaming content in terms of the trade-off between quality and data-rate after compression is carried out. For the same encoding settings, in terms of the correlation between objective and subjective scores, it was found that, in general, non-gaming videos achieved a higher correlation score when compared to that of gaming videos, a possible reason for which is attributed to subject bias.
(c) An open source gaming video dataset called GamingVideoSET consisting of 24 reference videos and 576 distorted videos is created to encourage reproducible research in the field of gaming video streaming. The data set includes subjec-tive quality assessment results for 90 video sequences obtained by encoding six different gaming videos using the H.264/MPEG-AVC codec standard in 15 different resolution-bitrate pairs (three resolution, five bitrates each). In addi-tion to the reference videos, the dataset offers a total of 576 distorted videos in
1. Introduction 9
MP4 format, obtained by encoding the videos in 24 different resolution-bitrate pairs, and their objective quality assessment results (average and per-frame) using three video quality assessment metrics. The dataset is freely available for research use at https://kingston.box.com/v/GamingVideoSET.
(d) A performance evaluation study of the eight most popular VQA metrics is carried out. The performance of existing NR metrics is found to be not so satisfactory. A performance evaluation of the metrics using different temporal pooling methods is performed. The results indicate that while depending on the metric, there exist a particular pooling strategy other than normal mean, no single pooling strategy increases the performance of all metrics as compared to the simple mean temporal pooling. Also, an analysis of these metrics as per video content complexity class and different pooling methods is carried out.
(e) Two machine learning based NR metric for passive gaming video streaming applications are proposed. Different features such as bitrate, resolution, contrast, blur, etc. are extracted from the videos at frame level which are then averaged for the whole duration of the videos and then used as input to the machine learning algorithms. The models are trained using subjective and objective measurement as the target, respectively. For the purpose of testing, the existing dataset, another open source dataset, KUGVD, which consists of both subjective (Mean Opinion Scores (MOS)) ratings and objective analysis considering six gaming videos is designed using encoding settings similar to that of GamingVideoSET. The performance evaluation of the two proposed metrics on the two gaming video datasets shows that the proposed models outperform the current state-of-the-art NR metrics, while also reaching a prediction accuracy comparable to the best known Full-Reference (FR) metric.
1.4
Ethics Consideration
This research involved conducting several subjective quality assessment tests that required human subjects to watch (gaming) videos encoded using different conditions and provide their opinions. The test participants were recruited on a volunteer basis and were briefed about the tests, and their questions and concerns were addressed. Taking into account that some games might include violent scenes, special consideration was taken to remove/minimize the violent content and the test participants were allowed to leave the test anytime they wanted. Any personal
10 1.5. Thesis Structure
information collected was stored securely and was not used in any of the results presented in this thesis. The necessary ethics approval for the research was obtained from the Faculty Research Ethics Committee, Kingston University within the scope of Horizon 2020 Marie Skłodowska-Curie Initial Training Network QoENet4.
1.5
Thesis Structure
Chapter 2 introduces the field of QoE starting with an introduction of QoE - its definition, influence factors and modeling. Different VQA methodologies are discussed followed by a brief literature review of content and context aware video encoding approaches.
Chapter 3reports the work addressing our first objective where three most widely used codecs are compared for their compression efficiency and encoding run times considering gaming video streaming application scenarios.
Chapter 4presents a comparative quality assessment study for gaming and non-gaming videos addressing our second objective. Using subjective and objective quality assessment methods, fifteen different gaming and non-gaming videos encoded using HEVC compression standard are analyzed to investigate the possible difference between gaming and non-gaming videos.
Chapter 5 first introduces the open-source dataset, GamingVideoSET which is designed in line with our third objective. The performance evaluation study of eight most popular VQA metrics addressing our fourth objective is also presented in this chapter along with a discussion on the effect of different temporal pooling strategies and content complexity on the performance of different VQA metrics.
Chapter 6 presents our work on the design of two machine learning based NR metrics for quality evaluation of gaming video streaming applications which addresses our fifth objective. An additional open source gaming video streaming dataset KUGVD is also introduced in this chapter.
Chapter 7 concludes this thesis with a discussion of the research findings and potential future work.
I’m not young enough to know everything.
— J. M. BarrieThe Admirable Crichton, Act I (1903)
2
Background
Contents
2.1 Introduction . . . . 12
2.2 HTTP Adaptive Video Streaming . . . . 12
2.3 QoE: Definition and Assessment Methodologies . . . . 15
2.4 VQA Methodologies . . . . 18
2.5 Importance of QoE Modeling and Performance
Eval-uation of QoE Models . . . . 26
2.6 QoE Awareness for Video Coding . . . . 29
2.7 Conclusion . . . . 36
Part of the content of this chapter has been published as: N. Barman and M. G. Martini,
QoE Modeling for HTTP Adaptive Video Streaming–A Survey and Open Challenges, inIEEE Access, vol. 7, pp. 30831-30859, 2019.
12 2.1. Introduction
2.1
Introduction
The Cisco Visual Networking Index forecasts an increase in Internet traffic, with video alone being 82% of the net consumer Internet traffic by 2021 [10]. With the emerging video formats (e.g., Ultra High Definition (UHD), High Dynamic Range (HDR), Light Field (LF)) and new services such as Virtual Reality (VR), Social-TV, cloud gaming, the available network technology will not be able to meet the increased demand for high bandwidth for all the users and to satisfy users’ expectations for any content, any place, any time. Depending on the streaming supply chain stage, there exist different strategies that can be used to optimize the available resources, such as encoding (e.g., VBR, multiple pass, per-title encoding [2], dynamic optimizer [3])), network (resource allocation, load balancing, scheduling, caching etc.) and client (buffering, media representation adaptation etc.). This thesis mainly deals with the encoding process and takes into account HTTP Adaptive Streaming (HAS) based applications (see Section 2.2) considering a live gaming video streaming application. Network and client side optimization methods are not investigated in this thesis.
Towards this end, we present in this chapter an overview of the various tech-nologies and methods considered in this thesis. We start with an introduction of the HAS technology in Section 2.2 followed by a discussion on QoE, its definition, objective and subjective quality assessment methodologies and classification of various factors which might affect the end user QoE in Section 2.3. Section 2.5 discusses the importance of QoE modeling from various stakeholder’s perspective. In Section 2.4, various subjective and objective quality assessment methodologies are presented along with a discussion of their advantages and disadvantages. Section 2.6 presents a brief review of the different content and context aware approaches for video encoding followed by a discussion of how requirements of a quality assessment model vary depending on the application scenario under consideration. Chapter 2.7 concludes this chapter along with a discussion of the major learnings and the identified research gap in the field of passive gaming video streaming applications.
2.2
HTTP Adaptive Video Streaming
In this thesis, we focus exclusively on HAS applications using reliable delivery mechanisms such as Transmission Control Protocol (TCP) and Quick UDP Internet Connections (QUIC). Reliable transport protocols such as TCP make sure that all data will be delivered correctly to the destination process without any errors. This
2. Background 13
Internet
Q u al it y Q u al it y Time Time Q3 Q2 Q1 Q3 Q2 Q1 Q3 Q2 Q1 TCP T h ro u gh p u t TCP T h ro u gh p u t Time TimeWeb Server End User
Device Q u al it y Q u al it y Time Time Q u al it y Time Q2
Figure 2.1: HAS Schematic (Q3, Q2 and Q1 denotes high, medium and low quality
level respectively).
is usually achieved by a connection oriented approach between the sender and the receiver with the receiver acknowledging the receipt of packets and retransmission of lost or erroneous packets. HAS is one of the most popular streaming technologies for video delivery over the Internet, currently used by the primary OTT providers such as Netflix, YouTube and Twitch.tv. Some of the most widely used implementations of HAS include: Adobe HTTP Dynamic Streaming (HDS) [11], HTTP Live Streaming (HLS) [12], Microsoft Smooth Streaming (MSS) [13] and Dynamic Adaptive Streaming over HTTP (DASH) [14]. The first three are proprietary and vendor specific HAS implementations while DASH, also commonly known as MPEG-DASH, is an open source international standard developed by Moving Pictures Expert Group (MPEG) [15]. The underlying logic is common in all these implementations with some differences in the manifest file, recommended segment size, etc.
2.2.1
Concept Overview
Figure 2.1 illustrates the basic concept behind HAS applications. The video file is encoded at different representation levels (see Section 2.2.2) and then divided into chunks (also referred to as segments) of equal duration (often 2, 4 or 10 seconds, but depends on the standard) which are then stored on a server. The reverse process of first segmenting and then encoding can also be used, as currently done by most of the OTT providers to speed up the encoding process. When a first request for the video file is made by the client, the server sends the corresponding
14 2.2. HTTP Adaptive Video Streaming
manifest file (e.g., .mpd for DASH, .m3u8 for HLS) which consists of the details about the video file such as video duration, segment size, available representation levels, codec, etc. The client then requests for video chunks based on its rate adaptation logic. The client’s rate adaptation logic can be broadly categorized into the throughput-based, buffer-based and hybrid approach. A comprehensive survey of the rate adaptation methods for HAS can be found in [16]. Figure 2.1 illustrates the concept of streaming assuming a throughput-based rate adaptation method. It can be observed that the client, based on its network condition, adapts the quality of the video to provide a smooth streaming experience to the end user.
2.2.2
Quality Switching Dimensions
Videos can be encoded at different bitrates (quality levels) by adjusting one/two/all of the following parameters: spatial resolution, frame rate and Quantization Parameter (QP). A bitrate decrease usually indicates lower quality but the reverse does not necessarily holds true, i.e., increasing the bitrate after a certain threshold (which depends on the video content type) does not necessarily result in higher (perceived) quality videos. Figure 2.2 illustrates the adaptation dimensions for
video encoding. Temporal Adaptation Qua lity Ada ptat ion S p a ti a l A d a p ta ti o n
Figure 2.2: Video quality switching dimensions.
1. Spatial Adaptation: The videos are encoded at different resolutions, hence decreasing the number of pixels in the vertical and/or horizontal dimensions.
2. Temporal Adaptation: The temporal resolution of the video is decreased by dropping some of the frames, i.e., encoding a lower number of frames per second, hence reducing the encoded bitrate.
2. Background 15
3. Quality Switching: Increasing (decreasing) QP values results in an allocation of less (more) bits per pixel, hence resulting in lower (higher) bitrate values.
The actual dimensions of adaptation depend on the application type and also on the content type. For most content types, compression based quality is considered the most important dimension. For similar bitrate values, spatial resolution reduction is perceived better than frame rate reduction (the actual impact of upscaling depends on the specific player used for video playback at the end user device), hence resolution is one of the most widely used adaptation dimensions [17]. For smaller screen sized devices such as mobile, tablets, etc., spatial resolution plays an important role in QoE. In general, in HAS, adaptation in multiple dimensions is perceived better than a single dimension adaptation [18] and hence is widely used by major OTT providers.
2.3
QoE: Definition and Assessment
Methodolo-gies
2.3.1
QoE Definition
The EU Qualinet community (COST Action IC1003: “European Network on Quality of Experience in Multimedia Systems and Services”) defines QoE as “QoE is the degree of delight or annoyance of the user of an application or service. It results from the fulfillment of his or her expectations with respect to the utility and/or enjoyment of the application or service in the light of the user’s personality and current state”, which has since then also been adopted by ITU-T as the definition of QoE [19, 20]. QoE takes into account the end user’s experience and level of satisfaction and is of much interest to both academic and industrial players in the field of multimedia. Understanding the end users’ expectations and experience is paramount to the development of future services as well as improvement of the existing technologies and services. While traditionally QoS has been used to measure the effectiveness of a service, it fails to take into account end user related factors (user expectation, environmental factors, etc.). Also, QoS is limited to telecommunication services and relies only on technical measurements. QoE, on the other hand, covers domains beyond telecommunications and is multidisciplinary in nature, including domains such as psychology, business, technical, environmental, etc. Figure 2.3 illustrates the encapsulation of QoS and QoE.
16 2.3. QoE: Definition and Assessment Methodologies
QoE
QoS
Throughput, packet loss ratio, delay, jitter, etc.
Human/User factors, Context factors, etc.
Figure 2.3: QoS and QoE encapsulation.
2.3.2
QoE Influence Factors
A QoE influence factor is “any characteristic of a user, system, service, application, or context whose actual state or setting may have an influence on the QoE for the user” [19]. As defined in ITU-T Rec. P.10/G.100 Amendment 5, QoE influence factors include the type and characteristics of the application or service, context of use, the user’s expectations with respect to the application or service and their fulfillment, the user’s cultural background, socio-economic issues, psychological profiles, emotional state of the user, and other factors whose number will likely expand with further research [20]. Influence factors on QoE can be grouped into the following four categories as described by the authors in [21].
System IFs
System IFs mostly consist of the technical aspects of quality, for example, the ones which can be measured using QoS based measurement approaches. They cover a wide range of aspects such as media related (quality switching events), network related (wired/wireless/mobile, bandwidth, delay, jitter, packet loss, etc., resulting in impairments such as temporal interruptions/pauses) or end-user device related (display resolution, playback capabilities such as supported codecs, formats, etc.) which affect the QoE of the end user. For example, frequent quality changes to adapt to the network bandwidth can be annoying to the end user. Hence, knowledge of such IFs can help in the design of proper strategies such as how frequently to adapt the quality, etc.
2. Background 17
Human IFs
Human or User IFs include aspects which refer to the information about the end-user and related aspects. These include individual characteristics of a end-user such as expectations from the service, memory and recency effects, usage history of the application (e.g., browsing history, frequently played video), demographic and socio-economic background, physical and mental constitution (users’ emotional state), memory, categorization, and attention among many others.
Context IFs
Context IFs deal with factors such as location, end user environment (viewing environment, acoustic conditions, etc.), time of the day, type of usage (e.g., just casual browsing, newly released episode of the favorite TV show), time of service consumption (peak time, offload time, etc.).
Content IFs
One of the most important is the content IFs which addresses the characteristics of the content. The aspects in this category include information about the content being offered by the service/application under consideration. For example, for video, the content level IFs are duration, video type and content complexity (spatial and temporal complexity).
2.3.3
QoE Assessment
ITU-T Recommendation P.10/G.100 Amendment 5 defines QoE assessment as the process of measuring or estimating the QoE for a set of users of an application or a service with a dedicated procedure and considering the influencing factors (possibly controlled, measured, or simply collected and reported) [20]. The main objective of QoE assessment is the design of a system which can identify the various factors and their influence on the end user QoE. Such information can then be used by the various stakeholders for optimization along the process of service delivery (encoding pipeline, load balancing, resource allocation, etc.) to provide a reasonable QoE to the end user while making optimized usage of the available resources. Lossy compression is usually required for multimedia data which need to be transported over the Internet, to decrease the required bandwidth and transport costs. During lossy compression, information is lost, with higher compression ratios resulting in a higher amount of information loss. Also, in traditional streaming technologies, transmission errors such as jitter, delay, packet loss, etc., lead to further artifacts
18 2.4. VQA Methodologies
which are annoying to the end user. Since it is almost impossible for most practical applications to provide a service without any artifact, a proper QoE model/metric can help quantifying the amount and kind of distortions and the magnitude of their effect on the end user QoE, which can then lead to the design of proper strategies to help minimize such artifacts.
2.4
VQA Methodologies
VQA approaches can be categorized into two main categories: objective and subjective. Objective VQA methods are mathematical models that aim at providing a quality score which closely resembles the perceived image/video quality. Subjective VQA, on the other hand, tries to take into account the user feedback in the form of ratings and targets to estimate the video quality as perceived by the end user.
2.4.1
Subjective Quality Assessment
Subjective assessment scores are typically reported as MOS which is the average of the opinion scores collected from the assessors for a given stimulus calculated as
M OS=
PN n=1Rn
N (2.1)
where N is the total number of subjects and R is the individual rating provided by a user. For repeatability and validation purpose, common guidelines for conducting subjective tests are issued in ITU-T Rec. BT.500 and ITU-T Rec. P.910 [22,
23]. These recommendations include a detailed description of the test settings, methodology and procedures that need to be followed, including data processing guidelines, such as outlier detection, etc. Some of the standardized testing methods for conducting subjective tests are briefly summarized below:
1. Absolute Category Rating (ACR): Stimulus are shown in a random order, and the test participants rate the stimulus as 1, 2, 3, 4 or 5 where the numbers correspond to Bad, Poor, Fair, Good and Excellent respectively.
2. ACR with Hidden Reference (ACR-HR): This method is similar to ACR, but here reference sequences are also added but without informing the test subject. Using the reference videos scores as the baseline, differential rating for the impaired sequence is calculated.
2. Background 19
3. Single Stimulus Continuous Quality Rating (SSCQE): Usually suitable for quality evaluation of longer sequences, here the test participants rate the video stimulus on a continuous basis which is sampled at regular intervals.
4. Double Stimulus Continuous Quality Scale (DSCQS): In this method, the reference and impaired sequences are shown in a random order. The test participants are allowed playback of sequences until they are sure and then rate the sequences.
5. Double Stimulus Impairment Scale (DSIS)/Degradation Category Rating (DCR): The reference sequence is shown first followed by the impaired sequence and subjects then rate the stimulus based on the perception of the impairments (perceptible, annoying, imperceptible etc.).
6. Pair Comparison: In this method, the two impaired sequences are compared and then rated for their quality.
ACR test methodology is easy and fast to implement which can help gather large number of ratings in a brief period of time which makes it one of the most widely used subjective test methodology in the research community including many publicly available datasets. ACR ratings confound the impact of the impairment with the influence of the content upon the subject (e.g., whether the subject likes or dislikes the production quality of the stimulus) [22]. Hence, taking into account the above-mentioned facts as well as the fact that no specific advantage offered by the other test methodologies was required in our studies, we decided to use ACR as the choice of our test methodology in this thesis. Figure 2.4 describes the subjective test procedure used in this thesis. We have used a software-based interface which displays the stimulus (videos) of duration TV followed by the interface where the test subject can rate the stimulus. The test participant can take as much time, TR, as required to rate the stimulus, and is illustrated by variable lengths of “Rate” in Figure 2.4. An option of break or “pause” is offered to the test participant if the test is of longer duration (>30 minutes) in line with the ITU-T Rec. P.910 and ITU-R Rec. BT.500.
2.4.2
Objective Quality Assessment
Based on the relationship between the input and output of the system, i.e., depending on the amount of source (reference) information required, VQA metrics can be classified as FR, Reduced-Reference (RR) and NR.
20 2.4. VQA Methodologies
Video 1 Rate Video 2 Rate Video N-1 Rate Video N Rate
TV TR TV TR TV TR TV TR
……….
[Pause]
Figure 2.4: Subjective test procedure used in this thesis.
FR Metrics
As the name suggests, FR metrics require the availability of full information of the source video. They are computed based on a frame-by-frame comparison between the reference and the distorted image/video. The source video should be available in pristine quality (unimpaired and uncompressed) so that there can be a direct comparison (e.g., pixel by pixel) between the reference and distorted image/video. Due to the availability of full source information, these metrics are usually more accurate than their counterpart (RR or NR metrics) but as such are not suitable for most real-world applications. Some of the most widely used quality metrics in the field of image and VQA are FR metrics such as PSNR, SSIM [24], VIF [25] and Video Multimethod Assessment Fusion (VMAF) [26].
PSNR is one of the most commonly used metrics for both image and video quality assessment. Even though PSNR does not correlate well with subjective scores, due to its simplicity and ease of computation, it still finds application in many image and video quality assessment fields such as rate-distortion optimization in codecs, codec comparison etc. [27]. Given a reference image (frame in case of video) IR and the corresponding distorted image, ID of size MxN, Mean Square Error (MSE) is defined as:
M SE = 1 M N M−1 X i=0 N−1 X j=0 [IR(i, j)−ID(i, j)]2 (2.2) PSNR in terms of decibels (dB) is then defined as:
P SN R= 10log10 M AX2 IR M SE (2.3)
SSIM, which computes the structural similarity between the two images, was shown to correlate better with subjective judgment and hence is also widely used for both image as well as video quality assessment. SSIM which is calculated on various windows of an image is calculated as:
SSIM(x, y) = (2µxµy+c1)(2µxσy+c2) (2µ2
x+ 2µ2y +c1)(2σx2+ 2σ2y+c2)
2. Background 21
Here the measure is considered between two windows xand yof common sizeNxN
and µx,µy, σx2, σ2y are the average of x and y and variance of xand y respectively.
σxy is the covariance ofxandy. c1 andc2 are two variables calculated as (k1L)2 and
(k2L)2 respectively wherek1 andk2 by default is equal to 0.01 and 0.03 respectively
and L is the dynamic range of the pixel-values.
Visual Information Fidelity (VIF) is an image based quality assessment metric which predicts the quality of an image based on the amount of information present in a reference image and the amount of information that can be extracted from the respective distorted image [25]. Taking into account the Human Visual System (HVS), it quantifies the amount of information that the brain can extract from a reference image which is then quantified to
![Figure 1.1: Average concurrent streamers and viewers by platform. Adapted based on input from [8].](https://thumb-us.123doks.com/thumbv2/123dok_us/509901.2560157/34.892.175.678.721.1020/figure-average-concurrent-streamers-viewers-platform-adapted-based.webp)
![Figure 2.6: Full BRISQUE workflow [37].](https://thumb-us.123doks.com/thumbv2/123dok_us/509901.2560157/54.892.144.705.163.583/figure-full-brisque-workflow.webp)
![Figure 2.9: HEVC video encoder (with decoder modeling elements shaded in light gray) Courtesy of [50].](https://thumb-us.123doks.com/thumbv2/123dok_us/509901.2560157/62.892.111.744.158.547/figure-hevc-encoder-decoder-modeling-elements-shaded-courtesy.webp)