Functional connectivity classi
fi
cation of autism identi
fi
es highly
predictive brain features but falls short of biomarker standards
Mark Plitt
a,⁎
, Kelly Anne Barnes
a, Alex Martin
aa
Section on Cognitive Neuropsychology, Laboratory of Brain and Cognition, National Institute of Mental Health, National Institutes of Health, Bethesda, MD, USA
a b s t r a c t
a r t i c l e i n f o
Article history:
Received 29 October 2014
Received in revised form 12 December 2014 Accepted 22 December 2014
Available online 24 December 2014 Previous presentation: This work is also to be presented as a poster at Society for Neuroscience, Washington, D.C., Nov. 15–19, 2014.
Keywords: Autism Biomarkers
Machine learning classification Social brain
Objectives:Autism spectrum disorders (ASD) are diagnosed based on early-manifesting clinical symptoms, in-cluding markedly impaired social communication. We assessed the viability of resting-state functional MRI (rs-fMRI) connectivity measures as diagnostic biomarkers for ASD and investigated which connectivity features are predictive of a diagnosis.
Methods:Rs-fMRI scans from 59 high functioning males with ASD and 59 age- and IQ-matched typically develop-ing (TD) males were used to build a series of machine learndevelop-ing classifiers. Classification features were obtained using 3 sets of brain regions. Another set of classifiers was built from participants3scores on behavioral metrics. An additional age and IQ-matched cohort of 178 individuals (89 ASD; 89 TD) from the Autism Brain Imaging Data Exchange (ABIDE) open-access dataset (http://fcon_1000.projects.nitrc.org/indi/abide/) were included for repli-cation.
Results:High classification accuracy was achieved through several rs-fMRI methods (peak accuracy 76.67%). However, classification via behavioral measures consistently surpassed rs-fMRI classifiers (peak accuracy 95.19%). The class probability estimates, P(ASD|fMRI data), from brain-based classifiers significantly correlated with scores on a measure of social functioning, the Social Responsiveness Scale (SRS), as did the most informative features from 2 of the 3 sets of brain-based features. The most informative connections predominantly originated from regions strongly associated with social functioning.
Conclusions:While individuals can be classified as having ASD with statistically significant accuracy from their rs-fMRI scans alone, this method falls short of biomarker standards. Classification methods provided further evi-dence that ASD functional connectivity is characterized by dysfunction of large-scale functional networks, partic-ularly those involved in social information processing.
Published by Elsevier Inc. This is an open access article under the CC BY-NC-ND license (http://creativecommons.org/licenses/by-nc-nd/4.0/).
1. Introduction
Autism spectrum disorders (ASD) are clinically characterized by marked social and communication impairments as well as restricted in-terests and repetitive behaviors. Diagnosis is typically made in early childhood based on clinical interviews and observation of behavior. There is significant need for biomarkers to improve diagnostic precision when behavioral symptoms are equivocal and to identify infants or young children who might be at risk for ASD before reliable behavioral symptoms manifest (Yerys and Pennington, 2011).
Recent studies applied multivariate classification techniques to neu-roimaging data to characterize ASD using features that are predictive of a diagnosis on the level of individuals. These classifier studies achieved
relatively high classification accuracy (~60–85%) using multiple imaging modalities including structural MRI (Sato et al., 2013;Ecker et al., 2010), diffusion tensor MRI (DTI) (Ingalhalikar et al. 2012;Lange et al., 2010), magnetoencephalography (Roberts et al., 2011) and resting-state func-tional MRI (rs-fMRI; which measures“functional connectivity”, correla-tions between spontaneous BOLD signalfluctuations in different brain regions) (Uddin et al., 2013;Nielsen and Zielinski, 2013;Anderson et al., 2011). Rs-fMRI is a particularly interesting technique as it can investigate, in a task-independent manner, the hypothesis that ASD involves the dis-ruption of large-scale brain networks (Castelli et al., 2002;Belmonte et al., 2004). These multivariate techniques have provided convergent evidence about brain differences that underlie ASD and unveiled additional infor-mative brain features.
Given the recent success of these neuroimaging methods, it is tempt-ing to cite thesefindings as grounds for establishing a neuroimaging-based diagnostic biomarker for ASD. However, several benchmarks must be met to fulfill the promise of neuroimaging-based biomarkers including: establishing standard analytic techniques, as such methodo-logical factors influence connectivity measures (Jo et al., 2013;Gotts ⁎ Corresponding author at: 10 Center Drive, MSC 1366, Bldg. 10, 4C214, Bethesda, MD
20892-1366, USA. Tel: +1 301 451 8509. E-mail address:[email protected](M. Plitt).
http://dx.doi.org/10.1016/j.nicl.2014.12.013
2213-1582/Published by Elsevier Inc. This is an open access article under the CC BY-NC-ND license (http://creativecommons.org/licenses/by-nc-nd/4.0/). Contents lists available atScienceDirect
NeuroImage: Clinical
et al. 2013;Power et al., 2014); demonstrating biomarkers3robustness to variability across larger numbers of individuals and sites—to date, only one multisite classifier study exists (Nielsen, and Zielinski, 2013); and addressing the diagnostic potential of brain-based biomarkers by comparing their diagnostic or prognostic accuracy to that of simpler, more easily obtained ratings of behavior. The present study examines each of these issues.
In this study, we determined the best methods for performing classification of ASD vs. TD participants using rs-fMRI data by applying several popular classification techniques to three separate sets of brain-based features. We also addressed classifier generalizability by in-cluding a large in-house cohort of high-functioning ASD individuals and typically developing (TD) individuals (118 total participants) and a rep-lication cohort obtained from the ABIDE dataset (178 individuals). Given similar accuracies achieved using different methods in previous rs-fMRI ASD classification studies (Uddin et al., 2013;Nielsen, and Zielinski, 2013;Anderson et al., 2011) we expected that there would be little effect of classifier method or brain region set.
Second, to determine the upper bounds of diagnostic performance using machine learning classification, we determined whether classifi -cation algorithms based on rs-fMRI data perform comparably to
classi-fiers based on questionnaire data from the Social Responsiveness Scale (SRS) (Constantino, and Gruber, 2005). This questionnaire was expect-ed to be highly prexpect-edictive of ASD diagnoses as it is a measure of social functioning, the hallmark deficit in ASD. While SRS has been validated relative to“gold standard”interview and observation schedules, this measure is independent of the actual diagnosis criteria (Lord et al., 1994;Lord et al., 2000). The action of classifying participants as having a disorder characterized by social functioning deficits based on a mea-sure of social functioning may be somewhat circular in its logic; howev-er, the simplicity of the SRS and the ease of its administration make it an important benchmark of diagnostic utility for rs-fMRI based classifi ca-tion. In addition, such a behavioral classifier provides a more realistic ceiling of classifier performance that is tailored to the dataset in ques-tion. It is important to clarify that the SRS cannot be a biomarker as it is a clinical measure of social impairment designed to interrogate autis-tic symptoms. Performing classification on these measures simply gives an estimate of how well these individuals can be distinguished using a continuous measure of behavior that is independent of the diagnosis itself.
Finally, we investigated which connectivity features and brain net-works are most predictive of ASD and further, which connections track individual symptom expression. We identified a disperse set of connections throughout the brain that were highly predictive of an ASD diagnosis. Classification accuracy increased by including regions beyond those seen in meta-analyses of task-based fMRI studies. 2. Methods and materials
2.1. Participants 2.1.1. NIMH
Fifty-nine typically developing (TD) male participants (mean age ± standard deviation (SD) = 18.3 ± 3.05) and 59 high-functioning partic-ipants with an autism spectrum disorder (ASD, mean age ± SD = 17.66 ± 2.72) took part in the study, including 29 ASD and 28 TD partic-ipants previously described (Gotts et al., 2012). Participants with ASD were recruited from the Washington, DC, metropolitan area and met Di-agnostic and Statistical Manual-IV diDi-agnostic criteria as assessed by an experienced clinician. Scores on the SRS (Constantino, and Gruber, 2005), an informant-based rating scale used to assess social and com-munication traits quantitatively, were obtained from parents for all ASD participants and 45 TD participants. Participant groups did not dif-fer in terms of full-scale IQ or age (Table 1). Informed assent and consent were obtained from all participants and/or their parent/guardian when appropriate in accordance with the National Institutes of Health
Institutional Review Board approved protocol. See Appendix A.1 and Table 1for further details.
2.1.2. ABIDE
The ABIDE dataset is an open-access multi-site image repository comprising structural and rs-fMRI scans from ASD and TD individuals (Di Martino et al., 2014). Acquisition parameters and protocol informa-tion can be found athttp://fcon_1000.projects.nitrc.org/indi/abide/. Data from three of thefive sites with the most subjects that met the fol-lowing criteria were included in our analyses: males with a full-scale IQN80 and age within one standard deviation of the range of our in-house sample. Other sites were excluded due to excessive difficulties with anatomical FreeSurfer parcellation. The included sites were New York University (NYU), University of Utah School of Medicine (USM), and University of California Los Angeles 1 (UCLA_1). Participants were included if their scans met quality assurance standards (see Appendix A.2). These inclusion criteria and an additional step for matching ASD and TD prevalence resulted in a cohort of 178 individuals (89 TD; 89 ASD). Participant demographic and clinical data are provided inInline Supplementary Table S1.
Inline Supplementary Table S1 can be found online athttp://dx.doi. org/10.1016/j.nicl.2014.12.013.
2.2. fMRI acquisition
Functional MRI data were collected using a GE, Signa 3T whole-body MRI scanner at the NIH Clinical Center NMR Research Facility. For each participant, a high-resolution T1-weighted anatomical image (MPRAGE) was obtained (124 axial slices, 1.2 mm slice thickness,field of view = 24 cm, 224 × 224 acquisition matrix). Spontaneous brain activity was measured during functional MRI using a gradient-echo echo-planar series with whole-brain coverage while participants maintainedfixation on a central cross and were instructed to lie still and rest quietly (repetition time = 3500 ms, echo time = 27 ms,flip angle = 90°, 42 axial inter-leaved slices per volume, 3.0 mm slice thickness,field of view = 22 cm, 128 × 128 acquisition matrix, single-voxel volume = 1.7 × 1.7 × 3.0 mm). Each resting scan lasted 8 min, 10 s for a total of 140 consecutive whole-brain volumes. A GE 8-channel send–receive head coil was used for all scans, with a SENSE factor of 2 used to reduce gradient coil heating during the session.
2.3. fMRI preprocessing
fMRI data were preprocessed using AFNI software package (Cox, 1996) in accordance with pipelines recommended byJo et al. (2013) with one exception: we did not employ cardiac and respiratory denoising so that a common preprocessing pipeline could be used on ABIDE data that lacked physiological measures. See Appendix A.2 for further details. 2.4. Connectivity measures and feature matrices
Three sets of regions of interest (ROIs) were used to create three separate fMRI timecourse correlation matrices for subjects3processed EPI time series. These ROI sets included one set of 49 spherical regions (5 mm radius) derived from coordinates in Di Martino et al. (2009), one set of 264 spherical regions (5 mm radius) fromPower et al. (2011) and one set of 162 cortical and subcortical ROIs from each subject3s FreeSurfer Destrieux atlas anatomical segmentation. Timecourses were extracted and averaged within each region. Linear correlations were computed between the average timecourses of each region in a ROI set and Fisher transformed. For each ROI set, this process yielded aNs×Nffeature matrix,F, for use in classifi ca-tion, whereNs= number of subjects andNf= number of features (Fisher transformed correlation values).Fhas an associated label vector,L, containing the diagnoses of the participants (ASD or TD) coded as a binary variable.
Subjects3clinical and demographic data (age, IQ, and scores from SRS sub-scales for: social awareness, social cognition, social communication, social motivation, and autism mannerisms) were used to create an addi-tional feature matrix for the NIMH cohort. TD participants who did not have an SRS score were excluded from this classifier.
2.5. Classification of region × region correlation matrices
Classification algorithms were implemented using Scikit-learn (Pedregosa et al., 2011). Leave-one-out (LOO) cross-validation was per-formed on eachFusing the following classification algorithms: Random forest (RF), K-Nearest Neighbor (KNN), Linear Support Vector Machines (L-SVM), Gaussian kernel support vector machines (rbf-SVM), L1-regularized logistic regression (L1LR), L2-L1-regularized logistic regression (L2LR), Elastic-net-regularized logistic regression (ENLR), Gaussian Naïve Bayes (GNB), and Linear Discriminant Analysis (LDA). For each al-gorithm we report accuracy, sensitivity (proportion of ASD individuals correctly classified), specificity (proportion of TD individuals correctly classified), positive predictive value (PPV), and negative predictive value (NPV). Statistical significance was estimated using permutation tests. For the highest performing classifiers, cross-validation was repeated using stratified-3-fold and stratified-10-fold techniques. See Appendixes A.3 and A.4 for descriptions of cross-validation, hyperparameter tuning, and permutation testing.
3. Results
3.1. Comparison of classifier and feature set performance
In order to determine the best methods for classifying of ASD vs. TD participants using rs-fMRI, we performed LOO cross-validation on our in-house cohort using nine popular classification algorithms and fea-tures derived from three different ROI sets. High LOO cross-validation accuracy was achieved through several machine-learning algorithms across all three ROI sets (Table 2). However, two classification algo-rithms, L2LR (average accuracy 73.33%) and L-SVMs (average accuracy 73.89%), consistently performed the best. Additionally, the two larger ROI sets, the Power (264 regions) and Destrieux (162 regions) sets, yielded higher performing classifiers than the DiMartino (49 regions) ROI set.
LOO cross-validation has high variance in its estimates of a classifier3s true prediction error (Hastie et al., 2009), so we additionally performed stratified-10-fold and stratified-3-fold cross-validation for L2LR and L-SVM. Classifier performance remained stable (Table 1). All L2LR and L-SVM cross-validation accuracies were significant for each methodological variant (pb.001; chance accuracy 47.27–51.24%).
Behavioral features alone outperformed fMRI classifiers across all learning algorithms (peak accuracy 95.19%;Table 2). Once again,
classi-fication accuracy was highly significant (pb0.001; chance accuracy 50.50–51.84%).
It is possible that the lower accuracies seen with fMRI-based classifiers were due to insufficient data to train the classifiers (“underfitting”). To Table 1
Demographic characteristics of in-house cohort.
TD (N = 59) ASD (N = 59)
Mean SD Mean SD
Age 18.3 3.05 17.66 2.72
IQ 115.76 11.70 111.02 15.87
ADOS: soc + comm 11.69 4.16
SRS 19.82 11.54 91.75 30.20
Whole brain tSNR 324.59 53.66 314.37 36.94
Average head movement (per TR) 0.047 .0019 0.069 .042
Table 2
Cross-validation performance for the in-house cohort using the DiMartino, Power, and Destrieux ROI sets as well as a behavioral classifier.
Classifier type Accuracy Sensitivity Specificity PPV NPV LOO-cross-validation
DiMartino ROI set
RF 66.67 71.67 64.67 65.15 68.52 KNN 60.83 70.00 51.67 59.15 63.27 L-SVM 69.17 71.67 66.67 68.25 70.18 RBF-SVM 66.67 76.67 56.67 63.89 70.83 GNB 60.83 73.33 48.33 58.67 64.44 LDA 66.67 68.33 65.00 66.13 67.24 L1LR 61.67 58.33 65.00 62.50 60.94 L2LR 67.50 66.67 68.33 67.80 67.21 ENLR 72.50 70.00 75.00 73.68 71.43 Destrieux Atlas RF 66.67 70.00 63.33 65.63 67.86 KNN 68.33 65.00 71.67 69.64 67.19 L-SVM 74.58 69.49 79.66 77.36 72.31 RBF-SVM 76.67 70.00 83.33 80.77 73.53 GNB 60.00 68.33 51.67 58.57 62.00 LDA 74.17 71.67 76.67 75.44 73.02 L1LR 70.83 75.00 66.67 69.23 72.72 L2LR 76.67 75.00 78.33 77.59 75.81 ENLR 72.50 71.67 73.33 72.88 72.13
Power ROI set
RF 65.00 65.00 65.00 65.00 65.00 KNN 65.00 73.33 56.67 62.86 68.00 L-SVM 75.83 75.00 76.67 76.27 75.41 RBF-SVM 70.83 73.33 68.33 69.84 71.93 GNB 60.83 70.00 51.67 59.15 63.27 LDA 69.17 73.33 65.00 67.69 70.91 L1LR 65.83 70.00 61.67 64.62 67.27 L2LR 75.83 75.00 76.67 76.27 75.41 ENLR 72.50 75.00 70.00 71.43 73.68 Behavior RF 91.35 91.53 91.11 93.10 89.13 KNN 93.26 91.53 95.56 96.43 89.58 L-SVM 90.38 83.05 100.00 100.00 81.82 RBF-SVM 91.35 84.75 100.00 100.00 83.33 GNB 95.19 93.22 97.78 98.21 91.67 LDA 88.46 81.36 97.78 97.96 80.00 L1LR 93.27 93.22 93.33 94.83 91.30 L2LR 94.23 93.22 95.56 96.49 91.49 ENLR 95.19 94.92 95.56 96.55 93.48
Stratified-10-fold cross-validation DiMartino ROI set
L-SVM 69.39 66.33 73.00 73.57 68.24
L2LR 67.65 67.67 67.33 66.95 69.52
Destrieux atlas
L-SVM 74.55 71.67 77.00 81.51 75.12
L2LR 79.09 73.33 85.00 83.33 77.38
Power ROI set
L-SVM 75.30 73.00 78.00 79.55 76.26
L2LR 73.56 72.67 74.00 77.67 76.07
Behavior
L-SVM 91.36 84.67 100.00 100.00 84.81
L2LR 94.27 93.33 95.50 96.90 92.33
Stratified-3-fold cross-validation DiMartino ROI set
L-SVM 72.05 79.56 64.56 69.19 75.98
L2LR 65.34 67.72 62.54 66.18 65.94
Destrieux atlas
L-SVM 72.93 71.40 74.65 73.70 73.00
L2LR 73.68 69.47 77.98 75.69 72.85
Power ROI set
L-SVM 76.26 76.14 76.32 77.01 77.34
L2LR 74.57 78.07 71.23 74.17 77.25
Behavior
L-SVM 94.26 93.33 95.56 96.75 92.98
L2LR 94.23 94.91 93.33 94.91 93.33
RF = Random Forests, KNN = K-Nearest Neighbor, L-SVM = Linear Support Vector Ma-chine, RBF-SVM = Gaussian Kernel Support Vector MaMa-chine, GNB = Gaussian Naïve Bayes, LDA = Linear Discriminant Analysis, L1LR = L1 Logistic Regression, L2LR=L2 Logis-tic Regression, ENLR = ElasLogis-tic-net LogisLogis-tic Regression.
address this problem, we repeated the analysis with a combined data pool of our in-house cohort and a matched cohort from the ABIDE dataset (combinedNs= 296). Cross-validation accuracy did not improve (Inline Supplementary Table S2). Cross-site differences, in either true underlying correlations or in nuisance variables, caused problems for these classifiers (see Inline Supplementary Fig. S1). Removing linear effects of site identity from correlation matrices or correcting for global level of correlation prior to cross-validation did not improve performance. There were no differ-ences in temporal signal-to-noise ratio (tSNR) between ASD and TD scans in either the NIMH or the ABIDE cohorts. Cross-validation perfor-mance on the ABIDE dataset was markedly lower than on the combined datasets or in-house dataset (Inline Supplementary Table S3). This sug-gests that sample size may not be the sole factor limiting accuracy; across all methods rs-fMRI-based classifiers plateaued around ~75% accuracy.
Inline Supplementary Tables S2 and S3 and Fig. S1 can be found on-line athttp://dx.doi.org/10.1016/j.nicl.2014.12.013.
Another possible explanation for the plateaued performance of the rs-fMRI classifiers is the high number of uninformative features includ-ed in the model. However, neither dimensionality rinclud-eduction of the fea-ture matrices (principal components analysis) nor univariate feafea-ture selection (t-testfilters) markedly improved cross-validation accuracy (Inline Supplementary Table S4 & S5).
Inline Supplementary Tables S4 and S5 can be found online athttp:// dx.doi.org/10.1016/j.nicl.2014.12.013
3.2. Selection of most informative features
In order to determine which rs-fMRI features were most predictive of ASD or TD classification, we performed Recursive Feature Elimination (RFE) with stratified-10-fold cross-validation for the top performing classifiers (see Appendix A.5 for further details). L2LR and L-SVM per-formed comparably in cross-validation (Table 2, Inline Supplementary Tables S2 & S3). Feature weights for these two algorithms were also highly correlated (rN .97, Appendix B and Inline Supplementary Fig. S2) allowing us to choose one method for feature selection. As the variance in feature weights across cross-validation folds was smaller for L-SVM (4.68 × 10⁻⁵) than for L2LR (1.47 × 10⁻²), we only show fea-ture weights associated with L-SVM (Fig. 1). The Power ROI set features (57 features, 0.164% ofNf; 85.10% accuracy) and Destrieux ROI set fea-tures (42 feafea-tures, 0.322% ofNf; 87.71% accuracy) showed the highest discriminability. We did not use RFE to boost classification accuracy, thus accuracies in this section simply measure the optimal feature sub-set’s ability to discriminate the two classes; they do not reflect the over-all cross-validation accuracy. This measure is more akin to classifier training accuracy and does not directly estimate how predictive these features would be in a novel dataset. For the behavioral classifiers, we found that SRS social motivation, social cognition, and autism manner-isms sub-scales scores were the most predictive across all learning algo-rithms that weight features (Inline Supplementary Table S6). In
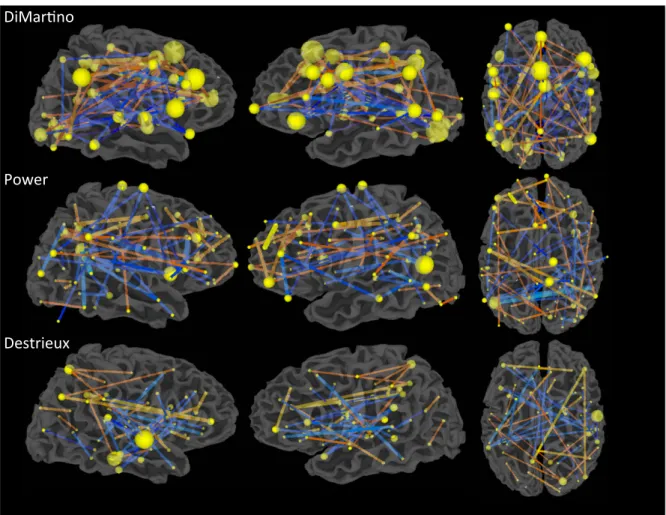
Fig. 1.Optimal feature subsets chosen via recursive feature elimination (RFE) for each ROI set by L-SVM. The feature weights shown are the average weights from LOO cross-validation. Spheres are centered at the ROI3s center of mass, and sphere radius represents the number of features coincident on that region. Comparing sphere radii across ROI sets is not advised due to the difference in the number of regions, in the number of features chosen, and in the cross-validation accuracy stated in the text. Edge thickness indicates absolute value of feature weight in the L-SVM, and color indicates the sign of the feature.‘Hotter’edges indicate stronger connectivity in ASD individuals while‘cooler’edges represent indicate stronger connectivity in TD individuals.
addition, demographic features (age and IQ) were not predictive of di-agnosis. In the next section, we characterize these highly informative re-gions and features on the level of interacting large-scale networks.
Inline Supplementary Table S6 and Fig. S2 can be found online at http://dx.doi.org/10.1016/j.nicl.2014.12.013.
3.3. Functional networks associated with top features
In the DiMartino and Power ROI sets but not the Destrieux ROI set, each ROI is associated with a functional network or task label. DiMartino et. al. labeled ROIs as being derived from either social or non-social tasks and by direction of group differences, yielding 4 possible labels for each region. Power et al labeled ROIs as belonging to 1 of 13 functional net-works. In order to test whether functional networks, or connections be-tween networks, were overrepresented in the optimal subset of features, we ran aχ2test with permutations testing (see Appendix A.6 for further details). No regions or connections across regions were sig-nificantly overrepresented in the DiMartino feature set. For the Power ROI set, regions designated as the‘default-mode network’and the‘ fron-tal-parietal control network’were more prevalent in the optimal subset of features (pb.01) (Inline Supplementary Fig. S3). SeeTable 3for a list of the most diagnostic ROIs from the Power ROI set.
Inline Supplementary Fig. S3 can be found online athttp://dx.doi. org/10.1016/j.nicl.2014.12.013.
3.4. Classifier Results Correlate with Behavioral Ratings
In thisfinal section, we test whether classifier techniques are sensi-tive to symptom expression beyond a binary ASD vs. TD decision by assessing whether feature weights correlated with participants’SRS total sum scores.
The probability estimate of a scan coming from an ASD or TD individ-ual from the fMRI connectivity data alone derived from LOO cross-vali-dation, P(ASD|fMRI data), was highly correlated subjects’SRS sum scores (Table 4). L-SVMs trained and tested on the Power ROI set achieved the highest correlation with the SRS sum score (r = .51, p = 2.79 × 10- 8). Many top predictive features from the Power and Destrieux ROI sets also strongly correlated with SRS scores (Fig. 2). Cor-relation significance values were corrected for multiple comparisons (FDR25 b .05). The Power ROI set yielded a higher proportion of Table 3
Ranking of regions from the Power ROI set based on the sum of the absolute value of the feature weights coincident on that region chosen by RFE.
Region rank Talairach coordinates Region label (103 )∑|RFE feature weights| Sign of feature weights to regiona x y z 1 −46 −60 16 L posterior STS/TPJ 31.61 − 2 36 10 1 R Insula 18.77 − 3 −42 44 1 L IFG 17.23 + 4 31 31 25 R MFG 15.58 + 5 10 −20 67 R SMA 13.97 − 6 13 −4 64 R SMA 13.71 − 7 −44 0 42 L precentral gyrus 13.35 + 8 −51 −61 2 L posterior MTG 11.94 − 9 −42 36 21 L MFG 11.92 − 10 5 21 35 R ACC 11.85 + 11 33 −53 38 R IPS 11.44 ± 12 54 −45 32 R supramarginal gyrus 11.44 + 13 −57 −29 −5 L STS 11.33 − 14 36 21 4 R anterior insula 11.03 − 15 27 −35 −13 R parahippocampal gyrus 10.91 − 16 37 −82 8 R MOG 10.79 − 17 −11 −55 12 L PCC 10.52 ± 18 −46 31 −9 L IFG 10.32 − 19 −3 23 42 L dorsomedial prefrontal gyrus 10.32 + 20 −3 40 17 L ACC 10.21 + 21 6 65 0 R ventromedial prefrontal cortex 9.34 + 22 −52 −49 37 L supramarginal gyrus 9.07 − 23 11 −66 35 R precuneus 8.96 + 24 43 −71 22 R MOG 8.78 ± 25 46 17 −24 R temporal pole 8.13 − 26 −28 49 22 L SFG 8.05 + 27 −20 42 38 L SFG 8.05 + 28 55 −45 8 R posterior STS 7.42 − 29 57 −51 −14 R posterior ITG 6.80 − 30 44 −54 41 R IPL 6.62 + 31 6 61 23 R SFG 6.36 +
32 22 −65 41 R superior parietal lobe 6.28 −
33 22 36 38 R MFG 6.17 + 34 −35 17 48 L SFG 6.10 + 35 51 −1 −14 R MTG 6.04 − 36 −55 −49 7 L MTG 5.91 − 37 65 −9 23 R precentral gyrus 5.83 − 38 27 −57 −10 R fusiform gyrus 5.78 − 39 −20 61 21 L MFG 5.75 + 40 38 41 16 R MFG 5.64 + 41 −15 −69 −10 L lingual gyrus 5.60 + 42 −33 −76 −15 L fusiform gyrus 5.60 +
43 −17 −60 56 L superior parietal lobe 5.56 +
44 46 −57 1 R posterior MTG 5.45 −
45 −8 45 23 L medial frontal gyrus 5.34 +
46 49 8 0 R Insula 5.30 − 47 48 21 10 R IFG 5.30 − 48 46 −45 −17 R fusiform gyrus 5.28 − 49 37 −65 34 R angular gyrus 5.21 + 50 52 32 3 R IFG 5.21 + 51 53 −43 18 R TPJ 5.18 − 52 24 44 −10 R lateral orbitofrontal cortex 5.17 + 53 48 23 26 R MFG 5.15 − 54 −42 −55 39 L IPL 5.07 + 55 −16 −76 28 L cuneus 5.07 + 56 26 47 27 R SFG 5.03 − 57 −38 −33 14 L posterior insula 4.89 − 58 51 8 −25 R temporal lobe 4.89 − 59 29 −20 64 R precentral gyrus 4.78 − 60 24 −85 18 R MOG 4.77 − 61 −2 −35 27 L PCC 4.73 +
62 −41 4 31 L inferior frontal junction 4.73 + 63 8 47 −10 R ventromedial prefrontal gyrus 4.71 − 64 −39 −75 37 L angular gyrus 4.70 + 65 −53 −24 38 L postcentral gyrus 4.67 + 66 64 −22 −17 R ITG 4.67 + 67 −47 −73 −12 L fusiform 4.65 + Table 3(continued) Region rank Talairach coordinates
Region label (103)∑|RFE feature weights| Sign of feature weights to regiona x y z
68 −40 −85 −9 L inferior occipital gyrus 4.65 +
69 −59 −25 12 L STG 4.60 +
70 29 −76 19 R MOG 4.50 −
71 −42 23 29 L MFG 4.48 +
72 53 −29 30 R IPL 4.47 −
73 −10 51 39 L SFG 4.47 −
74 17 −76 −32 R cerebellum lobule VIIa 4.41 −
75 −50 −34 22 L IPL 4.36 + 76 34 37 −8 R lateral orbitofrontal cortex 4.36 − 77 17 −88 −16 R occipital pole 4.22 + 78 22 −55 −22 R cerebellum lobule VI 4.22 + 79 6 −71 19 R cuneus 3.81 − 80 8 −70 7 R cuneus 3.81 − 81 −3 −1 49 L SMA 3.79 −
IFG = inferior frontal gyrus, MFG = middle frontal gyrus, SFG = superior frontal gyrus, ITG = inferior temporal gyrus, MTG = middle temporal gyrus, STG = superior temporal gyrus, SMA = supplementary motor area, ACC = anterior cingulate cortex, PCC = poste-rior cingulate cortex, IPS = intraparietal sulcus, IPL = infeposte-rior parietal lobule, MOG = mid-dle occipital gyrus.
aWhile the majority of regions were associated with feature weights of the same sign (indicated by + or−), some regions were associated with both positive and negative fea-ture weights (indicated by ±).
predictive features that were relevant to subject behavior (56.14% of most predictive features) than did the Destrieux ROI set (28.57% of most predictive features).
Inline Supplementary Fig. S3 can be found online athttp://dx.doi. org/10.1016/j.nicl.2014.12.013.
3.4. Classifier results correlate with behavioral ratings
In thisfinal section, we test whether classifier techniques are sensi-tive to symptom expression beyond a binary ASD vs. TD decision by assessing whether feature weights correlated with participants3SRS total sum scores.
The probability estimate of a scan coming from an ASD or TD individ-ual from the fMRI connectivity data alone derived from LOO cross-validation, P(ASD|fMRI data), was highly correlated with the subjects3 SRS sum scores (Table 4). L-SVMs trained and tested on the Power ROI set achieved the highest correlation with the SRS sum score (r = .51, p = 2.79 × 10⁻⁸). Many top predictive features from the Power and Destrieux ROI sets also strongly correlated with SRS scores (Fig. 2). Cor-relation significance values were corrected for multiple comparisons (FDR (Benjamini, and Hochberg, 1995)b.05). The Power ROI set yielded a higher proportion of predictive features that were relevant to subject
behavior (56.14% of most predictive features) than did the Destrieux ROI set (28.57% of most predictive features).
4. Discussion
In this study, we addressed the impact of classifier algorithm and ROI set on classification accuracy of rs-fMRI applied to ASD. Contrary to our prediction that there would be little effect of ROI or classifier choice on classification performance, these factors substantially impacted classifi -cation accuracy. L2LR and L-SVMs were the most successful in classify-ing ASD individuals from TD individuals. Further, restrictclassify-ing analysis to loci of group differences in task-based studies of ASD populations greatly impaired accuracy.
We also found that accuracy achieved using simple behavior metrics, the SRS, far exceeded accuracy achieved with rs-fMRI. Nonetheless, classification techniques applied to rs-fMRI data still had demonstrable utility. These data-driven methods identified aberrant connections in ASD participants, revealing connections within specific networks that were predictive of an ASD diagnosis and correlated with symptom expression.
4.1. Implications for rs-fMRI as a diagnostic ASD biomarker
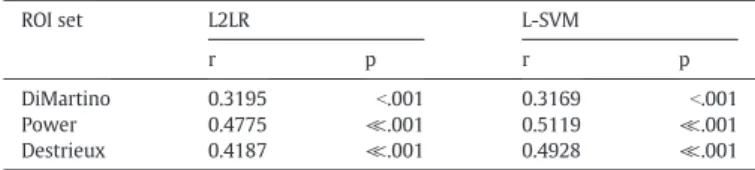
Despite promising results using rs-fMRI data to classify ASD and TD individuals3scans, we exercise substantial caution in heralding this technique as a potential ASD biomarker at this time for several reasons. Thefirst reason is that rs-fMRI classification lacks the sensitivity and specificity of simple behavioral metrics (Table 1). We do not conclude that the SRS is a better“biomarker”than rs-fMRI metrics because SRS is in fact a behavioral measure of social impairment validated against “gold-standard”ASD clinical measures. By comparing rs-fMRI and be-havioral classifiers, we show that a set of highly informative features in-dependent of the diagnosis criteria can distinguish the individuals with high accuracy using the same statistical techniques. This procedure Table 4
Spearman3s correlation of classifier3s probability of labeling a scan as ASD (P(ASD|fMRI data)) and participants3SRS scores.
ROI set L2LR L-SVM
r p r p
DiMartino 0.3195 b.001 0.3169 b.001
Power 0.4775 ≪.001 0.5119 ≪.001
Destrieux 0.4187 ≪.001 0.4928 ≪.001
Fig. 2.The most predictive features from the Power and Destrieux ROI sets correlate with subjects3SRS sum scores. Spheres are centered at each ROI3s center of mass, and sphere radius represents the number of significantly correlated features coincident on that region. Edge thickness indicates absolute value of the r-statistic. Edge color indicates the sign and magnitude of the r-statistic. Cooler colors indicate a negative correlation while warmer colors indicate a positive correlation. All correlations are significant at FDRb.05.
provides a classification benchmark more realistic than 100% accuracy. Thus, there is a gap in classification performance between the brain and behavior for which we must account. This gap remains when attempting to reduce the rs-fMRI classifiers to only the most relevant features (Fig. 1and Inline Supplementary Table S5). The observed dis-crepancy between performance of brain-based and behavior-based classifiers does not appear to be specific to our cohort or methods. Our best-performing brain-based classifier (peak accuracy = 77%) per-formed on par with the two single-site rs-fMRI classifiers in the litera-ture (peak accuracy (Anderson et al., 2011) = 78%; peak accuracy (Castelli et al., 2002) = 79%). This advantage of behavioral metrics may be due to many methodological and measurement factors includ-ing thermal scanner noise, stubborn head motion artifacts, non-uniform signal quality across the brain, and classifier overfitting. More intriguingly, however, the behavioral advantage may reflect neurobio-logical heterogeneity of ASD. The wide-range of symptom expression profiles seen in an ASD diagnosis may be due to neurobiological changes that are as variable or even more variable than the disorder itself, thus yielding an extremely difficult classification problem.
The second reason for our qualified excitement is the decline in clas-sifier accuracy when algorithms are trained on data from multiple sites. Though our multi-site classifier (peak accuracy = 75%) substantially outperformed a previous multi-site classifier (peak accuracy (Belmonte et al., 2004) = 60%) (Inline Supplementary Tables S2 and S3), large uni-variate differences in connectivity strength exist between sites (Inline Supplementary Fig. S1). Further work is needed to isolate causes of site effects (e.g., hardware, acquisition parameter, or cohort effects). The third reason is that rs-fMRI classification studies with autism fail to perform on the same level as ASD classification studies using other modalities (i.e. behavior (Williams et al., 2013) structural and diffu-sion MRI, (Ecker et al., 2010;Uddin et al., 2011) and molecular and genet-ic screens (Hu, and Lai, 2013)). Finally, prior studies and ours have focused on individuals who were older than the age of typical diagnosis (~2–6 years (Kleinman et al., 2008)) or the age at which reliable behavior-al symptoms are detectable (~1–3 years (Bolton et al., 2012)). Presently, it is unclear whether existing classifiers are merely detecting circuit-level consequences of living with ASD for many years. The possible age-dependence of rs-fMRI based classifiers may hinder the generalizability of a given classifier across age and underscores the need to evaluate de-velopmental disorders in a dede-velopmental context (Dosenbach et al., 2010;Karmiloff-Smith, 2013). An ideal biomarker would be measurable prior to behavioral symptom onset (Yerys, and Pennington, 2011) and able to distinguish developmental disorders of different etiologies.
4.2. Functional networks disrupted in ASD individuals
Irrespective of the utility of rs-fMRI as an ASD diagnosis biomarker, classifier methods remain valuable tools for investigating brain circuitry in ASD. We found that a disperse set of connections was highly predic-tive of an ASD diagnosis. Including regions beyond those seen in meta-analyses of task-based fMRI studies increased classification accuracy (Table 1). This accuracy increase with increasing coverage is consistent with the idea that ASD involves disruptions of interacting large-scale brain networks (Gotts et al., 2012).
While both anatomically-defined (Destrieux) and functionally-defined (Power) whole-brain ROI sets performed similarly with regard to classification, the latter resulted in a higher proportion of features that correlated strongly with behavioral measures (Table 2&Fig. 2). Functionally defined brain regions may be essential for characterizing functional connectivity differences in ASD individuals. Network labels assigned to regions from the Power ROI set enabled us to investigate ca-nonical functional networks that showed atypical connectivity in ASD individuals. Fortuitously, the two best performing algorithms (L2LR and L-SVM) allow for the ready interpretation of feature weights, some-thing that was not previously straightforward due to either feature
selection methods (Nielsen, and Zielinski, 2013;Anderson et al., 2011) or choice of classifier algorithm. (Uddin et al., 2013)
Connections involving the putative‘default mode’and‘ frontal-pari-etal task control’networks were most predictive of ASD. These results are consistent with group-level functional connectivity analyses of high-functioning ASD populations documenting reduced correlation in ASD among regions of these networks (Just et al., 2012;Schipul et al., 2012;Kana et al., 2006) many of which are known to be involved in multiple aspects of social functioning (Frith, and Frith, 2007;Adolphs, 2009). Specifically, regions identified in the present study as most pre-dictive of ASD included the insula, ventromedial prefrontal cortex, ante-rior, middle, and posterior regions of cingulate cortex, supplementary motor cortex, anterior temporal lobes, posterior aspects of the fusiform gyrus, posterior superior temporal sulcus, temporal parietal junction, intraparietal sulcus, and inferior and middle frontal gyri, bilaterally. These results also converge with other imaging and histological investi-gations of ASD. Structural MRI studies found cortical thickness and vol-ume differences between ASD and TD individuals in several posterior temporal and parietal regions of these two networks (Wallace et al., 2010). A recent post-mortem study also found laminar disorganization in the posterior superior temporal cortex of children and adolescents with ASD (Stoner et al., 2014). Finally, atypical activity during theory of mind and mentalizing tasks has been observed in many of these re-gions (Castelli et al., 2002;Lombardo et al., 2010). Thus, the general pat-tern offindings is consistent with the hypothesis that ASD involves a fractionation of circuits that underlie social processing from other func-tional networks (Gotts et al., 2012).
4.3. Future directions
The aforementioned limitations of rs-fMRI as a diagnostic biomarker of ASD should not preclude further exploration of this imaging tech-nique and machine-learning methods. This approach may be well suited for predicting the trajectory of the disorder, identifying clinical sub-groups on the basis of a functional connectivity phenotype, or identify-ing individuals who may be more responsive to treatment. Autism is a heterogeneous developmental disorder with a range of symptom ex-pression profiles, and rs-fMRI may have a role in explicating the root of this heterogeneity. Autism studies using other modalities have al-ready had success using techniques that may accomplish this task (Ingalhalikar et al. 2012;Hu, and Lai, 2013). We anticipate that basic and clinical advances will result from studying functional brain net-works with multivariate techniques.
Acknowledgments
Thanks go to Steve Gotts, PhD for helpful discussion regarding methods and statistics. The authors declare no competing interests. This work was supported by a NARSAD Young Investigator Grant from the Brain & Behavior Research Foundation (KAB) and by the Intramural Research Program at NIMH (AM). Ethics approval for this study was granted by the NIH Combined Neuroscience Institutional Review Board under protocol number 10-M-0027. The clinical trial number (clinicaltrials.gov) for this protocol is NCT01031407.
Appendix A and B. Supplementary data
Supplementary data associated with this article can be found in the online version athttp://dx.doi.org/10.1016/j.nicl.2014.12.013. References
Adolphs, R., 2009. The social brain: neural basis of social knowledge. Annu. Rev. Psychol. 60, 693–716.http://dx.doi.org/10.1146/annurev.psych.60.110707.16351418771388. Anderson, J.S., Nielsen, J.A., Froehlich, A.L., et al., 2011. Functional connectivity magnetic
resonance imaging classification of autism. Brain 134 (12), 3742–3754.http://dx. doi.org/10.1093/brain/awr26322006979.
Belmonte, M.K., Allen, G., Beckel-Mitchener, A., Boulanger, L.M., Carper, R.A., Webb, S.J., 2004. Autism and abnormal development of brain connectivity. J. Neurosci. 24 (42), 9228–9231.http://dx.doi.org/10.1523/JNEUROSCI.3340-04.200415496656. Benjamini, Y., Hochberg, Y., 1995. Controlling the false discovery rate: a practical and
powerful approach to multiple testing. J. R. Stat. Soc. B Stat. Methodol. 57, 289–300. http://dx.doi.org/10.2307/2346101.
Bolton, P.F., Golding, J., Emond, A., Steer, C.D., 2012. Autism spectrum disorder and autistic traits in the Avon Longitudinal Study of Parents and Children: precursors and early signs. J. Am. Acad. Child Adolesc. Psychiatry 51 (3), 249–260.http://dx.doi.org/10. 1016/j.jaac.2011.12.00922365461.
Castelli, F., Frith, C., Happe, F., Frith, U., 2002. Autism, Asperger syndrome and brain mech-anisms for the attribution of mental states to animated shapes. Brain 125 (8), 1839–1849.http://dx.doi.org/10.1093/brain/awf189.
Constantino, J., Gruber, C., 2005.Social Responsiveness Scale (SRS): Manual. West Psychol Serv, Los Angeles, CA.
Cox, R.W., 1996. AFNI: software for analysis and visualization of functional magnetic res-onance neuroimages. Comput. Biomed. Res. 29 (3), 162–173.http://dx.doi.org/10. 1006/cbmr.1996.00148812068.
Di Martino, A., Ross, K., Uddin, L.Q., Sklar, A.B., Castellanos, F.X., Milham, M.P., 2009. Functional brain correlates of social and nonsocial processes in autism spectrum disorders: an activation likelihood estimation meta-analysis. Biol. Psychiatry 65 (1), 63–74.http://dx.doi.org/10.1016/j.biopsych.2008.09.02218996505.
Di Martino, A., Yan, C.-G., Li, Q., et al., 2014. The autism brain imaging data exchange: to-wards a large-scale evaluation of the intrinsic brain architecture in autism. Mol. Psy-chiatry 19 (6), 659–667.http://dx.doi.org/10.1038/mp.2013.7823774715. Dosenbach, N.U., Nardos, B., Cohen, A.L., et al., 2010. Prediction of individual brain
matu-rity using fMRI. Science 329 (5997), 1358–1361.http://dx.doi.org/10.1126/science. 119414420829489.
Ecker, C., Rocha-Rego, V., Johnston, P., et al., 2010. Investigating the predictive value of whole-brain structural MR scans in autism: a pattern classification approach. Neuroimage 49 (1), 44–56.http://dx.doi.org/10.1016/j.neuroimage.2009.08.024. Frith, C.D., Frith, U., 2007. Social cognition in humans. Curr. Biol. 17 (16), R724–R732.
http://dx.doi.org/10.1016/j.cub.2007.05.06817714666.
Gotts, S.J., Saad, Z.S., Jo, H.J., Wallace, G.L., Cox, R.W., Martin, A., 2013. The perils of global sig-nal regression for group comparisons: a case study of autism spectrum disorders. Front. Hum. Neurosci. 7, 356.http://dx.doi.org/10.3389/fnhum.2013.0035623874279. Gotts, S.J., Simmons, W.K., Milbury, L.A., Wallace, G.L., Cox, R.W., Martin, A., 2012.
Frac-tionation of social brain circuits in autism spectrum disorders. Brain 135 (9), 2711–2725.http://dx.doi.org/10.1093/brain/aws16022791801.
Hastie, T., Tibshirani, R., Friedman, J., 2009. The Elements of Statistical Learning: Data Min-ing, Inference and Prediction 763.http://dx.doi.org/10.1007/978-0-387-84858-7. Hu, V.W., Lai, Y., 2013. Developing a predictive gene classifier for autism spectrum
disorders based upon differential gene expression profiles of phenotypic sub-groups. N. Am. J. Med. Sci. (Boston) 6 (3).http://dx.doi.org/10.7156/najms. 2013.060310724363828.
Ingalhalikar, M., Smith, A.R., Bloy, L., Gur, R., Roberts, T.P., Verma, R., 2012. Identifying sub-populations via unsupervised cluster analysis on multi-edge similarity graphs. Med Image Comput Comput Assist Interv 15, 254–26123286056.
Jo, H.J., Gotts, S.J., Reynolds, R.C., et al., 2013. Effective preprocessing procedures virtually eliminate distance-dependent motion artifacts in resting state FMRI. J. Appl. Math. 2013.http://dx.doi.org/10.1155/2013/93515424415902.
Just, M.A., Keller, T.A., Malave, V.L., Kana, R.K., Varma, S., 2012. Autism as a neural systems disorder: a theory of frontal-posterior underconnectivity. Neurosci. Biobehav. Rev. 36 (4), 1292–1313.http://dx.doi.org/10.1016/j.neubiorev.2012.02.00722353426. Kana, R.K., Keller, T.A., Cherkassky, V.L., Minshew, N.J., Just, M.A., 2006. Sentence
compre-hension in autism: thinking in pictures with decreased functional connectivity. Brain 129 (9), 2484–2493.http://dx.doi.org/10.1093/brain/awl16416835247.
Karmiloff-Smith, A., 2013. Challenging the use of adult neuropsychological models for explaining neurodevelopmental disorders: developed versus developing brainsQ J
Exp Psychol (Hove) 66 (1), 1–14. http://dx.doi.org/10.1080/17470218.2012. 74442423173948.
Kleinman, J.M., Ventola, P.E., Pandey, J., et al., 2008. Diagnostic stability in very young chil-dren with autism spectrum disorders. J. Autism Dev. Disord. 38 (4), 606–615.http:// dx.doi.org/10.1007/s10803-007-0427-817924183.
Lange, N., Dubray, M.B., Lee, J.E., et al., 2010. Atypical diffusion tensor hemispheric asym-metry in autism. Autism Res. 3 (6), 350–358.http://dx.doi.org/10.1002/aur.162. Lombardo, M.V., Chakrabarti, B., Bullmore, E.T., et al., 2010. Atypical neural
self-representation in autism. Brain 133 (2), 611–624.http://dx.doi.org/10.1093/brain/ awp30620008375.
Lord, C., Risi, S., Lambrecht, L., et al., 2000. The autism diagnostic observation schedule-generic: a standard measure of social and communication deficits associated with the spectrum of autism. J. Autism Dev. Disord. 30 (3), 205–223.http://dx.doi.org/ 10.1023/A:1005592401947.
Lord, C., Rutter, M., Le Couteur, A., 1994. Autism diagnostic interview-revised: a revised version of a diagnostic interview for caregivers of individuals with possible pervasive developmental disorders. J. Autism Dev. Disord. 24 (5), 659–685.http://dx.doi.org/ 10.1007/BF021721457814313.
Nielsen, J.A., Zielinski, B.A., et al., 2013. Multisite functional connectivity MRI classification of autism: ABIDE results. Front. Hum. Neurosci. 7 (September), 599.http://dx.doi.org/ 10.3389/fnhum.2013.0059924093016.
Pedregosa, F., Weiss, R., Brucher, M., 2011.Scikit-Learn.: Machine Learning in Python 12, 2825–2830.
Power, J.D., Cohen, A.L., Nelson, S.M., et al., 2011. Functional network organization of the human brain. Neuron 72 (4), 665–678.http://dx.doi.org/10.1016/j.neuron.2011.09. 00622099467.
Power, J.D., Mitra, A., Laumann, T.O., Snyder, A.Z., Schlaggar, B.L., Petersen, S.E., 2014. Methods to detect, characterize, and remove motion artifact in resting state fMRI. Neuroimage 84, 320–341.http://dx.doi.org/10.1016/j.neuroimage.2013. 08.04823994314.
Roberts, T.P., Cannon, K.M., Tavabi, K., et al., 2011. Auditory magnetic mismatchfield la-tency: a biomarker for language impairment in autism. Biol. Psychiatry 70 (3), 263–269.http://dx.doi.org/10.1016/j.biopsych.2011.01.01521392733.
Sato, J.R., Hoexter, M.Q., Oliveira, P.P.dM., Brammer, M.J., Murphy, D., Ecker, C., 2013. Inter-regional cortical thickness correlations are associated with autistic symptoms: a machine-learning approach. J. Psychiatr. Res. 47 (4), 453–459.http://dx.doi.org/10. 1016/j.jpsychires.2012.11.017.
Schipul, S.E., Williams, D.L., Keller, T.A., Minshew, N.J., Just, M.A., 2012. Distinctive neural processes during learning in autism. Cereb. Cortex 22 (4), 937–950.http://dx.doi.org/ 10.1093/cercor/bhr16221725037.
Stoner, R., Chow, M.L., Boyle, M.P., et al., 2014. Patches of disorganization in the neocortex of children with autism. N. Engl. J. Med. 370 (13), 1209–1219.http://dx.doi.org/10. 1056/NEJMoa130749124670167.
Uddin, L.Q., Menon, V., Young, C.B., et al., 2011. Multivariate searchlight classification of structural magnetic resonance imaging in children and adolescents with autism. Biol. Psychiatry 70 (9), 833–841.http://dx.doi.org/10.1016/j.biopsych.2011.07. 01421890111.
Uddin, L.Q., Supekar, K., Lynch, C.J., et al., 2013. Salience network-based classification and prediction of symptom severity in children with autism. JAMA Psychiatry 70 (8), 869–879.http://dx.doi.org/10.1001/jamapsychiatry.2013.10423803651.
Wallace, G.L., Dankner, N., Kenworthy, L., Giedd, J.N., Martin, A., 2010. Age-related tempo-ral and parietal cortical thinning in autism spectrum disorders. Brain 133 (12), 3745–3754.http://dx.doi.org/10.1093/brain/awq27920926367.
Williams, K., Perkins, D., Wheeler, D., Hayen, A., Bayl, V., 2013. Can questions about social interaction correctly identify preschool aged children with autism? J. Paediatr. Child. Health 49 (2), E167–E174.http://dx.doi.org/10.1111/jpc.1209223350819. Yerys, B.E., Pennington, B.F., 2011. How do we establish a biological marker for a
behav-iorally defined disorder? Autism as a test case. Autism Res. 4 (4), 239–241.http:// dx.doi.org/10.1002/aur.20421710504.