FORUM ON TAX ADMINISTRATION
Information note
Working smarter in revenue administration—
Using demand management strategies to meet
service delivery goals
TABLE OF CONTENTS
ABOUT THIS DOCUMENT ... 1
SUMMARY ... 2
I. INTRODUCTION ... 3
II. DELIVERING SERVICES TO TAXPAYERS—MANAGING MULTIPLE
CHANNELS ... 5
Channel strategy development and management ... 5
III. EXISTING REVENUE BODY STRATEGIES AND APPROACHES FOR
MANAGING TAXPAYER SERVICE DEMAND ... 9
Service delivery models ... 9
Understanding service demand ... 13
Methodologies and technologies by channel ... 14
Effecting change ... 24
Strategies to manage service demand ... 27
IV. LEARNINGS FROM THE PRIVATE SECTOR ... 40
V. IDEAS/PROPOSALS FOR GOING FORWARD ... 43
Boxes
Box 1. Understanding the terminology—‗topic/driver‘ versus ‗root cause‘ ... 13
Box 2. What is contact/speech analytics? ... 18
Box 3. UK example of demand management process and governance structure ... 27
Box 4. ‗Reducing demand‘ case studies ... 31
Box 5. ‗Shifting demand‘ case study—Canada‘s In-person Service Transition ... 34
Box 6. ‗Managing Demand‘ case study (call in channel)—Australia‘s use of IVR ... 37
Tables
Table 1. Service channels by country ... 9Table 2. Service contact volumes by channel type and country ... 10
Table 3. Comparative view of demand management volumes (2010) ...11
Table 4. Measurement and use of in-person demand information ... 14
Table 5. Measurement and use of inbound call demand information ... 17
Table 6. Methodologies/technologies to identify drivers and root causes ... 18
Table 7. Pros and cons of call demand methodologies/technologies ... 20
Table 8. Measurement and use of paper inquiry demand information ... 21
Table 9. Measurement and use of e-mail demand information ... 23
Table 10. Strategies for reducing demand ... 32
Table 11. Examples of strategies used to shift demand ... 34
Table 12. Initiatives to reduce avoidable or repeat call demand ... 36
Table 13. Examples of managing demand in-channel ... 37
Table 14. Strategies to address peak period demand ... 39
Diagrams
Diagram 1. Australian public sector guidance for developing a channel strategy…… and its linkage to managing demand ... 7Diagram 2. UK public sector guidance for channel strategy development…… and its linkage to demand management ...8
Annexes
Annex 1. Notes to Table 2: Number of service contacts by country ... 47ABOUT THIS DOCUMENT
Purpose
This report summarises the findings of a study conducted by the Forum on Tax
Administration‘s Taxpayer Services Sub-group to identify what processes revenue bodies have in place and what steps are taken to understand the root causes of service demand and how that knowledge is applied to either reduce demand or shift it to more cost-efficient channels. Background to the Forum on Tax Administration
The Forum on Tax Administration (FTA) was created by the Committee on Fiscal Affairs (CFA) in July 2002. Since then the FTA has grown to become a unique forum on tax
administration for the heads of revenue bodies and their teams from OECD and selected non-OECD countries.
In 2009, participating countries developed the FTA vision setting out that… The FTA vision is to create a forum through which tax administrators can identify, discuss and influence relevant global trends and develop new ideas to enhance tax administration around the world.
This vision is underpinned by the FTA‘s key aim which is to….. improve taxpayer services and tax compliance – by helping revenue bodies increase the efficiency, effectiveness and fairness of tax administration and reduce the costs of compliance.
To help carry out its mandate, the FTA is directly supported by a number of networks and two specialist Sub-groups—Compliance and Taxpayer Services—that each carry out a programme of work agreed by members. Both OECD and selected non-OECD countries participate in the work of the FTA and its Sub-groups.
The Taxpayer Services Sub-group exists to provide a forum for members to share experiences and knowledge of approaches to taxpayer service delivery, in particular through the use of modern technology. To achieve this objective, the Subgroup‘s mandate calls for it to:
1) Periodically monitor and report on trends in taxpayer service delivery, with a particular focus on the development of electronic/online services;
2) Examine ways to promote the uptake and use of electronic services by revenue bodies; 3) Examine options for cross-border administrative simplification and consistency; and 4) Assist, as appropriate, other groups of the CFA.
Caveat
National revenue bodies face a varied environment within which to administer their taxation system. Jurisdictions differ in respect of their policy and legislative environment and their administrative practices and culture. As such, a standard approach to tax administration may be neither practical nor desirable in a particular instance.
The documents forming the OECD tax guidance series need to be interpreted with this in mind. Care should always be taken when considering a country‘s practices to fully appreciate the complex factors that have shaped a particular approach.
Inquiries and further information
Inquiries concerning any matters raised in this information note should be directed to Richard Highfield (CTPA Tax Administration and Consumption Taxes Division) at e-mail
SUMMARY
All revenue bodies are confronted with the challenge of deciding how their limited resources should be allocated optimally to meet organisational goals and objectives and to satisfy external expectations of good service and reduced compliance burden. This particularly applies in the case of revenue bodies that are currently required to respond to cost-cutting demands flowing from Government decisions to reduce the costs of public sector
administration. Revenue bodies‘ service delivery programmes are a key consideration in this context given the significant level of resources they typically consume and the perceived potential to reduce demand and/or to use technology more effectively in service delivery. Against this background, the Forum initiated a project in early 2011 under the title ‗Working Smarter‘ to examine measures taken by revenue bodies to reduce costs and increase efficiency in the areas of compliance, service delivery, structuring or by using simplified legislation. This note deals with the ‗service delivery‘ component and, as agreed, focuses specifically on
revenue bodies‘ strategies for managing service demand.
In line with the broad objective of the ‗Working Smarter‘ project, this study sought to identify what processes revenue bodies have in place and what steps are taken to understand the root causes of service demand and how that knowledge is applied to either reduce demand or shift it to more cost-efficient channels. Drawing on a survey of revenue bodies and related research, the study‘s key findings are as follows:
Despite having implemented multi-channel service models and setting service objectives to shift taxpayers to self-service and the online channel, many revenue bodies are continuing to experience high demand on their more expensive in-person and inbound call channels.
Most revenue bodies are measuring demand through a variety of methodologies and technologies such as manual processes, call centre and workload control systems and databases that provide useful information on volumes, trends and demand topics; however, these methodologies are typically costly, time-consuming, labour intensive and, most importantly, not effective for determining the root causes of demand. Generally speaking, internal revenue body governance processes for managing service
demand are immature—fragmented, incomplete, and/or lacking co-ordination; and A number of bodies can point to successful strategies for shifting demand to more
cost-efficient channels and numerous examples are identified in the note.
Useful exploratory work, including the piloting of voice analytics technology, is being done in the private sector and by a small number of revenue bodies that offers potential future learning opportunities.
Recommendations
Revenue bodies are encouraged to evaluate their current situation with regard to the use of their service channels to determine where demand management efforts should be focused to improve service and more effectively using revenue body resources. Revenue bodies are encouraged to study and consider implementing the various
demand management strategies and tactics outlined in this report to reduce, shift and better manage demand in-channel.
Revenue bodies are encouraged to consider investing in technologies & methodologies such as those currently being deployed by a few revenue bodies and the private sector to assist them in determining the root causes of their demand.
Revenue bodies are encouraged to study the private sector findings in this report related to the governance required to effect change and reduce the causes of demand on an enterprise wide basis.
I.
INTRODUCTION
Background and context
Government demands and expectations in the aftermath of the global financial crisis in 2008/09 have heightened awareness among public sector agencies of the need to improve the cost-effectiveness of their operations. This has been particularly relevant in a revenue administration context as revenue bodies in many OECD countries have been set
challenging cost reduction targets while maintaining or, preferably, improving their standards of service delivery and the effectiveness of their compliance improvement efforts.
Concerning taxpayer service delivery, the FTA has undertaken considerable work in recent times to identify developments with the use of modern technology in service delivery (including the use of social media).1 However, to date there has been little focus on the efforts of revenue bodies to improve their management of service delivery
demand—to understand the drivers and causes of demand for the various services offered by them and to identify how they can be reduced and/or addressed with more cost-efficient approaches.
The role and work of the Forum
In September 2010 and January 2011, FTA Bureau members discussed proposals for future FTA work and the proposals ‗demand management‘ and ‗managing tax
administrations in a climate of constrained budgets‘, were chosen for future work as a combined new priority project under the combined title ‗working smarter‘.
The Working Smarter project is to examine measures taken by tax administrators to reduce costs or increase the effectiveness of taxpayer compliance and service activities. The project will research and identify measures on the following subjects: 1) working smarter in compliance; 2) working smarter in service delivery; 3) working smarter in structuring revenue bodies; and 4) working smarter with simplified legislation. This note deals with the subject of working smarter in service delivery. For this
component, it was agreed that the Forum‘s Taxpayer Services Sub-group would be leveraged in light of its strong linkages to the current and previous programme of work in this domain (e.g. trends in the use of electronic services in taxpayer service delivery, the use of social media in tax administration, and administration burden reduction, etc). To assist with the work a number of countries agreed to participate in a task group2 to guide the work and the Canada Revenue Agency agreed to lead the study with support from the OECD Secretariat. This note was prepared by staff from the CRA and the OECD Centre for Tax Policy and Administration.
The focus on demand management
The purpose of this component of the work is to collect and share knowledge on developments, strategies and solutions for ‗working smarter‘ as it relates to the service delivery (demand management) component of the larger ‗working smarter‘ project. Demand management ranges from analysing and understanding why taxpayers are seeking the services of revenue bodies to managing the demand to ensure the most effective use of tax administration resources. Understanding the drivers and causes of demand, especially where it is growing faster than anticipated, is becoming increasingly
1 For example, see ‗‗Security and Authentication Issues in the Delivery of Electronic Services to
Taxpayers‘ (December 2011), ‗Social Media and Tax Administration‘ (October 2011) (at
www.oecd.org/dataoecd/50/5/48870427.pdf) and ‗Survey of Trends and Developments in the Use of
Electronic Services for Taxpayer Service Delivery‘ (March 2010) (at
www.oecd.org/dataoecd/20/49/45035933.pdf).
important in an effort to devise appropriate mitigation strategies to deal with future increases in demand and to encourage those requiring assistance to use other more efficient services provided by revenue bodies (e.g. self-help using the Internet). A review of processes, methodologies, and technologies utilised to understand and manage the drivers of demand, including profiling and analytics will be documented. Of particular interest is the use of channel shifting, channel convergence and the use of new
technologies themselves as a strategy for managing demand. The study and this information note
For the purposes of the study, a questionnaire was designed in conjunction with task group members and issued to all members of the Taxpayer Services Sub-group. Twenty five survey responses were received and these serve as the basis for the information and analysis provided in Chapter III. In addition, the study team carried out research to better understand the use of these approaches in the private sector. The key findings from this research are described in Chapter IV while Annex 2 contains a number of private sector examples. Chapter V provides a range of ideas and proposals for future work while Chapter VI sets out a summary of findings and recommendations.
References in the information note to particular private sector organisations or individuals should not be read as implying support, either by the OECD or surveyed revenue bodies, for the services or products offered by them.
II.
DELIVERING SERVICES TO TAXPAYERS—MANAGING
MULTIPLE CHANNELS
Developments with modern technology over the last two decades, especially as they relate to the Internet, have provided revenue bodies with an array of potentially more efficient methods—hereafter referred to as ‗channels‘ in line with industry practice— to deliver services and provide information to taxpayers. With a greater array of channels available for use and a diverse range of clients to deal with, it is obviously important for revenue bodies to have a systematic and structured process to plan for making best use of available service delivery channels, taking account of all relevant considerations (e.g. organisational objectives and resource constraints).
At the same time, there have been many other factors that have added to the volume and complexity of revenue bodies‘ workloads and their management. These include the tendency for tax legislation to become more complex, frequent changes in tax legislation, a trend by Governments to give revenue bodies additional responsibilities (e.g. welfare-related tasks) that add to client contact workloads, increasing expectations by taxpayers and their agents of high standards of service delivery performance, and increased demands by Governments on public sector agencies for improved cost-effectiveness. For all of the reasons outlined, balancing the use of the different channels for optimal
service delivery with cost-effectiveness considerations has become increasingly more complex for revenue bodies.
Channel strategy development and management
Service delivery channels An Australian Government paper published in 2006 defines a channel as ―the access mechanism used by both Government and customers to interact‖.3 It goes on to give the following examples of channels:
On-site – shop-fronts, appointments On-paper- letters, brochures, reports etc. On-call – call centres, hotlines
On-line – website, e-mail etc. On air – radio, TV
On-the-go – personal digital assistants (PDAs), short messaging service (SMS), video messaging.
Viewed in 2011, this classification can be extended to include the use of tools such as phone IVR and the social media platforms such as YouTube, Facebook, and Twitter. Channel strategy development
With the growth in technology capabilities and demands for improved performance, central public sector agencies in some countries have been encouraging their respective programme agencies to intensify their efforts to make more effective use of electronic service channels. To help agencies deliver the potentially realisable benefits, practical guidance has been developed and disseminated for their attention. For example:
The guide ‗Delivering Australian Government Services, Managing Multiple Channels‘, first published in April 2006 was ……. ―developed to provide agencies
3 ‗Delivering Australian Government Services, Managing Multiple Channels‘ Australian Government,
with insight and guidance into the strategic considerations for developing a robust channel strategy. The document also provides guidance for aligning customer needs, services, outcomes and channel mix.‖4
Drawing on the guide, Diagram 1 sets out the elements of a strategic approach for enhancing service delivery and outlines a five step process for an agency to develop a robust channel strategy, including a ‗phase one: situation analysis‘. For the purpose of this note and its focus on demand management, Diagram 1
highlights the steps considered appropriate to conducting a ‗situation analysis‘. The guide ‗Choosing channels: Optimising the channel mix in the UK public
sector‘ prepared by Deloitte for the UK public sector and published in April 2007……. ―analyses the three key dimensions of any strategy: knowing your services; knowing your customers and knowing your channels……… and provides a number of practical and pragmatic ways (for agencies) to improve their channel mix and achieve their priorities.‖5
Drawing on the guide, Diagram 2 sets out the elements of a suggested strategic approach, consisting of three phases, for an agency to enhance the delivery of services to its customers. Diagram 2 highlights the steps considered appropriate for phase two—know your services, know your channels, know your customer, choose channels and then redefine your channel strategy, given their relevance to managing service demand.
While the two examples are presented slightly differently, both recommend a strategic approach for their respective public sector agencies to improve overall service delivery performance that generally embodies the following elements:
1) Understand your current situation (i.e. the service channels used, their volumes and costs);
2) Identify the factors that drive use of specific service channels and the underlying ―root causes‖ of service demand (e.g. poor website design resulting in taxpayers using the phone channel rather than ―self-serve‖);
3) Adjust service delivery strategies taking account of knowledge of the main root causes; and
4) Monitor the impact of the revised strategies and take further action as needed. This practical guidance provides brief context for the subject of this note—demand
management—and its focus on the steps being taken by revenue bodies to identify the root causes of service demand and the strategies being deployed to either reduce demand or shift is resolution to more efficient/less costly service channels.
4 As reported at www.finance.gov.au/publications/delivering-australian-government-services-access-and-distribution-strategy/channel-management.html
Diagram 1.Australian public sector guidance for developing a channel strategy…… and its linkage to managing demand
Source: ‘Delivering Australian Government Services, Managing Multiple Channels’, Australian Government, Department of Finance and Administration, April 2006. DEVELOPING A CHANNEL STRATEGY
The following elements are the foundation for a channel strategy. They also detail possible considerations for the agency in relation to business objectives and priorities:
Phase One: Situation analysis—To understand and process information an agency currently possesses regarding services, channels and customers.
Phase Two: Channel design—To align channels with customer needs, service characteristics and agency priorities.
Phase Three: Measurement design—To determine the measures of success.
Phase Four: Implementation—To develop a plan for implementation of a channel strategy.
Phase Five: Refinement—To evaluate and refine the channel strategy.
Phase One: Situation Analysis
Purpose: To understand and process the information an agency currently possesses regarding services, channels and customers. Questions to consider:
• What are the agency’s current priorities? • What services does it offer?
• Who are the customers?
• What services do the customers access? • What channel(s) does the agency deliver services through?
• What is the current usage of each channel? • What is the level of customer satisfaction with each channel?
• What are the costs of delivering services through each channel (channel economics)?
• Are there any additional forces impacting upon the agency’s current channel strategy?
THE STRATEGIC APPROACH DEVELOPING A STRATEGIC APPROACH THE STRATEGIC APPROACH AND
DEMAND MANAGEMENT
WHAT IS A CHANNEL STRATEGY A ‘channel strategy’ is a set of business driven choices aimed at delivering services to customers efficiently and effectively using the most appropriate mix of channels for the customer and the agency. The channel strategy can enable agencies to manage service delivery to customers through the most appropriate channel. It can illustrate the best method for customer interaction, the most appropriate type of interaction and the method of interaction best supported by different channels.
Diagram 2.UK public sector guidance for channel strategy development…… and its linkage to demand management
Source: Adapted from ‘Choosing channels: Optimising the channel mix in the UK public sector’, Deloitte 2007. Phase 1. Make the most out of
existing resources, focusing in particular on improvements to work practices. By addressing people and process issues, particularly those at key crunch-points that drive productivity, it is possible to make progress without this needing to touch IT. The savings from these improvements can be captured and then re-invested in subsequent phases. Phase 2. Undertake analysis to know your services; know your channels; know your customer; choose channels; and then redefine channel strategy. Phase 3. Execute the redefined strategy channel strategy, paying due care to the lessons that others have learned about instigating a successful channel shift
Know your services: While service efficiency is driven by its delivery, getting the right information about a service to the right people can be just as important. A service is based on three distinct elements: marketing, communication, enquiry, and service delivery. Each may be delivered by a variety of
channels. Agencies should ensure that all three elements work in synergy to support each other.
Know your channels: Over the last decade, mobile phones, the Internet, and digital television have joined more traditional means of service delivery such as the telephone, post, and in-person contact. Navigating this frontier is the second key element to optimising channel mix. This requires an understanding of how channels differ in terms of cost and reach.
Know your customer: Greater insights into customer needs and preferences when interacting with Government is crucial if efficiency gains and service improvements are to be realised. This insight should include information on how a customer currently uses channels to access a service, and how they may do so on the future. Customer segmentation approaches can be used to define and size chosen segments, assign appropriate channels for each segment, and determine what channel migration can be achieved for different segments & how best to do it.
Choose channels: Completion of the prior steps provides the knowledge to define a choice of channels. Typically, five key factors drive choice, or choices of channels: volume, process standardisation, complexity of information, need for the
human touch, and propensity of customer to self-serve.
THE STRATEGIC APPROACH STRATEGIC APPROACH DEVELOPING A STRATEGIC APPROACH: REDEFINE CHANNEL STRATEGY
The path to service transformation includes both long term and short term steps. Realistically cross-Government collaboration should be regarded as a long term goal. As well as requiring significant investment, it also implies substantial cultural change and runs counter to the interests of many existing stakeholders. In other words, barriers to change are likely to be high.
In the shorter term, a more pragmatic package of measures is possible, which can provide stepping stones to service transformation. Channel optimisation within the existing Government framework should deliver real efficiency savings and improved customer experience.
A three phase approach is illustrated below:
Execute channel strategy Optimise existing channels Redefine channel strategy Invest Save
III.
EXISTING REVENUE BODY STRATEGIES AND APPROACHES
FOR MANAGING TAXPAYER SERVICE DEMAND
This section sets out the findings of a survey of 25 revenue bodies that responded to a questionnaire designed to gather information on methodologies and technologies that they are using to determine why taxpayers initiate contact and to identify the strategies currently being deployed to manage demand. Specifically, it identifies:
1) The service delivery model for each of the revenue bodies;
2) The methodologies and technologies used to measure and analyse demand on their service channels;
3) The governance structures that exist to ensure information gained from demand analysis is used to affect change; and,
4) The strategies used to manage service demand.
Where helpful, examples are provided from individual revenue body‘s survey responses.
Service delivery models
Survey responses revealed that almost all revenue bodies have an established service delivery model. Most described the model as multi-channel, although not all revenue bodies use the same channels to deliver services. Table 1 shows the service channels used by country. It should be noted that the survey did not request information or contact volumes for the web as the objective for most revenue bodies is to move demand from traditional channels to online.
Table 1.Service channels by country Country delivery Service
model exists
Service channels offered Overall goal to move contacts to
electronic channels In-person Call Centre Paper Email
Australia Austria Belgium Canada Chile Denmark Estonia Finland France Hong Kong, China √ Hungary √ Italy Japan √ Mexico √ Netherlands New Zealand √ Poland Singapore √ South Korea Spain Sweden √ Switzerland √ Turkey √ UK √ USA √
Table 2 shows the number of service contacts per country (with explanatory notes provided in Annex 1). In reviewing these volumetrics, it should be noted that the definition for contacts varies across countries. There are also variations in the programmes administered by different revenue bodies (e.g. some revenue bodies administer welfare and retirement income related programmes) with consequential impacts on service demand workloads.6 For these reasons, the tables (with channel volumes) do not provide a benchmark or comparisons of countries based on a common set of measures. Rather, countries are encouraged to review these volumetrics with a view to analysing why demand is continuing or appears relatively high on expensive channels and developing strategies to encourage the shift to less expensive channels. In particular, countries are encouraged to analyse the mix of channels being used most often
Table 2.Service contact volumes by channel type and country
Country Contacts in nearest thousands across channels and years
In-person visits Inbound calls Paper correspondence Email correspondence
2008 2009 2010 2008 2009 2010 2008 2009 2010 2008 2009 2010 Australia 691 731 662 10,151 12,543 10,119 3,517 3,977 3,110 27 28 19 Austria 920 920 920 3,800 3,900 3,850 - - - 98 110 124 Belgium - - 147 686 989 1,006 25 18 14 - - - Canada 303 371 240 21,900 23,700 23,500 457 464 407 - - - Chile 35 34 34 813 885 857 102 136 131 15 22 22 Denmark - - 147 3,800 3,640 3,390 - - - 350 345 400 Estonia - 382 312 139 164 235 See
notes notes See notes See 14 23 29
Finland - - - - 4,,500 5,000 - 25,860 26,660 - - - France 16,800 17,200 17,400 9,200 10,800 11,700 - - - 500 500 600 Hong Kong, China 222 226 226 1,100 1,226 1,244 459 426 427 157 163 102 Hungary 2,550 2,367 2,374 1,900 1,833 1,542 521 517 423 29 44 39 Italy 9,051 9,901 10,289 1,567 1,662 1,822 - - - 33 44 56 Japan 4,403 4,231 3,767 4,876 5,136 5,039 - - - - Korea - - - - Mexico 7,730 7,431 7,423 4,530 4,749 4,773 1,179 200 110 0 0 0 Netherlands 1,000 1,000 1,000 16,300 17,400 14,800 1,000 1,000 1,000 0 0 0 N. Zealand 262 242 219 4,407 4,231 3,894 1,592 1,359 752 2,461 3,210 608 Poland - - - 1,238 1,431 1,504 - - - - Singapore 239 186 143 965 999 1,022 581 450 280 215 258 220 Spain 3,091 3,165 3,033 5,500 5,800 6,700 See
notes notes See notes See - - -
Sweden - - 3,000 6,300 6,300 5,300 See
notes notes See notes See 210 280 400
Switzerland 1 1 1 200 210 220 210 220 200 35 45 80
Turkey 30 32 55 176 198 254 - - 1 - - -
UK 3,300 3,200 3,200 58,700 59,800 59,800 15,000 10,800 8,600 - - -
USA 6,900 6,200 6,400 See
notes notes See notes See 20,000 20,000 21,000 40 47 52
Table 3 below provides a comparative analysis of reported channel volume against country citizen population. As with the volumes in Table 2, when reviewing these volumetrics it should be noted that the make-up of the figures or definition for contacts varies across countries and that there are variations in the programmes and manner in which they are administered by the different revenue bodies.
Table 3. Comparative view of demand management volumes (2010) Country Citizen popula-tion (mln) /1 Number of in-person visits (mln) In-person visits / citizen popula-tion (%) Number of inbound calls (mln) In-bound calls/ total citizen population (%) Inbound calls+ in-person (%) Ratio of inbound calls/ in-person visits Australia 22.0 0.662 3.1 10.120 46.0 49.0 15.8:1 Austria 8.4 0.920 10.9 3.850 35.3 46.2 3.2:1 Belgium 10.8 0.240 2.2 1.006 9.31 11.5 Canada 33.7 0.240 0.7 23.500 69.7 70.4 99.0:1 Chile 16.8 0.034 0.20 0.860 5.1 5.3 Denmark 5.5 0.147 8.0 3.390 61.6 69.6 7.7:1 Estonia 1.3 0.312 24.0 0.235 18.1 42.1 Finland 5.3 5.000 94.3 France 62.6 17.4 27.8 11.700 18.7 46.5 0.67:1 Hong Kong, China n.avail. 0.226 1.245 Hungary 10.0 2.374 23.7 1.542 15.4 39.1 0.64:1 Italy 59.8 10.289 17.2 1.822 3.0 20.2 0.30:1 Japan 127.5 3.767 2.95 5.039 3.9 6.85 1.3:1 Mexico 107.5 7.4 7.0 4.773 4.0 11.0 0.58:1 Netherlands 16.5 1.0 6.0 14.800 89.7 95.7 15:1 N. Zealand 4.3 0.219 5.1 3.894 90.6 95.7 18:1 Poland 38.1 n.avail. - 1.504 3.9 - - Singapore 5.0 0.143 2.8 1.021 20.0 22.8 7.0:1
South Korea 48.8 n.avail - n.avail - - -
Spain 45.9 3.032 6.6 6.700 14.6 21.2 2.3:2 Sweden 9.3 3.0 32.0 5.300 57.0 89.0 1.66:1 Switzerland 7.7 0.001/2 0.01 0.22 /2 2.9 2.0 Turkey 72.0 0.055 0.08 0.254 0.4 0.1 UK 60.9 3.2 5.0 59.8 98.2 103.2 20.0:1 USA 307.0 6.4 2.1 82.7 26.9 29.0 13.0:1
/1. Country population data as reflected in Table 45 (page 211) of ‗Tax Administration in OECD and Selected Non-OECD Countries: Comparative Information Series (2010)‘.
/2. All data volumes relate to VAT administration only.
Drawing on the data provided in Tables 1, 2 and 3 there are some important observations that can be made in the context of this study:
Despite having a multichannel environment and having made significant
investments in their online channel, many revenue bodies continue to experience relatively high demand for their telephone and in-person channels. A similar observation was noted in the Forum‘s 2010 report ‗Survey of Trends and Development in the Use of Electronic Services for Taxpayers Service Delivery‘. There is considerable variation across countries in the proportion of contacts for
the various channels when viewed on the basis of country population. Some of these variations may be explained by variances in terms of what revenue bodies included in their volumetrics, by the mix of channels available to taxpayers and other factors (e.g. cultural) but further investigation of this situation may present opportunities for revenue bodies to improve efficiency and services to taxpayers. All revenue bodies reported that they use the in-bound call channel. From a
comparison of demand across all channels it is evident that this channel is preferred by taxpayers.
Almost all use in-person service; some revenue bodies indicated that they are encouraging movement away from this channel due to its high costs.
While many offer service via paper, volumes are decreasing.
Demand on the e-mail channel is increasing; many reported treating this channel the same as paper and making efforts to reduce or discourage its use.
Strategy to move taxpayers to the electronic channel
Although it is apparent from the volumetrics in Table 2 that the traditional channels continue to be the preferred channels, 22 of the 25 revenue bodies confirmed that their service objective is to migrate taxpayers to ‗self-serve‘ and preferably the online channel. A sample of the responses received is set out below:
Australia: The ATO has a Service Delivery Framework that provides the strategic direction to move clients to electronic channels.
Belgium: For each e-service (e.g. electronic returns for personal income tax, VAT, etc.) quantified goals are set and data are pre-filled as far as possible.
Canada: The Canada Revenue Agency‘ s Service Strategy articulates the long-term goal that the majority of taxpayers conduct their tax and benefit affairs with the agency on a self-service basis.
Chile: The SII has incorporated and developed the use of Internet as its preferred channel for addressing taxpayer service requests. The use of the electronic channel has helped taxpayers to significantly reduce mistakes and problems in their tax returns.
Denmark: As far as possible contact via e-mail, letter, in-person and walk-in enquiry centres are to be replaced by telephone contact, or preferably by better electronic services.
Estonia: The revenue body (ECTB) has set an objective for 2009-2012 to reduce the administrative burden of law-abiding citizens through the diversification of the services provided and improvement of the process quality. It means that it will further develop its e-environment, and provide new e-services and simplified processes.
France: French tax authorities undertake strong advertising campaigns to encourage taxpayers to use the internet channel for filing their tax returns or paying their taxes. Advertising campaigns take various forms: radio commercial, press articles, TV news reports, flyers distributed in public places, and web banners. A national press conference is held every year by the Finance Minister and followed by local press conferences in every department (i.e. region). Mexico: Through two strategic goals (Simplification of procedures and services
and Tax Culture Program), the revenue body seeks to facilitate the education process and promote the use of electronic tools and services to reduce the inflow to the centres of personal attention.
Spain: One of the revenue body‘s strategic initiatives is enhancing the relationship with taxpayers through ICT. One of the main tasks is the enlargement and adaptation of electronic services provided to citizens and companies. The activities involve promotion and diffusion of the electronic mechanisms of electronic communication.
Singapore: IRAS‘s strategy is to provide an easily accessible, simple and convenient suite of e-services where taxpayers can self-serve at any time and place at their own convenience. IRAS also provides useful and comprehensive information presented in a taxpayer-centric manner on its website that allows taxpayers to self-serve for their simple enquiries.
Sweden: Moving contacts from manual service to self-service in electronic channels is an important part in our strategy. We try to make the services offered in the electronic channels more attractive and built from a user perspective.
Understanding service demand
Demand management ranges from analysing and understanding why taxpayers are seeking the services of revenue bodies, to managing the demand to ensure the most effective use of tax administration resources and channels.
Understanding the topics/drivers and root causes of demand, especially where it is growing faster than anticipated, is becoming increasingly important in an effort to devise appropriate mitigation strategies to deal with future increases in demand and to
encourage those requiring assistance to use other more efficient services/channels. Box 1 illustrates the difference between the topic/driver of a contact and the root cause.
Box 1.Understanding the terminology—‘topic/driver’ versus ‘root cause’
A taxpayer may initiate a call to a revenue body‘s call centre to obtain a business number. From a topic/driver perspective, this call would be classified as a request for a business number or business registration. However, to determine the ‗root cause‘ the issue to be resolved is to understand precisely why the taxpayer decided to call and speak with an agent to obtain a business number when he/she could have used the online business registration system or sent in a request by mail instead. More specifically, it needs to be determined why these other methods may not have been considered by the taxpayer. For example, was it because:
1) Of a lack of awareness of the other methods available? In which case the mitigation strategy may be around better marketing?
2) The online system was difficult to use? This may lead us to suggesting changes to the online system.
3) The documentation in the paper registration kit was difficult to understand or left questions unanswered? That would require a rewrite of the information.
4) The taxpayer required a business number on an urgent basis and decided that the quickest way of obtaining it would be to call and speak to an agent? That could suggest a realignment of service standards to make the online issuance of a business number the fastest service. 5) The taxpayer was advised by some external organisation to call for the number? This could
mean ensuring that the external organisation has the right information.
Once the underlying reason or cause for the contact has been determined, the revenue body will be in a much better position to affect positive change. Understanding demand needs to goes beyond
establishing topics or drivers of contacts. It is only by determining the true root cause of contacts that you will be able to influence those contacts in the future.
Measuring Demand
The survey found that the majority of revenue bodies actively measure demand on their service delivery channels. Specifically, the survey responses revealed that:
23 of 25 revenue bodies measure demand on some of their service delivery channels with the inbound call channel being measured most at 23 of 25, followed by the in-person channel at 21 of 25. This is likely due to the fact that these are the channels receiving the bulk of the contacts; and
Of the 18 revenue bodies that offer service via paper and e-mail, most measure the demand to these two channels.
The aim of this study was not to measure and identify the particular topics/drivers that each revenue body experiences, but rather to identify the methodologies and technologies that are used to measure demand and whether these are also being used to identify the topics/drivers and root causes behind the demand. The following sections summarize the results for each channel.
Methodologies and technologies by channel
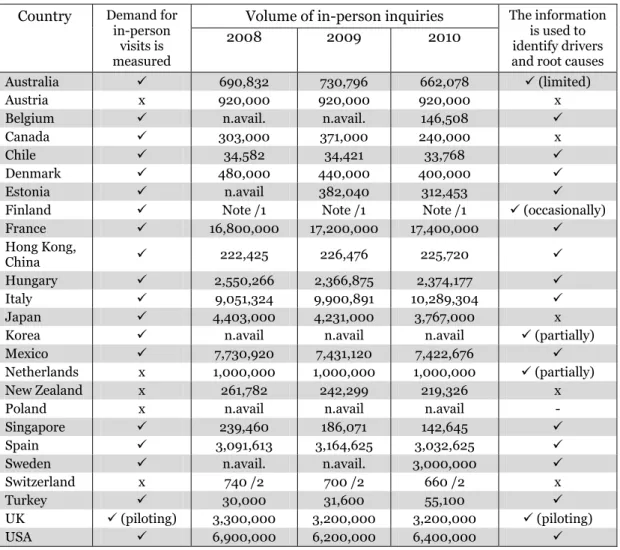
In-person channel The in-person channel continues to be one of the primary service delivery channels. As shown in Table 4 below, 21 of 25 surveyed revenue bodies reported that they measure demand on this channel and 13 reported that they use the information to identify drivers and root causes; five revenue bodies are piloting or partially use or make limited use of the information.
Table 4.Measurement and use of in-person demand information Country Demand for
in-person visits is measured
Volume of in-person inquiries The information is used to identify drivers and root causes
2008 2009 2010
Australia 690,832 730,796 662,078 (limited)
Austria x 920,000 920,000 920,000 x
Belgium n.avail. n.avail. 146,508
Canada 303,000 371,000 240,000 x
Chile 34,582 34,421 33,768
Denmark 480,000 440,000 400,000
Estonia n.avail 382,040 312,453
Finland Note /1 Note /1 Note /1 (occasionally)
France 16,800,000 17,200,000 17,400,000 Hong Kong, China 222,425 226,476 225,720 Hungary 2,550,266 2,366,875 2,374,177 Italy 9,051,324 9,900,891 10,289,304 Japan 4,403,000 4,231,000 3,767,000 x
Korea n.avail n.avail n.avail (partially)
Mexico 7,730,920 7,431,120 7,422,676
Netherlands x 1,000,000 1,000,000 1,000,000 (partially)
New Zealand x 261,782 242,299 219,326 x
Poland x n.avail n.avail n.avail -
Singapore 239,460 186,071 142,645
Spain 3,091,613 3,164,625 3,032,625
Sweden n.avail. n.avail. 3,000,000
Switzerland x 740 /2 700 /2 660 /2 x
Turkey 30,000 31,600 55,100
UK (piloting) 3,300,000 3,200,000 3,200,000 (piloting)
USA 6,900,000 6,200,000 6,400,000
/1. Finland: In-person not measured systematically, data collected when needed from the largest tax offices. The behaviour of customers varies greatly depending on the area.
/2. All data volumes relate to VAT administration only.
Methodologies and technologies for measuring demand
Of the 21 revenue bodies that measure demand in this channel some are using queue management systems (QMS) while others are manually tracking the number of taxpayers using this channel. For those tracking demand manually, the volumes are then typically entered into a database that can be accessed to provide statistical analysis on volumes, trends and the topics or drivers of demand. A few are using employee focus groups and analysis from their Customer Relationship Management (CRM) systems. Some revenue bodies only measure demand on this channel during filing or peak periods. Examples of survey responses are set out below:
Australia: The methodology used to measure the volume of in-person demand is obtained through manually input data from staff in the Shopfronts. The process involves selecting the main topic the client sought assistance with and whether the interaction involved an interview.
Canada: The Canada Revenue Agency (CRA) uses three methodologies to measure demand for the in-person channel: 1) counter agents record the number of walk-ins and how they are served (by appointment, telephones to call centres etc.); 2) appointment agents record the topic(s) discussed and duration of the appointment; and 3) periodically counter agents survey clients to determine why they continue to choose the in-person service.
Denmark: Manual ticking of boxes in an online form for a selected number of days per month for each customer being serviced at the counter in the tax offices. Finland: Occasionally, data of the root cause are gathered manaully under a
specific theme. Manual reports on statistics (volumes mainly) and reasons for contacting e.g. when new services are launched or changes in taxation occurred. Also in use is a queue management system to tell about the demand factor. France: The measures are realised using a QMS which allows the revenue body to
count the number of taxpayers received and to capture the main reason of their visits (the tool is customised to register the main causes for taxpayers visits). New Zealand: IRD‘s in-person service is split into two parts, reception and
counter. Reception deals with any query able to be managed by a receptionist— generally high volume/low value in nature. Counter handle the more complex enquiry, and are managed on an appointments only basis. To date, the
methodology for measuring demand has been by manual reporting and recording of volumes and time in two separate places.
Spain: In its local offices, the revenue body uses ticket expenditure machines that require taxpayers to select the topic of the service(s) required; this enables it to identify the root causes of demand and put in place short term resourcing.
Ability to determine the driver and root cause
Generally revenue bodies indicated they use the information gathered to schedule the appropriate number of staff and skills needed to meet demand and address taxpayer needs. There was no indication that changes were made to business processes to actually reduce demand or address the root cause that initiated the taxpayer concerns, thereby mitigating the need for them to contact the revenue body. In other words, the information has been used to develop demand management strategies to better manage the channel and increase the quality of service provided but has not allowed the organisation to maximize efficiency gains by eliminating the demand or shifting it to self-service. Set out below are country responses regarding their ability to determine the driver and
root causes of service demand:
Australia: The ATOcan track the volume of client interaction in its Shopfronts, the type of interactions (interview/non-interview) and the topics clients visit to discuss. However, the data cannot be used to identify specific client groupings and the reasons for their engagement with the ATO via the Shopfronts. Canada: The methodologies gather useful information but do not support
analysis as to the causes of demand. The value of gathering this information is that it provides data for demand forecasting and staff scheduling. The
information regarding topics commonly driving the in-person channel is also used to ensure staff training and reference material reflect taxpayers‘ needs and expectations and that information on the topic is available on the web.
Chile: For all channels we use Database analysis using Data Warehouse. The analysis of the data provided by the Data Warehouse allows the SII to identify the
root cause behind the demand, but they do not tell us how to handle it. This we can only obtain from contact information analysed.
Hong Kong: An electronic queuing system records the number of callers. At the same time, the counter staff record the nature of enquiries raised by each call by inputting work-codes.
Mexico: The systems deliver metrics on the demand for point of contact, type of service, time, frequency, timing, and seasonality. Qualitative information and perceptions from exit polls also help to identify the causes of demand.
New Zealand: Currently in-person contacts are recorded in our tax accounting database (OLACS) combined with data mining. This technology could be used to identify some further information about drivers/root causes for the counter contacts, but not reception contacts as IRD numbers and other data is not captured at reception. Significant manpower and data-mining would be required to determine drivers and root causes.
Singapore: The QMS is only able to track the broad categories of walk-ins; while the QMS is unable to identify the driver and root causes of demand it offers a good starting point for more in-depth analysis of demand drivers. The reports generated from the customer relationship management module show the exact number of contacts for each category of taxpayer and the nature of the contact; however, this all requires staff resources for accurate and comprehensive data to be captured.
Sweden: The Swedish Tax Agency uses in-depth interviews of taxpayers as well as focus groups. Interviews are carried out by private sector consultants, not revenue body staff.
United States: Q-Matic tracks the number of customers, how long it took to be serviced and the service type of their visit. Trends in the service type demand can be identified however not the driver or the root cause.
Benefits and Challenges
There are a number of benefits to using Queue Management Systems to measure demand to the in-person channel. Respondents indicated that these systems provide an automated way of tracking the number of visits, are typically easy to use, and provide a wide variety of reports for analysis purposes. They also provide a breakdown of contacts by tax type or topic but the accuracy of the breakdown is dependent on taxpayers selecting the correct tax type or topic. However, only those using agent interview or CRM systems indicated that are able to identify root causes.
When it comes to challenges, revenue bodies indicated that measuring visits and
recording the driver or root cause of the visits manually is labour intensive and can lead to imprecise data as is analysing data from agent visits or CRM systems.
Summary
As indicated above, the methodologies and technologies generally used in this channel do provide extremely useful information regarding demand topics, volumes, and trends that are needed to better manage demand in channel. However, few provide the granularity required to determine the root cause of the contact.
In-bound calls channel
The inbound call channel continues to be the most popular service delivery option with taxpayers. All revenue bodies reported that they use the in-bound call channel and 24 out of 25 revenue bodies measure or partially measure the demand for in-bound calls. When it comes to using the information to determine drivers, 16 revenue bodies reported that they do use this information to determine drivers with an additional six reporting that
they do so on a limited, occasional or partial basis. Table 5 below is a summary of the data reported by revenue bodies.
Table 5.Measurement and use of inbound call demand information Country Demand for
in-bound calls is measured
In-bound phone call volumes The information is used to determine drivers
and root causes
2008 2009 2010 Australia 10,151,169 12,543,526 10,119,409 (limited) Austria 3,800,000 3,900,000 3,850,000 Belgium 686,383 988,974 1,006,225 Canada 21,900,000 23,700,000 23,500,000 (partially) Chile 813,036 884,566 857,420 Denmark 3,800,000 3,640,000 3,390,000 Estonia 138,754 164,013 235,461 Finland 4,500,000 5,000,000 (occasionally) France 9,200,000 10,800,000 11,700,000 x Hong Kong, China 1,099,385 1,226,166 1,244,498 Hungary 1,899,954 1,833,180 1,542,085 Italy 1,567,285 1,662,488 1,822,343 Japan 4,876,000 5,136,000 5,039,000 x
Korea x n.avail n.avail n.avail. (partially)
Mexico 4,529,577 4,749,079 4,772,851
Netherlands 16,300,000 17,400,000 14,800,000 (partially) New Zealand 4,406,845 4,230,914 3,894,454 (partially)
Poland 1,237,943 1,431,301 1,504,074 Singapore 965,075 999,040 1,021,543 Spain 5,500,000 5,800,000 6,700,000 Sweden 6,300,000 6,300,000 5,300,000 Switzerland (partially 200,000 /2 210,000 /2 220,000 /2 x Turkey 175,582 198,427 254,132 UK 58,700,000 59,800,000 59,800,000 USA /1 317,000,000 216,000,000 222,700,000
Note: /1. USA: This may include calls that are in response to information requests since we cannot differentiate. /2. All data volumes relate to VAT administration only.
Methodologies and technologies for measuring demand
Most revenue bodies measure demand in terms of volumes and timing of contact on the inbound calls channel primarily through call management systems that operate in real-time. A few countries also use telephone metrics reports provided by the telephony companies providing service. Listed below are some examples.
Australia: Call demand is measured by queue. Each queue maps to a particular option or set of options in the IVR attached to the various ATO Inbound Numbers. Accordingly, demand can only be measured in terms of the IVR selection options available to the client. In the ATO, these are set up by Product Group (Income Tax, Business Tax, Superannuation, and Payment Compliance) and also by Client Group (General Public, Practitioner).
Canada: The toll-free information system determines the actual number of calls and unique callers that attempt to access the telephone channel. Since each different service has its own unique toll-free number at a high level we are able to determine which business line they are calling but not the root cause of the call.
Hong Kong: A computerised system – Call Management System, is used to measure the demand. It measures the real-time incoming calls, such as the number of successful incoming calls, the longest waiting time etc.
Korea: The Call Management System automatically tracks demand. However, root cause analysis is only performed partially by the staff when relatively large numbers of taxpayers make the same type of inquiries.
Singapore: Call Management System (CMS) – This system allows IRAS to measure the number of calls for any specified period. The system tracks demand at the helpline based on the tax type of the enquiry selected by the taxpayer at the Integrated Voice Response (IVR) system. Reports can be generated from CMS to show the total number of calls for a specified period, the breakdown for each tax type, the average waiting time, the resources used for the helpline for that period.
Ability to determine the driver and root causes of service demand
The survey asked whether the information gathered to measure demand can be used to identify the driver or root causes of the demand. Many of the revenue bodies that measure demand reported they also gather information to determine the drivers and/or root causes of demand. Table 6 below provides the specific methodologies and technologies currently being used for this purpose.
Table 6.Methodologies/technologies to identify drivers and root causes Methodologies and technologies Countries using these methodologies
and technologies Feedback through interviews with call centre agents Belgium, Canada, Estonia, Finland,
Korea, Poland, Singapore, Switzerland
Coding by call centre agents on the call topic or tax type
(also referred to as Fast Key Codes or Work Codes) Australia, Canada, Hong Kong, New Zealand, United Kingdom
Interactive Voice Response (IVR) Systems Australia, Canada, New Zealand, Singapore, United States
Call listening/Quality assurance data Australia
Caller surveys Australia, Canada, Finland, Hungry,
United Kingdom
Databases information on the services provided to taxpayers
Chile, Italy, Mexico, Spain, United States
Contact/Speech analytics Australia, New Zealand, United States
Customer Relationship Management (CRM) Systems Belgium, Singapore
As identified above, two countries are using a tool called contact/speech analytics with an additional country (New Zealand) planning a short pilot to evaluate its potential benefits. Box 2 provides a description of contact/speech analytics.
Box 2.What is contact/speech analytics?
Speech Analytics technologies are automated tools that mine, categorize, and analyse unstructured audio from dialogue. While the various products available differ in their methods of breaking down and analysing human speech, all provide near real-time feedback designed to extract useful information from customer interactions.
These products can provide a better understanding of customer behaviour and analyse call content automatically to provide insight into why customers call. They can be used to isolate words and phrases used most frequently and indicate whether usage is trending up or down. You can even zero in on the emotion of calls by searching for certain keywords or phrases.
Simply put, the purpose of speech analytics is to: 1) record the information; 2) structure the information into searchable data; 3) analyse the data; and 4) take action on the findings of the data analysis.
Additional details on the methodologies and technologies used by surveyed revenue bodies to determine drivers and root causes of service demand are set out below:
Australia: The ATO is currently implementing the Verint capability, a complete suite of products that allows the integration of quality assessment data, speech and data analytics, and customer satisfaction survey results. Queue history in Verint will provide an indication on demand. Speech and Data Analytics
capabilities will allow for drivers, root causes and correlation between issues to be identified. For example in Speech Analytics, phrases can be established to mine data for why the customer is calling, and compare this to queue history on our Interactive Voice Recognition systems.
Belgium: Interactions (received, abandoned, answered, AHT, etc.) and questions (type of questions and more detailed content of the questions) are measured primarily through analysis on question level (CRM). However, this quantitative approach has to be combined with a qualitative approach (i.e. formal and informal discussions with agents and team leaders). Staff effort is not measured. Canada: Line of Business Coding – Using a web interface Call Centre Agents code
the types of enquiries received. This information is summarised and available in near real time. Not all calls are coded but rather a daily sample is taken. This provides volumetrics on the number of calls based on pre-established categories. Although this system does not provide the CRA with the root causes of calls it does provide the number of enquiries by category. This system provides an indication of what taxpayers are calling about but not why they are calling. Mexico: The incoming calls through an IVR (Interactive Voice Response) – The
IVR can be used to identify the factors and the main reasons behind the demand throughout nine options, which only requires extracting automatic information. Singapore: Siebel is IRAS‘s customer relationship management system, which
allows it to track the mode, exact date and time and nature of contact that each taxpayer has with us. Officers will enter the details into the system after each contact with taxpayers. Reports can be generated for specified periods to show the total number for each category and specific nature of contact (e.g. assessment related enquiry > checking on status of assessment).
United Kingdom: Call Classification and Voice of the Customer (VoC) Postcards – Classification of calls handled is undertaken by a group of advisors (per line of business) who classify every call they take into categories that reflect the reason for their call in the words (―voice‖) of the customer. This information is used to produce a ‗Skyline‘ report that includes reports on trends, call value, cost to serve and percentage breakdowns. The VoC Postcard provides further qualitative views on the calls and their root causes directly from advisors.
United States: Contact Analytics (CA) is a tool that evaluates recorded audio from contact centre recordings to identify contact centre improvement opportunities. It converts the contact centre recordings into a searchable text file that allows large segments of recorded calls to be selected as a group and reviewed based on user-specified words and phrases to help the user to isolate and analyse an issue. It provides users with the ability to drill down to individual recordings to hear selected conversations. Although it does not measure demand, it allows for identification of the root cause and drivers of demand. Contact Analytics provides for keyword searches on specific topics. Beneficial for ‗hot topic‘ issue estimates. The data can be used for estimating but is not considered a valid sample for forecasting demand. Extraction and analysis of the data are time-consuming and costly.
Benefits and challenges
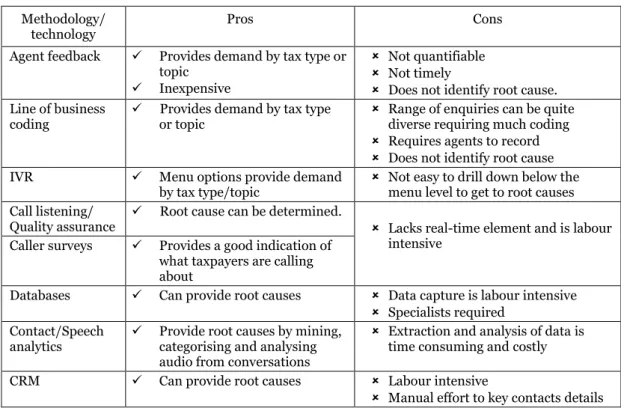
Table 7 below identifies the methodologies/technologies used by revenue bodies and some of the benefits and challenges reported.
Table 7.Pros and cons of call demand methodologies/technologies Methodology/
technology Pros Cons
Agent feedback Provides demand by tax type or topic
Inexpensive
Not quantifiable
Not timely
Does not identify root cause. Line of business
coding Provides demand by tax type or topic Range of enquiries can be quite diverse requiring much coding
Requires agents to record
Does not identify root cause IVR Menu options provide demand
by tax type/topic Not easy to drill down below the menu level to get to root causes Call listening/
Quality assurance
Root cause can be determined.
Lacks real-time element and is labour intensive
Caller surveys Provides a good indication of what taxpayers are calling about
Databases Can provide root causes Data capture is labour intensive
Specialists required Contact/Speech
analytics Provide root causes by mining, categorising and analysing audio from conversations
Extraction and analysis of data is time consuming and costly CRM Can provide root causes Labour intensive
Manual effort to key contacts details Many of the methodologies and technologies identified by respondents do provide useful
information on call demand but at a very high level. Line of Business coding and IVR systems provide the topics and timing of taxpayer contacts and at a relatively low cost. However, they lack the ability to provide the detail required to identify the root cause of the contact. A similar outcome was identified for the in-person channel.
The use of caller and frontline agent surveys, databases and CRM systems do provide the type of information that facilitates analysis to determine the root cause of contacts, but these can sometimes be labour-intensive and lack a real-time element, although this is not the reported experience of HMRC in the United Kingdom. It has expanded its agent surveys to classify contacts and initiate the development of action plans to address the cause of the contact and/or develop self-help service options.
Only three of the revenue bodies described the use of voice analytic technology; both are at the early stages of implementation and have yet to gain the necessary experience to determine whether this will be an effective tool for determining root causes of demand.
Summary
As with the in-person channel, many of the respondents are able to identify drivers/ topics of demand with the methodologies and technologies they have in place. Some can also determine the root cause, but many indicate that it is a labour intensive process for them to do so. Only one of the respondents (United States) indicated that they have implemented contact or speech analytics technology and one other (Australia) is in the process of implementing this new technology to assist in determining drivers and the root cause of demand. New Zealand is planning an opportunity analysis pilot to determine the potential costs and benefits of using this technology.
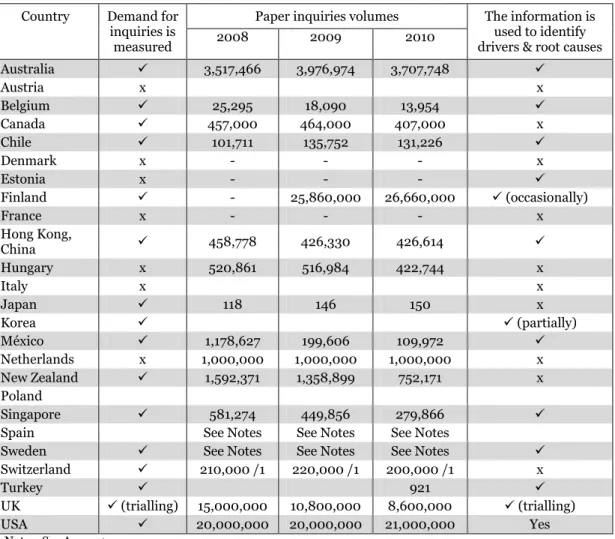
Paper channel
As noted earlier, the contact statistics reported by revenue bodies shows a downward trend in demand in the paper channel—refer Table 8. Some revenue bodies indicated that they do not measure demand on the paper channel given its low volume. Only 16 revenue bodies measure demand and ten revenue bodies identified that they use the information
to identify drivers. An additional three revenue bodies indicated that they use the information occasionally.
Table 8.Measurement and use of paper inquiry demand information Country Demand for
inquiries is measured
Paper inquiries volumes The information is used to identify drivers & root causes
2008 2009 2010 Australia 3,517,466 3,976,974 3,707,748 Austria x x Belgium 25,295 18,090 13,954 Canada 457,000 464,000 407,000 x Chile 101,711 135,752 131,226 Denmark x - - - x Estonia x - - - Finland - 25,860,000 26,660,000 (occasionally) France x - - - x Hong Kong, China 458,778 426,330 426,614 Hungary x 520,861 516,984 422,744 x Italy x x Japan 118 146 150 x Korea (partially) México 1,178,627 199,606 109,972 Netherlands x 1,000,000 1,000,000 1,000,000 x New Zealand 1,592,371 1,358,899 752,171 x Poland Singapore 581,274 449,856 279,866
Spain See Notes See Notes See Notes
Sweden See Notes See Notes See Notes
Switzerland 210,000 /1 220,000 /1 200,000 /1 x
Turkey 921
UK (trialling) 15,000,000 10,800,000 8,600,000 (trialling)
USA 20,000,000 20,000,000 21,000,000 Yes
Notes: See Annex 1.
/1. All data volumes relate to VAT administration only.
Methodologies and technologies for measuring demand
Of the revenue bodies that do measure demand on this channel most are using automation to track and manage correspondence. Examples from survey responses:
Australia: Correspondence is scanned and then distributed by the Siebel system which is used to measure its volumes by the types established.7
Canada: For paper contacts, Tax Services offices record all correspondence received by topic or predetermined category (e.g. registration, waivers etc.). CRA uses a national web based correspondence workload system that captures the category of all correspondence received.
Singapore: Inland Revenue Interactive Network (IRIN) – IRIN is IRAS‘s computerised tax administration system that supports our daily operations. This system allows us to measure and report the number of correspondences received for any specified period. Reports can be generated from IRIN to show the total number of correspondences and the categories of correspondence received.
7Siebel is a commercial-off-the-shelf software product for industry standard functions such as workflow, case management and customer relationship management