University of Kentucky University of Kentucky
UKnowledge
UKnowledge
Theses and Dissertations--Entomology Entomology
2015
Spatial and Temporal Dynamics of Predator-Prey Interactions in
Spatial and Temporal Dynamics of Predator-Prey Interactions in
Winter Wheat
Winter Wheat
Katelyn A. KowlesUniversity of Kentucky, [email protected]
Right click to open a feedback form in a new tab to let us know how this document benefits you. Right click to open a feedback form in a new tab to let us know how this document benefits you.
Recommended Citation Recommended Citation
Kowles, Katelyn A., "Spatial and Temporal Dynamics of Predator-Prey Interactions in Winter Wheat" (2015). Theses and Dissertations--Entomology. 20.
https://uknowledge.uky.edu/entomology_etds/20
This Doctoral Dissertation is brought to you for free and open access by the Entomology at UKnowledge. It has been accepted for inclusion in Theses and Dissertations--Entomology by an authorized administrator of UKnowledge. For more information, please contact [email protected].
STUDENT AGREEMENT: STUDENT AGREEMENT:
I represent that my thesis or dissertation and abstract are my original work. Proper attribution has been given to all outside sources. I understand that I am solely responsible for obtaining any needed copyright permissions. I have obtained needed written permission statement(s) from the owner(s) of each third-party copyrighted matter to be included in my work, allowing electronic distribution (if such use is not permitted by the fair use doctrine) which will be submitted to UKnowledge as Additional File.
I hereby grant to The University of Kentucky and its agents the irrevocable, non-exclusive, and royalty-free license to archive and make accessible my work in whole or in part in all forms of media, now or hereafter known. I agree that the document mentioned above may be made available immediately for worldwide access unless an embargo applies.
I retain all other ownership rights to the copyright of my work. I also retain the right to use in future works (such as articles or books) all or part of my work. I understand that I am free to register the copyright to my work.
REVIEW, APPROVAL AND ACCEPTANCE REVIEW, APPROVAL AND ACCEPTANCE
The document mentioned above has been reviewed and accepted by the student’s advisor, on behalf of the advisory committee, and by the Director of Graduate Studies (DGS), on behalf of the program; we verify that this is the final, approved version of the student’s thesis including all changes required by the advisory committee. The undersigned agree to abide by the statements above.
Katelyn A. Kowles, Student Dr. Kenneth F. Haynes, Major Professor Dr. Charles Fox, Director of Graduate Studies
SPATIAL AND TEMPORAL DYNAMICS OF PREDATOR-PREY INTERACTIONS IN WINTER WHEAT
____________________________________________ DISSERTATION
____________________________________________
A dissertation submitted in partial fulfillment of the requirements for the degree of Doctor of Philosophy in the College of Agriculture, Food, and Environment at the
University of Kentucky
By
Katelyn Ann Kowles Lexington, KY
Director: Dr. Kenneth F. Haynes, Professor of Entomology Lexington, KY
2015
ABSTRACT OF DISSERTATION
SPATIAL AND TEMPORAL DYNAMICS OF PREDATOR-PREY INTERACTIONS IN WINTER WHEAT
Aphids (Hemiptera: Aphididae) are pests of multiple cropping systems, primarily due to the viruses they vector and direct crop damage that is exacerbated by their rapid population growth. In Kentucky, grain aphids (Rhopalosiphum padi and Sitobion avenae) cause significant yield loss to winter wheat as vectors of Barley Yellow Dwarf virus (BYDV), prompting the routine application of insecticides. Coupled with growing human populations and decreasing arable land, it is increasingly evident that biological control services provided by natural enemies represent a viable long-term management option.
Aphids are preyed upon by a diverse array of predators that can be exploited in conservation biological control. I designed a field experiment to monitor dispersal into and out of wheat fields, and how these movements were affected by the surrounding habitat. Analysis revealed there are significant movements of R. padi into the wheat in the fall, and
S. avenae in spring, and that these movements are slowed down by forested edges. Natural, field-bordering weed strips were used as a conservation biological technique to enhance predator populations. Results showed that while weed strips did not affect the yield of the crop, aphid abundance, or BYDV incidence, it did significantly increase the abundance of natural enemies. Dominant predators included Coccinellidae, Anthocoridae, Chrysopidae larvae, and Braconidae.
Using molecular gut-content analysis, I screened multiple species of predators and found strong trophic linkages between aphids and Orius insidiosus and multiple species of coccinellids, namely Coccinella septempunctata and Coleomegilla maculata. In aphidophagous systems, intraguild predation (IGP) can interfere with the biological control potential so I also screened coccinellids for IGP using newly designed primers. To identify intraguild prey DNA in coccinellids, I designed species-specific primers for C. maculata
and C. septempunctata to use in PCR-based molecular gut-content analysis. Results revealed high frequencies of IGP between coccinellids that are significantly higher in weed strip plots. However, I observed no detectable impact on aphid predation during these
increased times of IGP, suggesting it does not interfere with biological control of aphids in this system. I discuss the role of weed strips in winter wheat as part of an integrative pest management strategy.
Key words: aphids, generalist predator, winter wheat, biological control
Katelyn A. Kowles___________ Student’s Signature
October 12, 2015______________ Date
SPATIAL AND TEMPORAL DYNAMICS OF PREDATOR-PREY INTERACTIONS IN WINTER WHEAT
By
Katelyn Ann Kowles
Dr. Kenneth F. Haynes_______ Co-Director of Dissertation Dr. Douglas W. Johnson______ Co-Director of Dissertation Dr. Charles W. Fox__________ Director of Graduate Studies October 12, 2015_____________ Date
iii
ACKNOWLEDGEMENTS
I would like to thank Dr. Douglas W. Johnson and Dr. Kenneth F. Haynes for their support and insight throughout my degree. I would also like to thank my committee member, Dr. David Van Sanford for his helpful comments on my research. I was fortunate enough to conduct my field work at the University of Kentucky Research and Education Center and am grateful to Joe Williams and the farm crew for their constant help and patience.
I owe thanks to Dr. Catherine Tauber at the University of California-Davis for help in identifying green lacewing specimens. I would also like to thank Dr. Richard Harrington at Rothamsted Research for his mentorship.
I am very grateful to all past and present members of the UK Invertebrate Ecology Laboratory for their scientific and moral support. Lastly, I wish to thank my family for their unwavering support during my graduate degree.
iv Table of Contents
Acknowledgements ... iii
List of Tables ...vii
List of Figures ... ix
Chapter 1: Introduction ... 1
Chapter 2 : Semi-natural habitats in the farmscape affect immigration of cereal aphids .... 6
2.1 Abstract... 6 2.2 Introduction ... 7 2.3 Methods ... 10 2.3.1 Field Site ... 10 2.3.2 Virus Incidence ... 11 2.3.2 Statistical Analysis ... 13 2.4 Results ... 14 2.4.1 Seasonal Dynamics... 14 2.4.2 Edge Effects ... 15 2.5 Discussion ... 16
Chapter 3 : Field-bordering weed strips enhance aphidophagous predators in winter wheat ... 24
3.1 Abstract... 24
3.2 Introduction ... 25
3.3 Materials and Methods ... 28
3.3.1 Field Site ... 28
3.3.2 Sampling Effort ... 29
v
3.4 Results ... 33
3.4.1 Pest and Natural Enemy Abundance ... 33
3.4.2 Barley Yellow Dwarf Virus Incidence ... 34
3.4.3 Weed Strips ... 34
3.5 Discussion ... 38
Chapter 4 : Spatial and temporal synchrony between a generalist predator and pest aphid in winter wheat facilitates high predation rates ... 55
4.1 Abstract... 55
4.2 Introduction ... 57
4.3 Materials and Methods ... 61
4.3.1 Field Sampling ... 61
4.3.2 Molecular Detection of Predation ... 61
4.3.3 Statistical Analysis ... 62 4.4 Results ... 64 4.4.1 Seasonal Abundance ... 64 4.4.2 Weed Strips ... 64 4.4.3 Spatial Distribution... 65 4.4.4 Predation ... 66 4.5 Discussion ... 67
Chapter 5 : Habitat manipulation through weed strips promote aphid predation by coccinellids in winter wheat ... 82
5.1 Abstract... 82
5.2 Introduction ... 84
vi
5.3.1 Feeding Trials ... 87
5.3.2 Molecular Detection of Predation ... 88
5.3.3 Statistical Analyses... 88
5.4 Results ... 90
5.4.1 Predator and Pest Abundance ... 90
5.4.2 Molecular Analysis of Predation ... 91
5.5 Discussion ... 93
Chapter 6 : Intraguild predation in a coccinellid community: influence of habitat manipulations ... 107
6.1 Abstract... 107
6.2 Introduction ... 108
6.3 Materials and Methods ... 112
6.3.1 Molecular Detection of Predation ... 112
6.3.2 Statistical Analysis ... 114
6.4 Results ... 115
6.4.1 Molecular Detection of Predation ... 115
6.4.2 Prey Availability ... 116
6.5 Discussion ... 117
Chapter 7 : Summary ... 130
References ... 134
vii
List of Tables
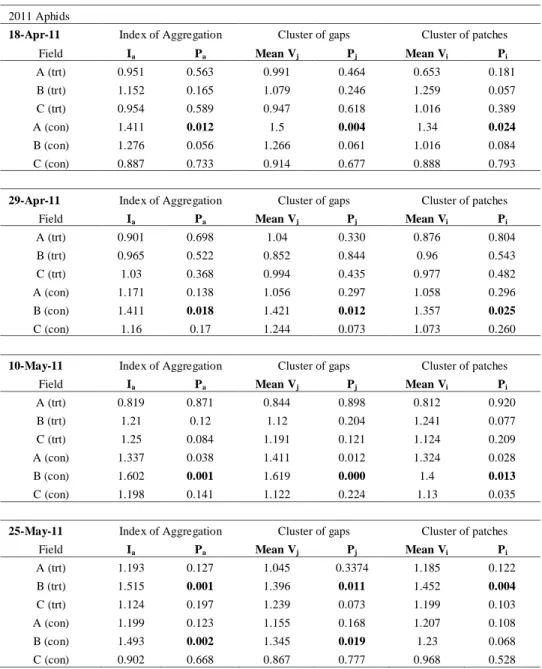
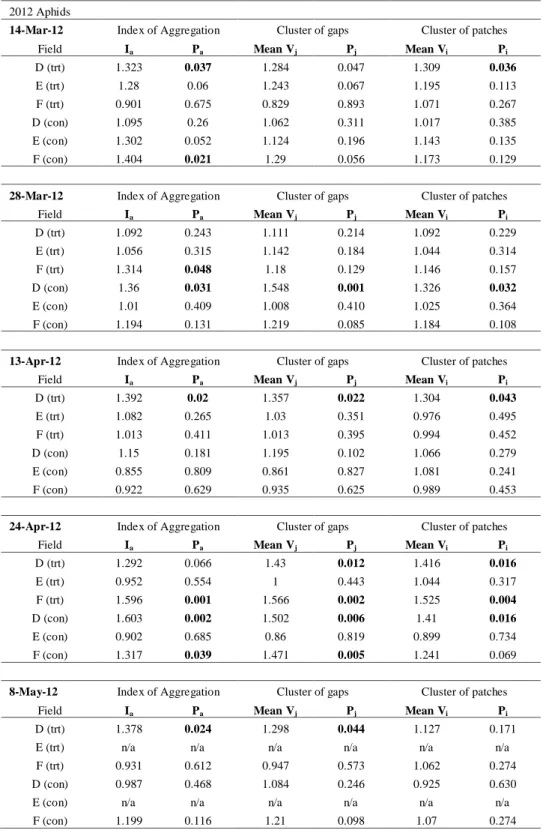
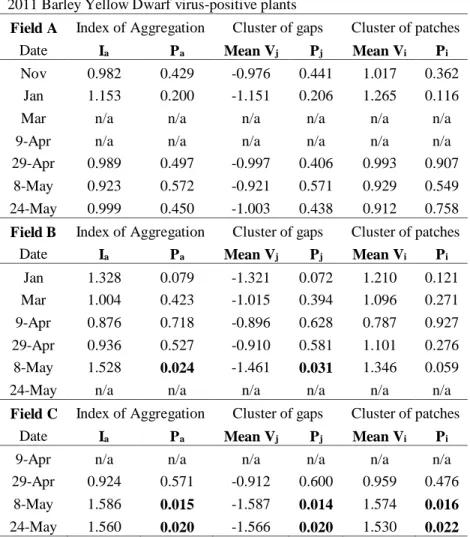
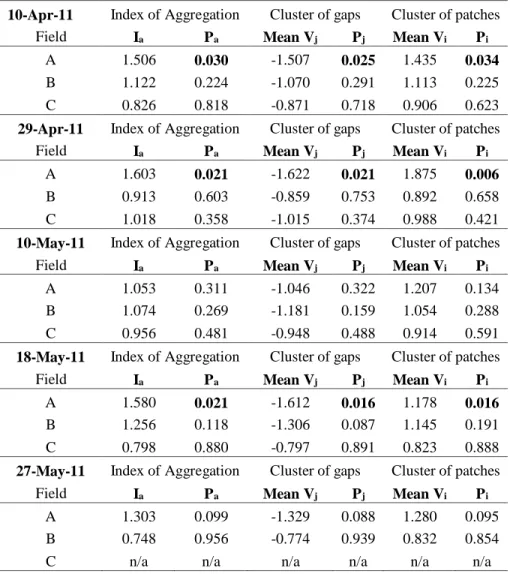
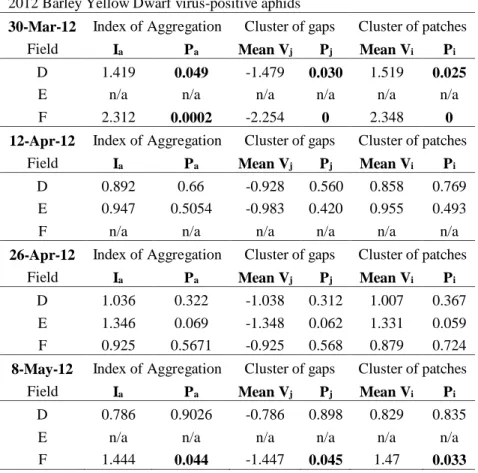
Table 3.1. Index of aggregation, Ia, and mean cluster index, vi for patches and vj for gaps, with associated probability, Px, from randomization test of SADIE, for aphids counted in weed strip and control plots of winter wheat in the 2011 spring season. Bold font denotes where a significant measurable spatial pattern can be detected. ... 41 Table 3.2. Index of aggregation, Ia, and mean cluster index, vi for patches and vj for gaps, with associated probability, Px, from randomization test of SADIE, for aphids counted in weed strip and control plots of winter wheat in the 2012 spring season. Bold font denotes where a significant measurable spatial pattern can be detected. ... 42 Table 3.3. Index of aggregation, Ia, and mean cluster index, vi for patches and vj for gaps, with associated probability, Px, from randomization test of SADIE, for plants testing positive for Barley Yellow Dwarf virus (BYDV) as detected by enzyme-linked immunosorbent assay (ELISA) in the 2011 spring season. Bold font denotes where a significant measurable spatial pattern can be detected; those labeled as ‘n/a’ did not have high enough infection rates to conduct spatial analysis. ... 43 Table 3.4. Index of aggregation, Ia, and mean cluster index, vi for patches and vj for gaps, with associated probability, Px, from randomization test of SADIE, for aphids testing positive for Barley Yellow Dwarf virus as detected by enzyme-linked immunosorbent assay in the 2011 spring season. Bold font denotes where a significant measurable spatial pattern can be detected. ... 44 Table 3.5. Index of aggregation, Ia, and mean cluster index, vi for patches and vj for gaps, with associated probability, Px, from randomization test of SADIE, for aphids testing positive for Barley Yellow Dwarf virus as detected by enzyme-linked immunosorbent assay in the 2012 spring season. Bold font denotes where a significant measurable spatial pattern can be detected. ... 45 Table 4.1. Index of aggregation, Ia, and mean cluster index, vi for patches and vj for gaps, with associated probability, Px, from randomization test of SADIE in winter wheat fields. Data are presented for counts of (a) Orius insidiosus and (b) aphids sampled on 25-May-11 and (c) O. insidiosus and (d) aphids sampled on 26-Apr-2012. Bold font denotes where a measurable spatial pattern can be detected. ... 71 Table 4.2. Index of aggregation, Ia, and mean cluster index, vi for patches and vj for gaps, with associated probability, Px, from randomization test of SADIE, for Orius insidiosus and counted weed strip and control (non-weed strip) plots of winter wheat in (a) 2011 and (b) 2012. Bold font denotes where a significant measurable spatial pattern can be
viii
Table 4.3. Summary of SADIE analyses of local spatial association between Orius insidiosus and aphids. Probability of P < 0.025 denotes significant positive association, and P > 0.975 denotes significant negative dissociation (after Winder et al. 2001). Bold font denotes where a significant measurable spatial pattern can be detected... 73 Table 4.4. Index of aggregation, Ia, and mean cluster index, vi for patches and vj for gaps, with associated probability, Px, from randomization test of SADIE, for Orius insidiosus predation events on Sitobion avenae in winter wheat during the month of May in (a) 2011 and April in (b) 2012. Also shown are corresponding SADIE statistics for aphids for the month of May in (a) 2011 and April in (b) 2012. Bold font denotes where a significant measurable spatial pattern can be detected. ... 74 Table 4.5. Summary of SADIE analyses of local spatial association between Orius insidiosus predation events and aphids. Probability of P < 0.025 denotes significant positive association, and P > 0.975 denotes significant negative dissociation... 75 Table 5.1. Primers utilized for gut content analysis (Chen et al 2000)... 97 Table 5.2. Mean number (± SEM) of coccinellid larvae and adults in (a) 2011 and (2) 2012 and caught in ten figure-eight sweeps. ... 98 Table 5.3. Results of PCR-based molecular gut content analysis showing the proportion of each coccinellid adult and larval species in each field season collected from winter wheat testing positive for each aphid species. ... 100 Table 6.1. Coccinellid primers designed and optimized for molecular got content
analysis... 122 Table 6.2. Results of PCR-based gut-content analysis showing the proportion of each coccinellid adult and larval species testing positive for intraguild and aphid DNA. ... 123
ix
List of Figures
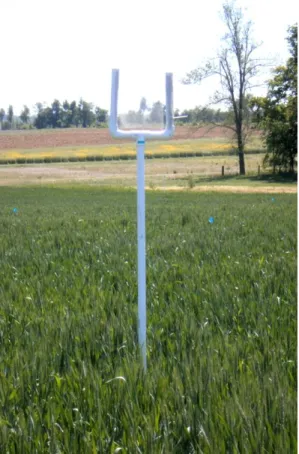
Figure 2.1 Images of the four winter wheat fields used during the 2012-2013 season. Field 1 (a) is 9.42 acres and has two edges with roads and two with grass. Field 2 (b) is 13.5 acres with two edges of forest, one of winter wheat and one of grass. Field 3 (c) is 6.1 acres with winter wheat on two edges, a road on one and a small pond on the last. Field 4 (d) is 11.6 acres and has two edges of forest, one with road and one with grass. Image data: Google 2014. ... 19 Figure 2.2. Aerial aphid trap designed to catch aphids dispersing in and out of winter wheat fields. Traps were made of PVC and aluminum mesh, and sprayed with
Tanglefoot©. Traps were left up in situ for 7 or 14 days, and aphids counted and screened for Barley Yellow Dwarf virus (BYDV). ... 20 Figure 2.3. a. Rhopalosiphum padi (mean ± SEM/24 h) captured on the inside of the field bordered by different edge types (forest, grass, road, water, winter wheat) over the 2012-2013 growing season in winter wheat. b. Rhopalosiphum padi (mean ± SEM/24 h) captured on the outside of the field bordered by different edge types (forest, grass, road, water, winter wheat) over the 2012-2013 growing season in winter wheat. ... 21 Figure 2.4. a. Sitobion avenae (mean ± SEM/24 h) captured on the inside of the field bordered by different edge types (forest, grass, road, water, winter wheat) over the 2012-2013 growing season in winter wheat. b. Sitobion avenae (mean ± SEM/24 h) captured on the outside of the field bordered by different edge types (forest, grass, road, water, winter wheat) over the 2012-2013 growing season in winter wheat. ... 22 Figure 2.5. Mean (± SEM) proportion of aphids, Rhopalosiphum padi and Sitobion avenae, testing positive for Barley Yellow Dwarf virus (BYDV). ... 23 Figure 3.1. Mean (± SEM) number of potential aphid prey captured on mini-sticky traps in a. 2011 and b. 2012. Ground-based traps represent aphids caught over 24 hr, per cm². ... 46 Figure 3.2. Barley Yellow Dwarf virus detected in plants using ELISA over the growing season. ... 47 Figure 3.3. BYDV in aphids detected using ELISA in a. 2011 and b. 2012 ... 48 Figure 3.4. Mean (± SEM) number of aphids in weed strip and control plots per sweep sample, consisting of ten figure-eight sweeps, in winter wheat in a. 2011 and b. 2012 .... 49 Figure 3.5. Mean (± SEM) number of most abundant natural enemies in weed strip plots and control plots per sweep sample, consisting of ten figure-eight sweeps, in winter
x
wheat in 2011: a. coccinellid adults, b. coccinellid larvae, c. chrysopid larvae, d.
parasitoids and in 2012: e. coccinellid adults, f. coccinellid larvae, g. chrysopid larvae, h. parasitoids ... 52 Figure 3.6. End of season wheat yields in control plots and weed strip plots in 2011 (Fields A, B, C) and 2012 (Fields D, E, F) averaged by strip in Bu/acre. ... 53 Figure 3.7. Contour maps of Barley Yellow Dwarf virus in winter wheat fields in (a) November and (b) January in Field B. The key with negative values indicates gaps and positive values indicates a patch. A unit that belongs to a patch is indicated by vi > 1 whereas a gap is indicated by neighboring unit with values of vj<-1. Values of v < -1.5 indicate significantly larger gaps, and values v > 1.5 indicate significantly larger patches. The horizontal and vertical axes represent the coordinate system used for sampling, with each sample unit measuring 188m². ... 54 Figure 4.1. Mean number (± SEM) of Sitobion avenae and Orius insidiosus captured in ten figure-eight sweep net samples in three winter wheat fields in 2011 (a, b, c) and 2012 (d, e, f). ... 77 Figure 4.2. Mean number (± SEM) Orius insidiosus (Hemiptera: Anthocoridae) in 2011 (a) and 2012 (b) caught in ten figure-eight sweeps in winter wheat fields. ... 78 Figure 4.3. Contour maps of clustering in winter wheat fields on 25-May-2011 for (a) aphids and (b) Orius insidiosus. The key with negative values indicates gaps and positive values indicates a patch. A unit that belongs to a patch is indicated by vi > 1 whereas a gap is indicated by neighboring unit with values of vj<-1. Values of v < -1.5 indicate significantly larger gaps, and values v > 1.5 indicate significantly larger patches. The horizontal and vertical axes represent the coordinate system used for sampling, with each sample unit measuring 188m²... 79 Figure 4.4. Contour maps of local spatial association showing positive association
between Orius insidiosus and aphids in winter wheat on 25-May-2011 in (a) Field A and (b) Field C. The key with negative values indicates dissociation and positive values indicate association between Orius insidiosus (red) and aphid species (blue). Areas associated with small negative values show strong dissociation (light-colored areas), and areas associated with large positive values show strong association (dark-colored areas) between insidious flower bugs and aphids. The horizontal and vertical axes represent the coordinate system used for sampling, with each sample unit measuring 188m². ... 80 Figure 4.5. The proportion of field-caught Orius insidiosus testing positive for Sitobion avenae DNA using PCR-based molecular gut content analysis during the (a) 2011 and (b) 2012 field spring seasons. ... 81
xi
Figure 5.1. Mean number (± SEM) of coccinellid adults (all species) in (a) 2011 and (c) 2012 and coccinellid larvae (all species) in (b) 2011 and (d) 2012 caught in ten figure-eight sweeps... 102 Figure 5.2. Mean (± SEM) of prey aphid captured in sweep samples on secondary axis, and proportion of coccinellid predators screening positive for aphid DNA on primary axis. a. Coleomegilla maculata adults and larvae testing positive for Sitobion avenae, with S. avenae populations, b. C. maculata adults and larvae testing positive for
Rhopalosiphumpadi, with R. padi populations, c, Hippodamia convergens adults testing positive for R.padi, with R.padi populations ... 104 Figure 5.3. Detection of DNA of Rhopalosiphum padi following consumption. A.
Coccinella septempunctata adults: detectability half-life = 2.5 h; B. Coleomegilla
maculata adults: detectability half-life = 5 h; C. C. maculata larvae: detectability half-life = 3 h. ... 106 Figure 6.1. Mean number (± SEM) of coccinellid adults in (a) 2011 and (c) 2012 and coccinellid larvae (all species) in (b) 2011 and (d) 2012 caught in ten figure-eight sweeps. The five species represented are Coccinella septempunctata, Coleomegilla maculata,
Cycloneda munda, Harmonia axyridis, and Hippodamia convergens. ... 125 Figure 6.2. Proportion of intraguild predators testing for intraguild prey and pest aphids on primary axis, prey availability of intraguild prey and pest aphids in secondary axis in 2011. a. Coccinella septempunctata adults screening positive for Coleomegilla maculata,
Rhopalosiphum padi, and Sitobion avenae b. C. septempunctata larvae screening positive for C. maculata, R. padi, and S. avenae c. C. maculata adults screening positive for C. septempunctata, R. padi, and S. avenae d. C. maculata larvae screening positive for C. septempunctata, R. padi, and S. avenae. ... 127 Figure 6.3. Proportion of intraguild predators testing for intraguild prey and pest aphids on primary axis, prey availability of intraguild prey and pest aphids in secondary axis in 2012. a. Coccinella septempunctata adults screening positive for Coleomegilla maculata,
Rhopalosiphum padi, and Sitobion avenae b. C. septempunctata larvae screening positive for C. maculata, R. padi, and S. avenae c. C. maculata adults screening positive for C. septempunctata, R. padi, and S. avenae d. C. maculata larvae screening positive for C. septempunctata, R. padi, and S. avenae ... 129
1
Chapter 1: Introduction
Agricultural intensification over the last century, while leading to high yields and increased food production, has also contributed to a range of negative ecological
consequences, including losses in biodiversity, pollution, and erosion (Matson et al. 1997, Foley et al. 2005, Robertson et al. 2014). To maximize the ecosystem services provided by agriculture, we must understand how to sustainably increase crop yields in
agroecosystems (Power 2010). This requires knowledge of how the ecological processes interact in these highly complex agroecosystems (Robertson et al. 2014). Conservation biological control aims to increase one particular ecosystem service, pest regulation, by promoting the impact of natural enemies in the system (Debach and Rosen 1991, Fiedler et al. 2008). This can be done through habitat manipulation, which provides resources such as pollen, nectar (Eubanks and Denno 2000), physical refugia, or alternative prey and hosts (Landis et al. 2005). In addition to providing pest management services, habitat manipulations can also provide other services such as biodiversity conservation, waste water treatment, and weed suppression (Fiedler et al. 2008). On-farm management can have substantial impacts on both the landscape- (Tscharntke et al. 2007a) and the farmscape-level (Collins et al. 2002), promoting invertebrate biodiversity and pest suppression. This dissertation will focus on habitat management at the farmscape-level.
Field margins can be used for promoting natural enemy abundance, particularly in cereal crops (Holland et al. 2008, Dong et al. 2012, Birkhofer et al. 2014). These areas of non-crop habitat can provide more vegetative diversity that will in turn be home to a more diverse group of generalist predators that can aid in pest suppression (Marshall and
2
Moonen 2002, Costamagna and Landis 2011). Generalist predators are good biological control agents because they can help reduce pest populations and thus the damage caused by herbivores in agroecosystems (Oelbermann and Scheu 2009). This is due, in part, to their ability to be the first colonizers of these highly disturbed environments, and survive on alternative prey (Murdoch et al. 1985, Chiverton 1987, Settle et al. 1996, Landis and Van der Werf 1997). In cereal crops, there exists a diverse group of natural enemies, both epigeal and aerial, such as Anthocoridae (Hemiptera), Carabidae (Coleoptera),
Chrysopidae (Neuroptera), Coccinellidae (Coleoptera), Linyphiidae (Araneae) and Staphylinidae (Coleoptera) (Harwood and Obrycki 2005), therefore giving us the opportunity to enhance these predators already in the system.
In the field, direct observation of predator feeding events are difficult to observe due to their size and infrequency, and determining prey remains in the guts of predators is not always accurate, especially when soft-bodied prey are consumed or when the
predators are liquid feeders. Therefore, a variety of molecular tools are helpful in identifying the food web of a system, such as enzyme electrophoresis, polyclonal and monoclonal antibodies, and polymerase chain reaction (PCR) to detect prey DNA (Symondson 2002, Sheppard and Harwood 2005). PCR-based molecular gut-content analysis is now a widely used tool for elucidating food webs in agroecosystems (e.g. Lundgren et al. 2014, Raso et al. 2014, Schmidt et al. 2014, Wallinger et al. 2014) and provides invaluable information about predator diets, intraguild predation, and
cannibalism (Furlong 2015). Utilizing both field and molecular techniques maximizes our chances of teasing apart the ecological interactions in the system, and allows us to
3
This project will use molecular techniques, specifically PCR and enzyme-linked
immunosorbent assay (ELISA), on arthropods in winter wheat. This data will give insight into the winter wheat-aphid-predator food web, as well as examine the spatial and
temporal movement of an aphid-vectored virus, thus allowing us to make more accurate pest management recommendations.
In Kentucky, winter wheat is a valuable crop bringing in over $200 million annually (KYSGGA, 2013) and is an integral part of the state’s unique crop rotation
system. Winter wheat is double-cropped with corn and soybean, which results in higher yields and reduced pest problems. Most of Kentucky farmers practice conservation tillage, leaving at least 30% of the crop residue on the soil when planting (Holland 2004). This process has ecological and economic benefits, such as enhanced erosion control, nutrient cycling, and pest management, while still maintaining high yields (Halvorson et al. 2006, De Vita et al. 2007, Yau et al. 2010). Nonetheless, aphids are a major pest in cereals, mainly due to the staggering numbers they can reach in a season and their role as vectors of plant viruses (Blackman and Eastop 2007).
Two of the most agriculturally important aphid species occur in Kentucky winter wheat, the bird cherry-oat aphid, Rhopalosiphum padi (L.) (Hemiptera: Aphididae), and the English grain aphid, Sitobion avenae (F.) (Hemiptera: Aphididae) (Rochow 1961, Blackman and Eastop 2007). Aphids have evolved host-alternating behaviors that allow them to better exploit plants (Dixon 1971), and will migrate between primary and secondary hosts throughout the year to complete reproduction (Dean 1974). While in many parts of the world R. padi is heteroecious migrating between a primary, woody host, and a secondary, herbaceous host (Dixon 1971, Dean 1974) it has no woody host in
4
Kentucky and will feed on Gramineae. Sitobion avenae is monoecious, spending the entire year on Gramineae (Leather 1993), such as cereals and pasture grasses. In areas with Mediterranean climates, such as Kentucky, both species of aphids are anholocyclic on winter wheat, so that only asexual female clones are produced (Blackman and Eastop 2007).
Rhopalosiphum padi and S. avenae are important vectors of Barley Yellow Dwarf virus (BYDV), causing substantial yield loss worldwide and resulting in routine, and sometimes unnecessary, insecticide applications (Irwin and Thresh 1990, Pike 1990). BYDV was first described as an infection in small grains in California in the 1950’s (D’Arcy and Burnett 1995), however it was not realized until later that there are several strains of the virus and it was most likely a combination of these strains that comprised this initially described infection (Irwin and Thresh 1990, Halbert and Voegtlin 1995). Rochow (1970) characterized five strains of the virus based on its main vector, and they included MAV (S. avenae), RPV (R. padi), RMV (Rhopalosiphum maidis (Fitch)), SGV (Schizaphis graminum (Rondani)), and PAV (R. padi and S. avenae). Each strain of the virus is specifically vectored by particular aphid species (Irwin and Thresh 1990, Halbert and Voegtlin 1995); it relies entirely on aphids for its movement into crop fields and subsequent development of, and development on, plants. Luteoviruses, like BYDV, are transmitted by aphids in a circulative, nonpropagative way, so that once the virus infects its host, it moves through the aphid requiring recognition and transportation, but the virus does not infect or replicate in the aphids (Gray and Gildow 2003).
The circulative manner in which the virus is transported through the aphid from the gut to the hemocoel requires that these parts recognize the specific aphid vector and
5
allow transmission (Irwin and Thresh 1990). The aphid possesses luteovirus receptors on cells from the salivary glands to the gut, however the selectivity of these receptors most likely varies with the location and the strain (Gray and Gildow 2003). The processes of BYDV transmission are divided into four stages; virus transmission from the phloem of the host plant into the aphid, recognition and acquisition of the virus into the aphid gut, movement into the hemocoel, and finally transmission of the virus from the salivary gland of the aphid into a host plant. Once an aphid has acquired the virus, it is infected with BYDV for the remainder of its life and has the potential to infect healthy plants (Gildow et al. 2004).
Routine insecticide use is commonplace in Kentucky for control of aphids and BYDV, although widespread use is not sustainable when coupled with the aphids’ rapid
generation time and unique life cycle (Bass et al. 2014). Recently, pyrethroid resistance was found for the first time in S. avenae in the United Kingdom (Foster et al. 2014) indicating an urgent need to reduce the chemical inputs in cereal crops globally and investigate more sustainable options. Therefore, the objective of this dissertation is to explore conservation biological possibilities in winter wheat in western Kentucky. Specifically, I will examine the role of semi-natural habitats on the dispersal patterns of aphids and BYDV. Additionally, I will look at the effect of natural, field-bordering weed strips on aphids and their natural enemies. Lastly, using molecular gut-content analysis, we will study the aphid food web in relation to the weed strips in an effort to make biological control recommendations in this crop.
6
Chapter 2
: Semi-natural habitats in the farmscape affect immigration
of cereal aphids
2.1 Abstract
Non-crop habitats in agriculture are important in promoting natural enemy abundance and diversity, and thus aid in pest suppression. Agricultural management can alter trophic interactions between predators and their prey, and landscapes with higher proportions of semi-natural habitats may experience lower pest pressure. Therefore, I looked at grain aphid dispersal around the edges of winter wheat fields in western Kentucky with fields consisting of various types of edges: road, forest, grass, water, or winter wheat. Aphids were sampled throughout the growing season (November – June) using aerial sticky traps, and a subset were screened for Barley Yellow Dwarf virus (BYDV) using enzyme-linked immunosorbent assay (ELISA). Rhopalosiphum padi was the predominant aphid species moving into the fields in the fall, and Sitobion avenae in the spring, although in significantly lower numbers. Fields bordered by forests had lower dispersal rates by both aphid species throughout the year. Winter wheat fields adjacent to other winter wheat fields had the highest rate of S. avenae movement, while grass edges had the highest rates of R. padi movement. I did not detect any edge effect on BYDV incidence in aphids. I propose that these differences in dispersal patterns are due to the seasonal differences in these aphid species, as well as natural enemy presence, and discuss this interaction in the context of biological control.
7
2.2 Introduction
Semi-natural habitats can promote natural pest suppression in agricultural systems (Tscharntke et al. 2007a) by contributing to the diversity and abundance of natural
enemies which move into crops and provide biological control (Alhmedi et al. 2009, 2011). However, the global expansion of croplands, and specifically monocultures (Meehan et al. 2011), has led to losses in biodiversity (Foley et al. 2005). Agricultural intensification threatens these natural services, such as predation, pollination, or
parasitism that are enhanced by diverse crop landscapes (Kremen et al. 2002, Krewenka et al. 2011). Within agroecosystems, conservation biological control provides a valuable opportunity to mitigate environmental degradation through habitat modification and enhanced diversification of the environment for the purpose of pest suppression (Debach and Rosen 1991, Landis et al. 2000, Gurr et al. 2004). As a result, the local habitat management scheme determines the abundance and diversity of biological control agents (Koh and Holland 2015) and it is becoming increasingly evident that the community of natural enemies in an agroecosystem is an important part of achieving this goal of pest suppression (Crowder et al. 2010)
In cereals, aphids (Hemiptera: Aphididae) are global pests as vectors of 28% of the world’s known plant viruses (Hogenhout et al. 2008) and vector Barley Yellow Dwarf
virus (BYDV), causing approximately 17% yield loss in non-outbreak years (Plumb 2002). In Kentucky winter wheat, the most damaging and important vectors are the bird cherry-oat aphid, Rhopalosiphum padi (L.) (Hemiptera: Aphididae) and the English grain aphid, Sitobion avenae (F.) (Hemiptera: Aphididae) (Rochow 1961, 1969). Cereal aphid
8
populations fluctuate seasonally, forming a ‘multispecies complex’ (Vickerman and Wratten 1979, Brabec et al. 2014) of different aphid species on a crop. Aphids have evolved various types of life cycles such as host-alternating that allows them to better exploit plants (Dixon 1971). While in many parts of the world R. padi is heteroecious migrating between a primary, woody host, and a secondary, herbaceous host (Dixon 1971, Dean 1974) it has no woody host in Kentucky and will feed on Gramineae.
Sitobion avenae is monoecious, spending the entire year on Gramineae (Leather 1993), such as cereals and pasture grasses. In areas with Mediterranean climates, such as Kentucky, both species of aphids are anholocyclic on winter wheat, so that only asexual female clones are produced (Blackman and Eastop 2007). In addition to parthenogenesis, aphids also have short generation times and telescoping generations (Kindlmann and Dixon 1989), traits which contribute to their complex lifestyle and ability to reach large populations quickly. Pyrethroid insecticides are routinely used to control for aphid pests, however coupled with widespread use and recent resistance shown in Europe, these practices are no longer sustainable (Bass et al. 2014). Additionally, such intensively managed crops and simple landscapes may lead to higher populations of aphids
(Birkhofer et al. 2008, Diel et al. 2013), therefore agricultural management is important in controlling these pests.
Fortunately, a diverse group of natural enemies preys on aphids in cereals (Harwood and Obrycki 2005) and plays an important role in suppressing aphid
populations (Schmidt et al. 2003). These include foliar-foraging Coccinellidae adults and larvae, Syrphidae larvae, Chrysopidae larvae (Wratten and Powell 1991, Schmidt et al. 2003), ground-dwelling spiders (Araneae), ground beetles (Carabidae), and rove beetles
9
(Staphylinidae), as well as a variety of parasitoids (Symondson et al. 2002, Schmidt et al. 2003). The local landscape composition heavily influences the abundances of these predators and parasitoids, such as hoverflies, ladybeetles, and carabids, which are all increased by semi-natural habitats (Tscharntke et al. 2005, Roume et al. 2011, Alignier et al. 2014). Additionally, reduced management intensity and increased vegetation
complexity help to conserve web-building spiders, which contribute significantly to aphid biological control (Nyffler and Sunderland 2003, Diel et al. 2013). The movement of these mobile predators between crop and non-crop habitats during their lifetime can aid in pest suppression (Wratten et al. 2003, Werling and Gratton 2010), however ecosystem services can be influenced at multiple scales depending on the mobility of the predators (Tscharntke et al. 2005, Werling and Gratton 2010). There is also evidence that more complex agroecosystems increase both natural enemy populations and pest populations but only sometimes resulting in less damage by pests (Van Emden 1990, Marino and Landis 1996, Thies et al. 2005) so understanding these dispersal processes is important to maximizing biological control potential.
Given these management issues with cereal aphids, this project sought to study the dispersal patterns of aphids relating to local landscape (hereafter referred to as farmscape) characteristics. I predict that semi-natural habitats, such as forests, will slow aphid dispersal, while adjacent crops such as winter wheat and fescue will increase R. padi and S. avenae movement.
10
2.3 Methods
2.3.1 Field Site
Aphid movement was monitored in conventionally managed winter wheat fields during the 2012-2013 field season at the University of Kentucky Research and Education Center (UK-REC) in Princeton, Kentucky, USA (GPS coordinates 37.1 N, 87.9 W). Soft red winter wheat (Triticum aestivum L.) (Pembroke variety, 2012, Clements Ag Supply, Springfield, Kentucky, USA) was planted in October 2012 in accordance with standard agronomic practices for the region using a John Deere 1590 Planter (Deere & Company, Moline, Illinois, USA) (planting rate: 3.15 seed/m² in 0.191 m rows). Nitrogen was applied twice, at 18.14 kg/acre on the first application (February 2013) and 36.29 kg/acre on the second application (March 2013). Aphid monitoring commenced two weeks after planting at winter wheat emergence (Feekes scale 1-2) and continued throughout the growing season, until two weeks prior to harvest on 21 June 2013. Four fields were selected (Fig. 2.1), each containing eight or ten individual aphid traps, dependent on field size (trap description below). All fields were at least 1 km apart to avoid spatial
autocorrelation between replicates.
2.3.1.1 Aphid Sampling
Aerial aphid traps (Fig. 2.2) were placed around each field and designed to intercept some flying and wind-dispersed aphids. Metal fence posts (1.2 m tall) were fixed in the ground to support a PVC pipe (diameter: 0.03m, height: 2 m) on which removable, double-sided sticky traps were placed (0.3m x 0.3m). Vertical positioning of
11
the traps was selected to intercept aphids given their movement typically occurs between 0 and 3 m (e.g. Johnson 1957; Taylor 1974). Traps were made with aluminum insect screening (0.3 m x 0.3 m; mesh size: 1 cm x 1 cm) (Phifer Incorporated, Tuscaloosa, Alabama, USA), pulled taught and sprayed with Tangle-Trap© Sticky Coating spray (The Tanglefoot Company, Grand Rapids, Michigan, USA). Each trap was placed inside the field, 1 m from the edge and approximately 50 m from adjacent traps. These were collected weekly between November 6 and December 19, and again from March 4 through June 4. During the winter (Jan 3, Jan 18, Jan 31) traps were collected every two weeks and no sampling was undertaken in February due to adverse weather conditions. Traps were left in situ for the duration of the sample period (7 or 14 days) after which they were removed and transferred to the freezer for subsequent counting and virus analysis (described below). Reduced sampling was undertaken during the winter because both aphid activity and virus incidence are significantly lower within the region (K.A. Kowles, pers. obs.).
2.3.2 Virus Incidence
A random subset of alate aphids intercepted by the traps was removed, identified, and individually placed in 1.5 µL microcentrifuge tubes. Only aphids from the outside of traps were used (N=5 per trap per sample period) unless aphids were too scarce during that time. Triple-antibody sandwich Enzyme-linked Immunosorbent Assay (ELISA) was used to screen for the presence or absence of BYDV using Barley Yellow Dwarf virus-PAV kits (Agdia Incorporated, Elkhart, Indiana, USA). Humid boxes were made to create environmental conditions conducive to ELISA. Each humid box consisted of a plastic
12
Tupperware® box (L 20.3 cm x W 15.9 cm x H 9.6 cm) (Tupperware Corporation, Orlando, Florida, USA) with a wet paper towel; all incubation steps were conducted in the humid box. Between each step, all liquid in the microtiter plate was ejected and the plate was washed with Phosphate Buffered Saline solution with Tween ® (polysorbate 20 sorbitan monolaurate (PBST, ACC0011, Agdia) to remove excess material without disrupting the antigen/antibody binding process. Individual 96-well microtiter plates were coated with anti-BYDV-PAV capture antibody (CAB 27500, Agdia) and placed inside the humid box; following this step, plates were washed three times, and for all subsequent steps plates were washed eight times. The aphids were diluted with general extraction buffer (ACC 00111, Agdia) and homogenized using sterilized pellet pestles (Kimble-Chase Kontes™, Rockwood, Tennessee, USA); 100 µL of each homogenized sample was added to two wells on the microtiter plate. In addition, positive (LPC 27500, Agdia) and negative (LNC 27500, Agdia) controls were added to each plate. The sample was incubated overnight at room temperature, after which 100 µL of detection antibody (SRA27500, Agdia) and enzyme conjugate (ECA 27500, Agdia) were added. After two h incubation, the plate was washed and 100 µL of purinenucleosidephosphorylase (PNP) buffer and PNP tablets (ACC0011, Agdia) were added. This final step was conducted in the humid box and placed in the dark for 1 h to allow the color reaction to develop. Finally, the absorbance was read at 405 nm using a Thermo Labsystems Multiskan Plus © spectrophotometer (Fisher Scientific Company LLC, Pittsburgh, Pennsylvania, USA). The average of the two readings were taken for each sample; a sample was considered positive for BYDV if it was greater than three standard deviations above the average of
13 the negative controls (after Frey et al. 1998).
2.3.2 Statistical Analysis
Number of aphids collected per 24 h was calculated by dividing the number caught on each trap by the duration of the trapping period in days. I used a repeated measures multivariate analysis of variance (PROC GLM in SAS 9.3) with a Poisson distribution to examine the effect of edge type on species and aphid number captured by the traps. Regression analysis was conducted with mean temperatures for the sample period and each species of aphids moving in and out of the fields. To examine the seasonal effects of BYDV, aphids were grouped by month for analysis and virus incidence was measured by the proportion of aphids testing positive for BYDV and arcsine square root transformed.
14
2.4 Results
2.4.1 Seasonal Dynamics
A total of 5,629 aphids were intercepted across all traps over the growing season, with significantly more aphids immigrating into (N = 3,172) versus emigrating out of (N = 2,432) (F1,1220 = 25.97, P < 0.0001) winter wheat fields. There were significantly more total R. padi (N = 4,494) than total S. avenae (N = 1,135) (F1,1220 = 239.36, P < 0.0001).
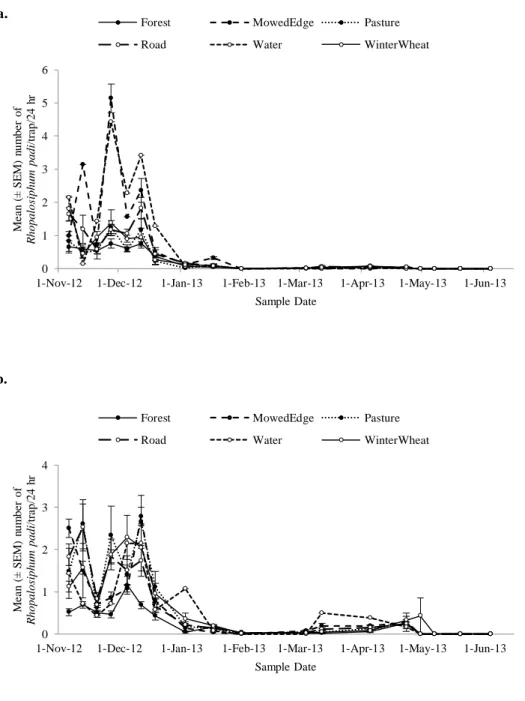
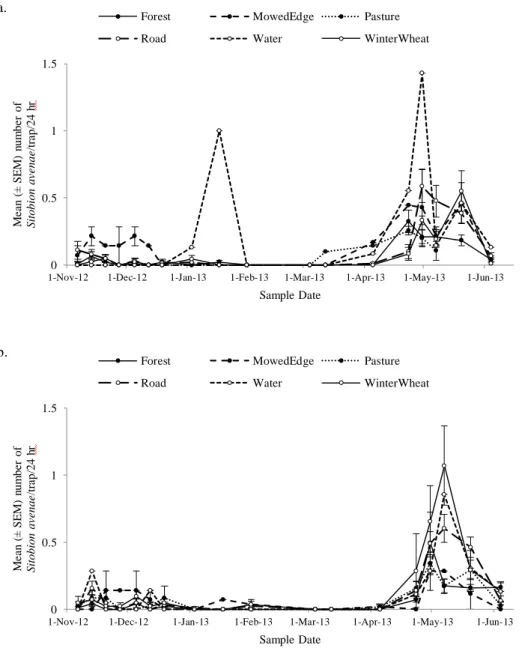
There was significant temporal variation in the movement of both species of aphids (F3,2520 = 453.7, P < 0.0001); R. padi immigration (F6,2533 = 379.37, P < 0.0001) and emigration (F6,2533 = 325.03, P < 0.0001) rates peaked in November and December (Fig. 2.3a, b) and S. avenae immigration (F6,2533 = 121.42, P < 0.0001) and emigration (F6,2533 = 199.99, P < 0.0001) rates peaked in April and May (Fig. 2.4a, b).
Temperature data was collected using Kentucky Mesonet monitoring stations, with temperatures ranging from a low of 7.1 °C in February to a high of 25.3 °C in June. The mean number of R. padi moving into or out of fields was not significantly related to the temperature over the growing season (immigrating: F1,16 = 1.06, P = 0.372, R² = 0.004; emigrating: F1,16 = 1.87, P = 0.191, R² = 0.049). Conversely, S. avenae captured on traps was significantly correlated with temperature, with increased movement in the spring as the temperatures rose (immigrating: F1,16 = 11.55, P = 0.004, R² = 0.383; emigrating: F1,16 = 16.13, P = 0.001, R² = 0.471).
BYDV infection in the total aphid population ranged from 5% in March 2013 to 21% in January, but infection rates did not differ significantly between R. padi and S. avenae (F1,536 = 2.24, P = 0.135). There were no effects of edge type on viral rate (F4,536 =
15
0.54, P = 0.708), but there was significant temporal variation (F6,536 = 2.84, P = 0.01) (Fig. 2.5) with BYDV incidence peaking in January for S.avenae and R. padi.
2.4.2 Edge Effects
There were five different edge types (Fig. 2.1) and those had a significant effect on both aphid species’ movement (F4,2523 = 23.94, P < 0.0001) with significant effects of
date (F17,2523 = 250.24, P < 0.0001) and field (F3,2522 = 39.14, P < 0.0001), as well as interactions with date and field (F9,7569 = 6.02, P < 0.0001) and date and edge (F12,7569 = 17.87, P < 0.0001). Forested edges had the lowest rates of movement for R. padi moving into and out of the fields, while edges bordered with grasses had the highest rates.
Conversely, fields bordered by winter wheat had the highest rates of S. avenae movement on the outside of fields, and those bordered by grass had the lowest rates.
16
2.5 Discussion
This study showed that cereal aphids, Rhopalosiphum padi and Sitobion avenae, colonize winter wheat at distinct times over the season and this movement is significantly affected by the local farmscape. Using aerial aphid traps, I found lower rates of aphid movement in fields bordered by forests compared to those bordered by winter wheat, which had the highest rates of aphid movement. Additionally, winter wheat fields bordered by grasses affected R. padi and S. avenae differently; it increased R. padi
movement while decreasing S. avenae movement.
My results on BYDV incidence in Kentucky winter wheat are consistent with other North American studies on aphid vectors indicating rates in non-outbreak years between 0 - 17% (Halbert and Voegtlin 1995, Plumb 2002). Infection rates of aphids in the 2012-2013 growing season in western Kentucky ranged from 5-21% (Fig. 2.5).
Rhopalosiphum. padi is widely considered the most important BYDV vector because of its numbers and vectoring ability (Halbert and Pike 1985), but I did not detect any difference in BYDV incidence between R. padi and S. avenae, although there were significantly more R. padi overall, which had populations peaking in the fall. While I did not detect any edge effects on virulence, the significantly lower dispersal rates of R. padi
along forested edges is still crucial for BYDV management. The greatest yield losses are from winter wheat infected at early growth stages and this primary infection is
determined by the number of migrating aphids, the proportion infected, and the length of time the crop is susceptible (Tatchell et al. 1988). Therefore, if we can reduce one of these variables, it can make a substantial impact on yield loss caused by BYDV.
17
This study found no measurable relationship between R. padi movement and temperature, however there was a significant relationship with S. avenae. The lack of a consistent pattern between the two species is not surprising; significant correlations have been found between aphids and temperature, but interactions between aphid species, host plants and natural enemies complicate these relationships (Dewar and Carter 1984). In the case of R. padi, this particular species has a very strong ‘migratory urge’ and will initiate take off even in adverse weather conditions (Walters and Dixon 1983).
Edge had a significant effect on the dispersal rates of aphids, and it differed between species. While winter wheat fields bordered with forests had the lowest rates of aphid movement of both aphid species studied, the highest rates for R. padi were fields bordered with grasses and for S. avenae fields adjacent to other winter wheat fields. These differences may be due to the host-alternating behavior of these aphids; R. padi
may be moving from drying summer grasses and moving into the winter wheat, which accounts for the high dispersal rate, while S. avenae is moving between winter wheat fields. Forests, on the other hand, may act as a physical barrier to dispersal, especially since aphids are not good fliers (Dixon 1985). My results agree with those of Alignier et al. 2014 who found wooded areas were negatively correlated with aphid populations, and positively correlated with increased aphid predators. While I did not measure natural enemy movement in this study, they may have contributed to the lower rate of aphids on forested edges, specifically coccinellids (Gardiner et al. 2009b, Woltz and Landis 2014). The area between forests and agricultural crops are highly traveled by arthropods, and as a result are highly affected by edges (Fahrig 2003). Mobile predators can move through multiple crops within their lifetime (Wratten et al. 2003), therefore edge effects can
18
benefit the crop through aiding in the dispersal of predatory arthropods (Roume et al. 2011).
Complex landscapes, those with a higher percentage of wooded areas and hedgerows, have significantly higher rates of parasitism on pest insects (Marino and Landis 1996), but in some cases also higher rates of aphid colonization (Thies et al. 2005). This may be due to the increased number of trees available for host-alternating aphids, which is true in Europe but not here in Kentucky (Roschewitz et al. 2005). Therefore, these unique aspects of each cropping systems must be studied on an individual level, especially since the spatial arrangement of crops and their adjacent border habitats play an important role in the population dynamics of pest species (Kennedy and Storer 2000, Fievet et al. 2007). This study shows that semi-natural habitats can help reduce aphid dispersal into winter wheat fields through a variety of mechanisms that most likely involve the local landscape and natural enemies, and further studies of these mechanisms could help to maximize the biological control potential.
19
Figure 2.1 Images of the four winter wheat fields used during the 2012-2013 season. Field 1 (a) is 9.42 acres and has two edges with roads and two with grass. Field 2 (b) is 13.5 acres with two edges of forest, one of winter wheat and one of grass. Field 3 (c) is 6.1 acres with winter wheat on two edges, a road on one and a small pond on the last. Field 4 (d) is 11.6 acres and has two edges of forest, one with road and one with grass. Image data: Google 2014.
a.
c.
20
Figure 2.2. Aerial aphid trap designed to catch aphids dispersing in and out of winter wheat fields. Traps were made of PVC and aluminum mesh, and sprayed with
Tanglefoot©. Traps were left up in situ for 7 or 14 days, and aphids counted and screened for Barley Yellow Dwarf virus (BYDV).
21
Figure 2.3. a. Rhopalosiphum padi (mean ± SEM/24 h) captured on the inside of the field bordered by different edge types (forest, grass, road, water, winter wheat) over the 2012-2013 growing season in winter wheat. b. R. padi (mean ± SEM/24 h) captured on the outside of the field bordered by different edge types (forest, grass, road, water, winter wheat) over the 2012-2013 growing season in winter wheat.
0 1 2 3 4 5 6
1-Nov-12 1-Dec-12 1-Jan-13 1-Feb-13 1-Mar-13 1-Apr-13 1-May-13 1-Jun-13
M e a n ( ± S E M ) n um be r of R hopal os iphum padi /t ra p/ 24 h r Sample Date a.
Forest MowedEdge Pasture
Road Water WinterWheat
0 1 2 3 4
1-Nov-12 1-Dec-12 1-Jan-13 1-Feb-13 1-Mar-13 1-Apr-13 1-May-13 1-Jun-13
M e a n ( ± S E M ) n um be r of R hopal os iphum padi /t ra p/ 24 h r Sample Date b.
Forest MowedEdge Pasture
22
Figure 2.4. a. Sitobion avenae (mean ± SEM/24 h) captured on the inside of the field bordered by different edge types (forest, grass, road, water, winter wheat) over the 2012-2013 growing season in winter wheat. b. S. avenae (mean ± SEM/24 h) captured on the outside of the field bordered by different edge types (forest, grass, road, water, winter wheat) over the 2012-2013 growing season in winter wheat.
0 0.5 1 1.5
1-Nov-12 1-Dec-12 1-Jan-13 1-Feb-13 1-Mar-13 1-Apr-13 1-May-13 1-Jun-13
M e a n ( ± S E M ) n um be r of Si tobi on av e nae /t ra p/ 24 hr Sample Date a.
Forest MowedEdge Pasture
Road Water WinterWheat
0 0.5 1 1.5
1-Nov-12 1-Dec-12 1-Jan-13 1-Feb-13 1-Mar-13 1-Apr-13 1-May-13 1-Jun-13
M e a n ( ± S E M ) n um be r of Si tobi on av e nae /t ra p/ 24 hr Sample Date b.
Forest MowedEdge Pasture
23
Figure 2.5. Mean (± SEM) proportion of aphids, Rhopalosiphum padi and Sitobion avenae, testing positive for Barley Yellow Dwarf virus (BYDV).
0 0.05 0.1 0.15 0.2 0.25
Nov Dec Jan Mar Apr May Jun
M e a n pr opor ti on ( ± S E M ) a ph ids t e st in g pos it ive f or B a rl e y Y e ll ow D w a rf vi rus Sample Month
24
Chapter 3
: Field-bordering weed strips enhance aphidophagous
predators in winter wheat
3.1 Abstract
Natural enemies in agroecosystems provide valuable ecosystem services through pest regulation, and their populations can be enhanced through conservation biological control and habitat manipulations. Field margins in cereal crops have been studied extensively for aphid control, in an attempt to reduce yield loss by these plant virus vectors. In Kentucky winter wheat, aphids vector Barley Yellow Dwarf virus (BYDV) and cause substantial yield loss. Therefore, I set out to test the effects of natural, field-bordering weed strips on natural enemy and pest populations in wheat, as well as BYDV incidence in pests and plants. The experiment was conducted over two growing seasons in 2010-2011 and 2011-2012 in replicated fields, using natural weeds. Aphid populations or BYDV incidence were not different between treatments, but fields with weed strips had significantly higher natural enemy populations, specifically Anthocoridae,
Braconidae, Coccinellidae, and Chrysopidae. These results suggest that aphids and their natural enemies respond differently to habitat manipulations, and increased natural enemy abundance does not directly lead to increased pest control.
25
3.2 Introduction
Agricultural biodiversity can lead to increased pest suppression by natural enemies (e.g. Altieri 1999, Gurr et al. 2003). However, intensification of agricultural practices has led to losses in biodiversity (Foley et al. 2005, Bianchi et al. 2006) that can negatively impact natural pest control. Natural pest control has environmental benefits such as reduced chemical inputs and landscape conservation (Bianchi et al. 2006). Consequently, conservation biological control, the manipulation of the environment to enhance natural enemies for pest suppression, is crucial as we seek to combat these losses (Debach and Rosen 1991). These naturally occurring enemies provide a valuable
ecosystem service by contributing to pest suppression (Losey and Vaughan 2006) and we can further increase their role through habitat manipulation (Landis et al. 2000, Gurr et al. 2004) by providing alternative resources such as nectar and pollen (Eubanks and Denno 2000), refugia, and alternative prey or hosts (Landis et al. 2005).
The landscape surrounding agricultural fields can directly influence the
abundance and diversity of natural enemies in the crop (Schmidt and Tscharntke 2005, Tscharntke et al. 2005, Alignier et al. 2014). There is evidence that crop pests are controlled by natural enemies that live in the crop year-round, or migrate between the crop and non-crop areas (Holland et al. 2012) as they utilize resources in both habitats (Rusch et al. 2010). Therefore, the type of non-crop habitat can influence the natural enemy population and biological control services provided at both the landscape level (Tscharntke et al. 2007b), as many natural enemies can disperse long distances, and local level (Collins et al. 2002, Meek et al. 2002, Sarthou et al. 2014). Specifically, field
26
margins can provide an increased level of vegetative diversity that can be home to a more abundant (Holland et al. 2008, Dong et al. 2012), diverse assemblage of predators
(Marshall and Moonen 2002, Birkhofer et al. 2014) which can then provide top-down control of insect pests (Costamagna and Landis 2011). Farm management programs that promote the use of unsown field margins can successfully contribute to conservation biological control (Holland et al. 2008, Birkhofer et al. 2014).
Generalist predators (Symondson et al. 2002) can reduce pest populations in agroecosystems, in part due to their ability to survive in highly disturbed environments and on alternative prey (Murdoch et al. 1985, Chiverton 1987, Landis and Van der Werf 1997). In cereal crops, there exists a diverse group of natural enemies, both epigeal and aerial, that routinely feed on pest aphids such as Anthocoridae (Hemiptera), Carabidae (Coleoptera), Chrysopidae (Neuroptera), Coccinellidae (Coleoptera), Linyphiidae (Araneae) and Staphylinidae (Coleoptera) (Harwood and Obrycki 2005). The most effective biological control may be achieved by a diversity of natural enemy guilds so that pests are attacked throughout their lifetime (Holland et al. 2008). The composition of these guilds is determined by a variety of factors, such as the management of the crop and the type and proportion of crop and non-crop habitats (Thies and Tscharntke 1999).
In grain crops, cereal aphids (Hemiptera: Aphididae) vector Barley Yellow Dwarf virus (BYDV) in a circulative, persistent manner. Once the virus is acquired, an aphid will be infected for life (Irwin and Thresh 1990). While over twenty species of aphids are capable of vectoring BYDV (Halbert and Voegtlin 1995), two of the most crucial species are the bird cherry-oat aphid, Rhopalosiphum padi (L.) (Hemiptera: Aphididae) and the English grain aphid, Sitobion avenae (F.) (Hemiptera: Aphididae) (Rochow 1969, Plumb
27
2002). Aphids are capable of exponential growth (Blackman and Eastop 2007) which results in large, within-field aggregations with a strong but ephemeral spatial pattern (Winder et al. 1999, 2001, 2005). Given the spatial heterogeneity of aphids within a crop and its relationship to economic loss, understanding this spatial pattern could improve biological control possibilities (Winder et al. 1999). Additionally, the spread of aphid-vectored viruses and natural enemies are correlated through complex multi-trophic interactions (Garzon et al. 2015). Predation may help slow the spread of these viruses (Moore et al. 2010) so manipulations that focus on predator enhancement may contribute to overall biological control.
Two years of extensive field work were conducted in Kentucky winter wheat to evaluate the effectiveness of natural, field-bordering weed strips that can be used as a no-input, no-cost habitat manipulation to increase natural enemy abundance. I focused on foliar natural enemies, which constitute the key naturally occurring predators and parasitoids of cereal aphids (Ramsden et al. 2015), and epigeal spiders in the family Linyphiidae which capture cereal aphids in their webs and prey on them (Sunderland et al. 1986, Harwood et al. 2001b). I also wanted to examine the spatio-temporal
relationship between aphid vectors and BYDV, and how virus incidence may be affected by natural field boundaries. My hypothesis is that weed strips will help increase the abundance of aphid natural enemies, which will consequently have a larger pest suppression effect and will contribute to the overall yield of the wheat.
28
3.3 Materials and Methods
3.3.1 Field Site
Fields of soft red winter wheat, Triticum aestivum L. (Pembroke variety, 2010, Clements Ag Supply, Springfield, Kentucky, USA), were grown during the 2010-2011 and 2011-2012 seasons at the University of Kentucky Research and Education Center (UK-REC) in Princeton, Kentucky, USA (GPS coordinates 37.1 N, 87.9 W). Four fields (125 m x 55 m) were planted each year, on October 13, 2010 and October 18, 2011, in accordance with standard agronomic practices for the region (planting rate: 3.15 seed/m² in 0.191 m rows) using a John Deere 1590 Planter (Deere & Company, Moline, Illinois, USA). No insecticides, herbicides, or fungicides were applied to any of the fields. Nitrogen was applied twice, at 18.14 kg/acre on the first application (February 21, 2011 and February 20, 2012) and 36.29 kg/acre on the second application (March 7, 2011 and March 5, 2012).
3.3.1.1 Wheat Harvesting
At the end of the growing season, wheat fields were harvested on June 20, 2011 and June 8, 2012 using a Wintersteiger combine with a 1.52 m header (Wintersteiger AG, Ried, Austria). In 2011, due to an equipment malfunction, half of the fields were
harvested with a John Deer 4425 combine with a 4.57 m header (Deere & Company, Moline, Illinois, USA). Grain was weighed using a Parker weigh cart (Model 1500R, Parker Industries, Jefferson, Iowa, USA) and a Avery Tronix scale (Avery Weigh-Tronix LLC, Fairmont, Minnesota, USA).
29
3.3.1.2 Weed Strips
To assess the effects of bordering weed strips on natural enemies and pest control, each field was divided into two treatments, a control plot (unmanipulated) and a weed strip plot. The treatments were separated by a 15 m winter wheat buffer in the center of the field. Weed strips were created by leaving a 3 m strip of uncultivated soil around the field edge to allow for natural weed growth. Each field was further surrounded by a winter wheat buffer zone to avoid edge effects.
3.3.2 Sampling Effort
Within each field, a grid system was established, creating 32 equally-sized subplots measuring 13.75 m x 13.75 m. Each subplot was sampled approximately every two weeks during the spring (March-June) for aphids and predators. Ten figure-eight sweeps were conducted in each plot, and samples were transferred into whirl-pack bags filled with alcohol and returned to the laboratory for subsequent identification. In parallel, foliar predators were hand-collected from the field and stored individually in 1.5µL microcentrifuge tubes containing 95% ethanol and transferred to a -20°C freezer until DNA extraction (see Chapter 4). Ground-dwelling spiders were collected from sheet webs using an aspirator and similarly prepared for DNA extraction.
3.3.2.1 Sticky Traps
Mini-sticky traps were used to monitor spider prey availability and quantify aphid falling rates. Traps (7.5 cm², 1.5 cm x 5 cm, 2 mm thick) consisted of plastic painted with
30
brown acrylic paint to minimize any visual stimulus on the ground (after Harwood et al. 2001, 2003). Each trap was covered with an acetate sheet coated with Tangle-Trap© Sticky Coating spray (The Tanglefoot Company, Grand Rapids, Michigan, USA). Traps were placed at random within each plot and left in situ for 24 h, before the acetate sheet was removed and returned to the laboratory for identification.
3.3.2.2 BYDV Sampling
Aphids and plants were also collected during each sample period, from each plot within all fields, to screen for Barley Yellow Dwarf virus. Ten individual aphids were hand collected using an aspirator from each plot, stored individually in 1.5µL
microcentrifuge tubes and kept at -20°C until screening. Ten plant samples were hand collected and stored in sample bags at -20°C until screening. Enzyme-linked
immunosorbent assay (ELISA) methods were used to assess BYDV incidence in plants and aphids as described in Chapter 2.
3.3.3 Statistical Analysis
During the 2010-2011 field season, major flooding in one of the fields during spring 2011 affected the abundance and subsequent distribution of arthropods and this field was therefore excluded from statistical analyses. Additionally, during the 2011-2012 field season an equipment malfunction in the planter reduced sampling replication to three fields. Therefore, for each field season, three fields were used in the analyses and are henceforth categorized as Fields A-C (2011) and Fields D-F (2012). Prior to yield analysis, grain weights were corrected for moisture and converted to bushels/acre. An
31
analysis of variance (ANOVA) was used to examine the effect of treatment on winter wheat yield.
To examine the effect of treatment (weed strips) on aphid abundance, counts of aphids from sweep samples were used and analyzed with a repeated measures mixed model analysis of variance (PROC MIXED in SAS 9.3) assuming a Poisson distribution with field as a random effect. The effect of treatment on natural enemy abundance was analyzed using a repeated measures multivariate analysis of variance (PROC GLM) assuming a Poisson distribution. Virus incidence was measured by the proportion of aphids or plants testing positive for BYDV and square root arcsine transformed before any analyses. Plants were grouped by month to examine the seasonal effects of the virus. A repeated measured mixed model assuming a binary distribution was used to analyze the effect of treatment on virus incidence in plants and aphids.
3.3.3.1 Spatial Analysis
Spatial Analysis by Distance IndicEs (SADIE) (Perry and Hewitt 1991, Perry 1995, Perry et al. 1999) was used to examine the spatial and temporal patterns of aphid and natural enemy populations in the field (SADIEshell version 1.22). Analyses were conducted for each field and each sampling date. SADIE employs a grid system and count data to quantify the distance, D, needed for the organisms to reach either a uniform or an aggregated distribution. Every location was assigned a cluster index, with a positive patch index of vi for counts that were above the mean and a negative gap index of vj for counts below the mean; an index > 1.5 indicated a patch and an index < -1.5 indicated a gap. The entire sample was also given an index of aggregation, Ia, to indicate significant
32
aggregation (> 1), a random distribution (= 1) or a regular sample (< 1). After
approximately 20,000 randomizations for each test, a probability was generated for a formal test of randomness, Pa. I then interpolated the indices to create two-dimensional contour maps and visualize the patches and gaps with Surfer mapping software version 9.11.947 (Golden Software Inc., Golden, Colorado, USA).
33
3.4 Results
3.4.1 Pest and Natural Enemy Abundance
Approximately 100,000 aphids were collected over the two years and were
comprised of two species, R. padi and S. avenae. Significantly (F1, 238 = 7.46, P = 0.0068) more aphids were collected in 2011 (75,626) compared to 2012 (21,411). Ground-based aphid availability was measured using sticky traps, and was significantly higher in 2011 (Fig. 3.1a) than 2012 (Fig. 3.1b) (F1,915 = 4.66, P = 0.0003).
A total of 11,541 foliar aphid natural enemies were captured in sweep nets in 2011 and 2012, representing four major families including Coccinellidae, Anthocoridae, Chrysopidae and Nabidae. Over half of these (51.1%) were Coccinellidae (Coleoptera) composed of five species: Coccinella septempunctata L., Coleomegilla maculata
DeGeer, Harmonia axyridis (Pallas), Hippodamia convergens Guérin-Méneville, and
Cycloneda munda (Say) (results discussed in detail in Chapter 5). The next most
abundant predator was Orius insidiosus (Say) (Anthocoridae: Hemiptera) which made up 19.8% of the predators (results discussed in Chapter 4). Aphid parasitoids were also present (Braconidae: Hymenoptera). Green lacewing larvae (Chrysopidae: Neuroptera) were composed of two species, Chrysopa oculata Say and Chrysoperla plorabunda
(Fitch) (tentative). Damsel bugs (Nabidae: Hemiptera) were also present each year, but in extremely low numbers. Additionally, approximately 1,000 epigeal spiders in the family Linyphiidae were hand collected.
34 3.4.2 Barley Yellow Dwarf Virus Incidence
3.4.2.1 Plants
In 2011 2,626 plant samples were screened for BYDV with 4.72% testing positive (Fig. 3.2). There was no difference between treatments (F1,253 = 0.72, P = 0.396) on plant infection rate, but there was a field effect (F2,253 = 7.31, P = 0.003). Time of year had a significant effect on the infection rate in plants (F4,253 = 8.4, P < 0.0001) with plants collected in the May having the highest rate of infection. Since there was no detectable difference in infection rates between treatments, plants collected in 2012 were not screened for BYDV.
3.4.2.2 Aphids
In 2011, 4,635 total aphids were screened for BYDV with 12.2% testing positive (Fig. 3.3a). In 2012 1,522 total aphids were screened with 19.6% testing positive (Fig. 3.3b). There was no difference between treatments on aphid infection rates in 2011 (F1,397 = 2.88, P = 0.09) but there was a significant field effect (F2,30 = 3.98, P = 0.03). In 2012 there was no difference between treatments (F1,265 = 1.16, P = 0.283) but there was a significant date effect (F4,265 = 12.97, P < 0.0001). Significantly lower infection rates were detected in aphids early and late in the season (Fig. 3.3b). There were no significant differences in infection rates between the two aphid species (F1,3749 = 0.51, P = 0.477).
3.4.3 Weed Strips
During the 2010-2011 growing season, weeds were abundant in all four fields. Dominant species included common ragweed (Asterales: Asteraceae) (Ambrosia artemisiifolia L.), giant ragweed (Asterales: Asteraceae) (Ambrosia trifida L.), Johnson
35
grass (Poales: Poaceae) (So