J. Viet. Env. 2016, Vol. 8, No. 4, pp. 223-228 DOI: 10.13141/jve.vol8.no4.pp223-228
223
* Corresponding author
E-mail: [email protected] ; [email protected] http://dx.doi.org/10.13141/JVE ISSN: 2193-6471
Modelling nitrous oxide (N
2
O) emission from rice field
in impacts of farming practices: A case study in Duy
Xuyen district, Quang Nam province (Central Vietnam)
Mô hình hóa phát th
ả
i khí nit
ơ
ôxít (N
2O) t
ừ
ru
ộ
ng lúa d
ướ
i tác
độ
ng c
ủ
a các
bi
ệ
n pháp canh tác: nghiên c
ứ
u
đ
i
ể
m t
ạ
i huy
ệ
n Duy Xuyên, t
ỉ
nh Qu
ả
ng Nam
(Vi
ệ
t Nam)
R e s e a r c h a r t i c l e
N g o D u c M i n h1 , 4 , 5* , M a i V a n T r i n h2, T r a n D a n g H o a3, H o a n g T r o n g N g h i a3, N g u y e n M a n h
K h a i4, N g u y e n L e T r a n g4, B j o r n O l e S a n d e r5, R e i n e r W a s s m a n n5
1Soil and Fertilizers Research Institute (SFRI), Duc Thang Ward, North Tu Liem district, Hanoi, Vietnam; 2Institute of Agricultural Environment (IAE), Phu Do Ward, South Tu Liem district, Hanoi, Vietnam; 3Hue University of Agriculture and Forestry (HUAF), 102 Phung Hung, Hue City, Vietnam; 4VNU University of Science (HUS), 334 Nguyen Trai Road, Thanh Xuan, Hanoi, Vietnam; 5International Rice Research Institute (IRRI), 4031 Los Banos, Laguna, Philippine
Nitrous oxide (N2O) emisison from paddy soil via the soil nitrification and denitrification processes
makes an important contribution to atmospheric greenhouse gas concentrations. The soil N2O
emis-sion processes are controlled not only by biological, physical and chemical factors but also by farm-ing practices. In recent years, modelfarm-ing approach has become popular to predict and estimate green-house gas fluxes from field studies. In this study, the DeNitrification–DeComposition (DNDC) model were calibrated and tested by incorporating experimental data with the local climate, soil properties and farming management, for its simulation applicability for the irrigated rice system in Duy Xuyen district, a delta lowland area of Vu Gia-Thu Bon River Basin regions. The revised DNDC was then used to quantitatively estimate N2O emissions from rice fields under a range of
three management farming practices (water management, crop residue incorporation and nitrogen fertilizer application rate). Results from the simulations indicated that (1) N2O emissions were
sig-nificantly affected by water management practices; (2) increases in temperature, total fertilizer N input substantially increased N2O emissions. Finally, five 50-year scenarios were simulated with
DNDC to predict their long-term impacts on crop yield and N2O emissions. The modelled results
suggested that implementation of manure amendment or crop residue incorporation instead of in-creased nitrogen fertilizer application rates would more efficiently mitigate N2O emissions from the
tested rice-based system.
Phát thải nitơ ôxít (N2O) từ canh tác lúa nước (thông qua quá trình nitrat hóa và phản nitrat hóa)
đóng góp đáng kể vào tổng lượng khí nhà kính có nguồn gốc từ sản xuất nông nghiệp. Quá trình phát thải N2O là không chỉ phụ thuộc vào các yếu tố sinh-lý-hóa học mà còn phụ thuộc các phương pháp canh tác. Trong những năm gần đây, việc ứng dụng mô hình hóa nhằm tính toán và ước lượng sự phát thải khí nhà kính ngày càng trở lên phổ biến. Trong nghiên cứu này, số liệu quan trắc từ thí nghiệm đồng ruộng và dữ liệu vềđất đai, khí hậu, biện pháp canh tác được sử dụng để kiểm nghiệm và phân tích độ nhạy của mô hình DNDC (mô hình sinh địa hóa). Sau đó, mô hình được sử dụng để tính toán lượng N2O phát thải trong canh tác lúa nước dưới các phương thức canh tác khác nhau (về chếđộ tưới, mức độ vùi phụ phẩm, bón phân hữu cơ, phân đạm) tại huyện Duy Xuyên, thuộc vùng đồng bằng thấp của lưu vực sông Vu Gia-Thu Bồn. Kết quả kiểm định chỉ ra rằng (1) sự phát thải N2O bịảnh hưởng đáng kể do sự thay đổi chếđộ tưới; (2) nhiệt độ tăng và lượng phân bón N tăng sẽ làm tăng phát thải N2O. Kết quả mô phỏng về tác động lâu dài (trong 50 năm) của các yếu tốđến năng suất cây trồng và phát thải N2O cho thấy: Việc sử dụng phân hữu cơ và phụ phẩm nông nghiệp thay thế cho việc bón phân đạm sẽ giúp giảm phát thải N2O đáng kể.
J. Viet. Env. 2016, Vol. 8, No. 4, pp. 223-228
224
1. Introduction
National inventories of N2O fluxes from agricultural soils, as required by signatory countries to the United Nations Framework Convention of Climate Change (UNFCC), are in the main derived from the use of the default IPCC Tier 1 method, where 1.25% of applied inorganic nitrogen to agricultural soils is assumed to be released to the atmosphere as nitrous oxide-N (IPCC, 2007). This standard reporting procedure has advantages in collating annual inventories but may mask significant variations in emission factors (EFs) on a regional scale (Laegreid et al, 2002) Given the considerable expense of establishing and maintaining relevant flux measurement sites, the use of simulation models to estimate N2O fluxes from agricultural
soils using soil and climate data has obvious benefits. Modelling also allows easy interpretation of the complex links between soil physical, chemical and microbial processes that underpin nitrification, denitrification and decomposition. Models can simulate the processes responsible for production, consumption and transport of N2O in both the long and short term, and also on a spatial
scale (Williams et al., 1992).
Simulation models range from simple empirical relationships based on statistical analyses to complex mechanistic models that consider all factors affecting N2O
production in the soil (Li et al., 1992; Frolking et al., 1998; Roelandt et al., 2005). Variations in soil moisture, soil tem-perature, carbon and nitrogen substrate for microbial nitri-fication and denitrinitri-fication are critical to the determination of N2O emissions (Frissel and Van Veen, 1981). One
widely used mechanistic model is DeNitrification DeComposition (DNDC) developed to assess N2O, NO, N2
and CO2 emissions from agricultural soils (Li et al., 1992a,
1994; Li 2000). Advantages of DNDC are that it has been extensively tested and has shown reasonable agreement be-tween measured and modelled results for many different ecosystems. The model has reasonable data requirement and is suitable for simulation at appropriate temporal and spatial scales.
This paper presents a field evaluation of DNDC for paddy land under 2 water regimes (Continuous flooding (CF) and Alternate Wetting-Drying (AWD)) with different crop res-idue incorporation and nitrogen fertilizer application rate. Results are discussed in terms of the suitability of DNDC model for estimating annual and seasonal fluxes of N2O
from rice field in Vu Gia - Thu Bon river basin.
2. Materials and methods
2.1 Experimental site and measurement
Study site is located in Vu Gia-Thu Bon River Basin, which is the largest river basins and also the key economic and agricultural zone of the Central Coast region of Vi-etnam. The rice is planted as a main food crop in the whole region with 120,000 ha of cultivated area occupying 61% agricultural land of basin (Ngo et al, 2015).
The experiments were caried out by Hue University of Ag-riculture and Forestry (HÙA) in summer-autumn crop sea-son of 2012 at Duy Xuyen district of Quang Nam Province. The experiments included treatments varying in N sources
and water management in plots of 5 m long and 5 m wide. Fourteen-day-old rice seedlings were transplanted by hand at 20 cm (row to row) x 15 cm (hill to hill) spacing. N2O
emission was measured frequently from the plots following GHGs measurement for manual static/closed chamber method. Grain yield were measured at maturity. The meas-ured data from field experiment were used for the calibra-tion of the model. Daily ambient air temperature and pre-cipitation data were collected from the local meteorologi-cal station. The soils, water and air temperature within the chambers were also recorded during each of gas samplings (Ngo et al, 2015).
2.2 Overview of DNDC model
The model of denitrification and decomposition (DNDC) is a generic model that simulates biogeochemical processes leading to greenhouse gas emissions from soil. As a pro-cess-based biogeochemical model, the DNDC can simu-lates carbon (C) and nitrogen (N) cycles in cropping sys-tems (in a daily or subdaily time step) driven by both the environmental factors and management practices. The DNDC consists of two components reflect the two-level driving forces that control C and N dynamics. The first component is based on ecological and biophysical drivers (e.g. climate, soil, vegetation, and anthropogenic activity), consisting of soil climate, crop growth, and decomposition sub-models. The second component, which consists of fer-mentation, denitrification, and nitrification submodels, predicts NO, N2O, N2, CO2, CH4, and NH3 gaseous fluxes
based on the soil environmental variables [6].
The field experiments provided the field data of N2O emissions with relevant environmental conditions. The field data were firstly used for model validation. During the validation tests, the local daily climate data, soil properties and actual farming practices were utilized to compose input scenarios, and the modelled rice yields as well as the N2O flux were compared with the field observations. After that, model sensitivity test (for the same site but with varied climate, soil conditions and farming management) as well as long-term predictions was done with the validated model. Model sensitivity test was evaluated for changes in some farming practices (water regime, N application, straw incorporation) on rice yields and N emission using the baseline data (local weather, soil, location, and other inputs) (Ngo et al, 2015).
2.3 Data input and integration
All data (local climate, soil properties, farming practices) of the field site were collected from field survey and/or documents of the Land Use and Climate Change Interac-tions in Central Vietnam (LUCCi) project & Quang Nam Province. Then, the data were converted, edited to fit the formal requirements as input parameters for running the DNDC model, and used to simulate N2O emissions for all
cropping systems in each district. The data required for the DNDC model comprised soil properties, meteorological data, and farming management, as mentioned in the below section describing the DNDC model (Ngo et al, 2015).
3. Results and discussion
J. Viet. Env. 2016, Vol. 8, No. 4, pp. 223-228
225 Most of the crop physiological and phenological parame-ters set in the DNDC model were originally calibrated against datasets observed in the U.S, India, China or other temperate regions [6]. Discrepancies appeared when the model was applied for the rice crops in Vietnam. Valida-tions were therefore made for the DNDC model to improve its performance in simulating crop yield and N2O
emis-sions for Vietnamese rice fields. Originally, the N2O fluxes
simulated by the model were higher than the measured fluxes in some rice paddies in Vietnam. DNDC was run with the local weather data (i.e., air maximum and mini-mum temperatures and precipitation) of 2012, soil proper-ties (i.e., texture, bulk density, SOC content and pH), and farming management practices (i.e., crop type and rotation, planting and harvest dates, tillage, fertilization, and irriga-tion) as described in above section (Ngo et al, 2015). Table 1. Statistical analysis for comparison of the simulated and observed N2O fluxes
Treatments Measurement number R2 RMSE EF CD
CF 12 0.828 0.215 0.812 1.026
AWD 12 0.725 0.201 0.801 1.002
Table 1 shows the statistical analysis for comparison be-tween the modeled N2O fluxes with observations at the two
irrigation regimes (CF and AWD). The overall correlation between observed and simulated daily N2O fluxes was
ac-ceptable for both water regimes as the R2 values of linear
regression between the simulated and observed mean N2O
emission rates resulted 0.88 and 0.73 for CF and AWD, re-spectively. The RMSE values are 0.215 and 0.201 for CF and AWD, respectively. All EF coefficients are positive (>0.8), and CD coefficients are greater than 1. The results indicated that DNDC is capable of capturing the seasonal patterns as well as the magnitudes of N2O emissions from
the experimental site in the basin. Therefore, the modelled results generally showed a fair agreement with observa-tions although minor discrepancies exist across the sites and treatments.
The simulations fairly captured the magnitudes and pat-terns of the observed N2O emissions for water regimes.
DNDC quantifies N2O fluxes by simulating both
ni-trification and denini-trification rates at daily time steps, re-spectively. The statistical analysis showed that the relative deviations between the observed and modelled N2O fluxes
were about 45% with an absolute difference. The simulated data indicated that the modelled emissions of N2O were
mostly from nitrification; and the episodic peak fluxes were dominated by denitrification. Several of the modelled high
peaks of N2O emissions were induced by the N-fertilizer
applications or irrigation. In general, DNDC predicted more N2O flux peaks which were not observed in the field
in comparison with field observations. The discrepancies between simulated and observed seasonal fluxes were less than 20% of the field seasonal fluxes. The discrepancy on the N2O emissions could be related to the interpolation
ap-proach converting the observed daily N2O fluxes to
sea-sonal total. Overall, it was encouraging to see how DNDC predicted the magnitudes and patterns of N2O emissions for rice-based system in Central Vietnam though discrep-ancies existed in some cases.
3.2 Model sensitivity analysis
In this study, DNDC was run with a one-year baseline sce-nario that was composed based on the actual climate, soil and management conditions in 2011. The sensitivity tests were conducted by varying a single input factor in the range, which was commonly observed in the local farm-land within the county scope, while keeping all other input parameters constant as in the baseline scenario. The details of baseline and alternative scenarios are listed in Tables 2. DNDC was run with each of the scenarios to produce an annual flux of N2O for the tested site. The sensitivity order
of the drivers was determined by comparison the annual N2O fluxes induced by varying each of the drivers.
Table 2. Values of driver parameters (environmental factors and alternative management practices) varied for sensitivity tests
No Input parameter Unit Baseline value Range of value for sensitive test I Weather data
Annual mean temperature ºC 26.8 -2 -1 1 2
Total annual precipitation mm 2893 -20% -10% +10% +20%
II Soil
Soil texture (soil type) Silt loam Loamy
sand
Sandy loam
Loam Sandy
clay loam
Bulk density of top soil g/cm3 2.5 1.5 2.0 3.0 3.5
pH of top soil 5.5 4.5 5 6 6.5
SOC % 1.1 0.1 0.6 1.6 2.1
III Management alternatives
Total fertilizer N input kg/ha 120 60 90 150 180
Number of water drainages 0 1 2 3
FYM amendment kg/ha 0 - 2000 4000 6000
Residue incorporation % 20 40 60 80 100
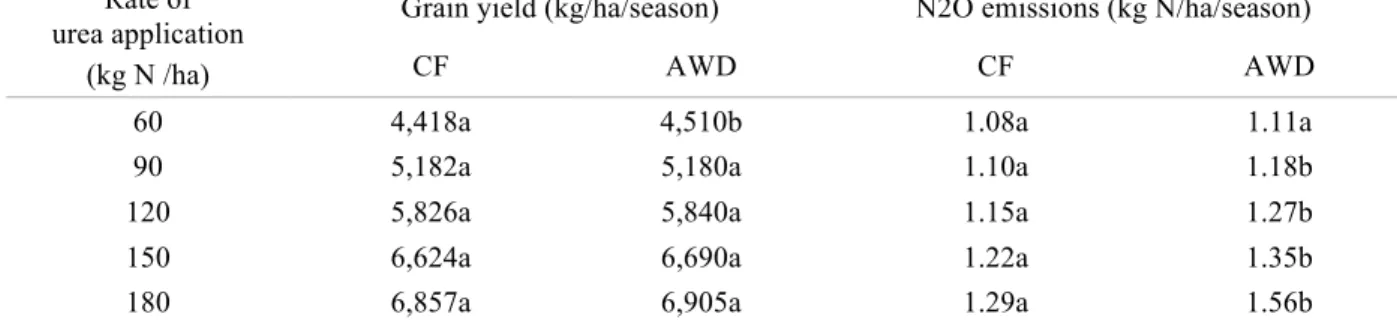
Different application rates of N fertilizer significantly in-fluenced simulated yield, N uptake, and emissions of N2O
J. Viet. Env. 2016, Vol. 8, No. 4, pp. 223-228
226 from soil (Table 3). The grain yield of rice increased with application rates up to 210 kg N/ha, but with smaller in-creases at rates above 150 kg N/ha. Emissions of N2O
re-mained unchanged up to 180 kg N/ha. As the fields were continuously flooded, keeping them anaerobic throughout the growing period, the process of nitrification producing NO−
3 from NH+4 was stopped, and denitrification was also
inhibited because of the nonavailability of substrate (NO−3)
for this process. The nitrification and denitrification pro-cess were mainly responsible for the formation of N2O in
soil. However, the application of N-fertilizer increased N2O emissions because of larger fluxes of NH4+-N.
Water management also influenced the simulated yield and emissions of N2O from soil (Table 3). There is no
signifi-cant difference of rice yield in comparison between CF and AWD. N emissions however increased marginally by a range of 7% to 20% with ADW as compared to baseline CF treatment, respectively, which resulted in aerobic con-ditions of soil with enhanced nitrification forming N2O and
NO3−. It also enhanced denitrification by supplying the
substrate (NO3−) for the denitrifies, resulting in more N2O
emissions when the field was re-flooded (Aulakh et al 1992).
Table 3. Sensitivity analysis for different rates of N application, water regimes, affecting simulated rice yields, and seasonal N2O emissions
Rate of urea application
(kg N /ha)
Grain yield (kg/ha/season) N2O emissions (kg N/ha/season)
CF AWD CF AWD
60 4,418a 4,510b 1.08a 1.11a
90 5,182a 5,180a 1.10a 1.18b
120 5,826a 5,840a 1.15a 1.27b
150 6,624a 6,690a 1.22a 1.35b
180 6,857a 6,905a 1.29a 1.56b
(Note: a & b; the significant difference between two means by T-test analysis at α=0,05) Results from the sensitivity tests indicated that, among the
tested natural factors (i.e., temperature, precipitation, soil texture, SOC content and pH), the SOC content showed the greatest impact on N2O fluxes. When SOC increased from
0.5% to 2%, the annual N2O emission rate increased from
10% to 35% ha-1 y-1. The modelled data indicated that higher SOC produced more DOC and inorganic N (i.e., am-monium and nitrate) through decomposition that led to higher rates of nitrification and denitrification, the two pro-cesses producing N2O. In comparison with SOC, other
nat-ural factors such as temperature, precipitation, soil texture or pH had relatively moderate effects on N2O emissions
from paddy soil at the study site.
Among the tested farming management practices, fertilizer application rate showed almost linear effect on N2O
emis-sions. Increase in fertilizer application rate from 90 to 210 kg N ha-1 increased N2O emission rate from 0.1 to 0.6 kg
N ha-1 y-1. In the tests, conventional tillage with a tilling depth 20 cm elevated N2O emissions. The simulated results
showed that the soil disturbance with tillage increased the soil aeration and decomposition rate leading to larger amount of substrates (e.g., DOC, ammonium, nitrate etc.) released into the soil to stimulate nitrification and deni-trification. Splitting the nitrogen fertilizer into two or more applications did not show significant effect on N2O
emis-sions. Adding organic material to the soil, e.g., crop straw and manure, can significantly increase N2O emissions.
However, sensitivity tests showed that elevating the rate of crop residue incorporation from 15% to 100% resulted in 22% less N2O emitted. It was likely that the addition of
or-ganic carbon would result in insufficient oxygen supply and reduce the activity of autotrophic nitrification bacteria, and impact N2O emissions.
3.3 Long-term impacts of management
prac-tices on N
2O fluxes
The above-described one-year sensitivity tests indicated that N2O emissions were sensitively affected by certain
natural or management factors. However, the long-term consequence of varying the natural or management factors could differ from the short-term results due to the accumu-lative effects of N in the soils. To test the long-term im-pacts, we used 4 long-term alternative management 50-year-scenarios including: (1) decreasing the fertilizer ap-plication rate from the baseline (120 kg ha-1) to 90 kg ha-1,
(2) increasing the fertilizer application rate to 210 kg ha-1
(3) increasing the crop residue incorporation rate from the baseline (20%) to 100%, and (4) increasing FYM rate from 0 (baseline) to 6000 kg ha-1. Except for the above-listed
practices, other factors (e.g., climate, soil and manage-ment) were kept same as the actual conditions at study site. The climate data of 2012 were repeatedly utilized for the 50 years. DNDC was run for 50 years with each of the sce-narios, and the modelled seasonal fluxes of N2O were
rec-orded for assessment.
In comparison with the baseline, the modelled results indi-cated that manure amendment and elevated residue incor-poration both increased SOC content that provided more substrates to stimulate N2O emissions through nitrification
and denitrification in the soil. The increase in fertilizer ap-plication rate elevated N2O emissions; and the decrease in
fertilizer application rate reduced N2O emissions (Figurre
J. Viet. Env. 2016, Vol. 8, No. 4, pp. 223-228
227 Figure 1. Impacts of management practices on long-term N2O fluxes
As a summary, in comparison with the baseline results, in-crease in nitrogen fertilizer application rate elevated soil C content but resulted in a higher N2O value and N leaching
loss. Increase in manure application rate and crop residue incorporation had positive impacts on mitigating the global warming though the two practices led to a litter increase in N leaching loss due to increase in the soil N supply. In gen-eral, the modelled results suggested that implementation of manure amendment or crop residue incorporation instead of increased fertilizer application rates would more efficiently mitigate GHG emissions from the tested agroe-cosystem. Although the results reported in this paper were only for a specific site, the general trends resulted from the study could be applicable to other locations in the region with the same conditions.
As a summary, in comparison with the baseline results, in-crease in nitrogen fertilizer application rate elevated soil C content but resulted in a higher N2O value and N leaching
loss. Increase in manure application rate and crop residue incorporation had positive impacts on mitigating the global warming though the two practices led to a litter increase in N leaching loss due to increase in the soil N supply. In gen-eral, the modelled results suggested that implementation of manure amendment or crop residue incorporation instead of increased fertilizer application rates would more efficiently mitigate GHG emissions from the tested agroe-cosystem. Although the results reported in this paper were only for a specific site, the general trends resulted from the study could be applicable to other locations in the region with the same conditions.
4. Conclusions
By comparing the modelled results on N2O emissions
against observations for paddy field in Vu Gia-Thu Bon river basin, the applicability of DNDC for this kind of crop-ping system was confirmed. The sensitivity tests conducted with DNDC provided detailed information about how the environmental or management factors affected N2O
emis-sions. The results indicated that (1) increases in tempera-ture, initial SOC, total fertilizer N input, and manure amendment substantially significantly increased N2O
emis-sions; and (2) temperature, initial SOC, tillage, and quan-tity and quality of the organic matter added in the soil all had significant effects on global warming. Finally, five 50-year-scenarios were simulated with DNDC to predict their long-term impacts on crop yield and N2O emissions. The
multi impacts provided a sound basis for comprehensive
assessments on the management alternatives. In general, DNDC proved a decent model through the validations, sen-sitivity tests and long-term predictions conducted in the study. This kind of modelling tools should play an im-portant role in not only environmental impacts but also ag-ricultural production for a wide range of agro-ecosystems in Central Vietnam.
Acknowledgements
The first author highly appreciates to IRRI and LUCCi pro-ject for providing fund for this study. The author expresses his deep gratitude to Agronomy Faculty of Hue University of Agriculture and Forestry for giving technical assis-tance/data for field experiment, measurement and survey. Thanks also go to colleagues in IRRI, IAE, HUS, HUAF for their valuable contribution and comments to improve the manuscript considerably.
5. References
[1] Aulakh, M.S., Doran, J.W., Mosier, A.R., (1992). Soil denitrification – significance, measurement, and ef-fects of management. Adv. Soil Sci. 18:2-42.
[2] Frissel, M. and Van Veen, J.A., (1981). Simulation of nitrogen behaviour of soil plant systems (eds). PUDOC, Wageningen. P. 277.
[3] Frolking, S.E., Mosier, A.R., Ojima, D.S., Li, C., Par-ton, W.J., Potter, C.S., Priesack, E., Stenger, R., Haberbosch, C., Dorsch, P., Flessa, H., Smith, K.A. (1998). Comparisons of N2O emissions from soils at three temperate agricultural sites: simulations of year-round measurements by four models. Nutrients Cy-cling in Agro-ecosystems 52, 77-105.
[4] IPCC (Intergovernmental Panel on Climate Change) (2006). IPCC guidelines for national greenhouse gas inventories. Vol. 4. Hayama: Institute for Global En-vironmental Strategies (IGES)
[5] IPCC (Intergovernmental Panel on Climate Change) (2007). Climate change 2007. Cambridge, UK and New York, NY (USA): Cambridge University Press.
[6] Institute for the Study of Earth, Oceans and Space - University of New Hampshire. User's Guide for the DNDC Model, April 15, 2007
[7] Laegreid M. and Aastveit A.H (2002). Nitrous oxide emissions from field applied fertilizers. In: Petersen S.O and Olesen J.E. (Eds.). Greenhouse gas invento-ries for agric. In the Nordic Countinvento-ries, DIAS Report. Plant production no, 81. Danish Institute of Agricul-ture. Sciences, 122-134.
[8] Li, C. (2000). Modelling trace gas emissions from ag-ricultural ecosystems. Nutrients Cycling in Agro-eco-systems 58, 259-276.
[9] Li, C., Frolking, S., Frolking, T.A. (1992). A model of nitrous oxide evolution from soil driven by rainfall events.1. Model structure and sensitivity. Geophysi-cal Research 97, 9759-9776.
[10] Li, C., Frolking, S., Harris, R. Modelling carbon bio-geochemistry in agricultural soils. Global Biogeo-chemical Cycles 8, (1994) 237-254.
J. Viet. Env. 2016, Vol. 8, No. 4, pp. 223-228
228
[11] Li, C., Narayanan, V., Harriss, R. Model estimate of N2O emissions from agricultural lands in the United States. Global Bio-geophysical Cycles 10, (1996) 297-306.
[12] LUCCi –Land Use and Climate Change. Interactions in Central Vietnam. Available in http://www.lucci-vi-etnam.info/projectregion/natural-environment.
[13] Ngo, D.M., Mai, V.T., Wassmann R., Sander B.O., Tran, D.H., Nguyen L.T, Nguyen M.K. (2015), Sim-ulation of Methane Emission from Rice Paddy Fields
in Vu Gia-Thu Bồn River Basin of Vietnam using the DNDC Model: Field Validation and Sensitivity Anal-ysis, VNU Journal of Science: Earth and Environ-mental Sciences, Vol. 31, No. 1 (2015) 36-48.
[14] Roelandt, C., Van Wesemael, B., and Rounsevell, M. (2005). Estimating annual N2O emissions from agri-cultural soils in temperate climate. Global Change Bi-ology 11, 1701-1711.