1
Joint Assessment of Network- and Perceived-QoS in Video
Delivery Networks
Georgios Gardikis, George Xilouris, Evangelos Pallis and Anastasios Kourtis
NCSR "Demokritos", Institute of Informatics and Telecommunications Patr. Gregoriou & Neapoleos str., Ag.Paraskevi 153 10, Athens, Greece
Abstract - Given the increasing number of IP streaming video customers, service providers are seeking an efficient way to monitor in real time the offered quality of service, as perceived by each end user. Since real-time video quality assessment via image processing algorithms is quite bandwidth- and processing-power-demanding, a feasible alternative could be to monitor the network-level quality of service (NQoS) and associate it with the perceived QoS (PQoS). This article presents a network-agnostic framework for the joint assessment of N- and P-QoS, with the aim of correlating these two parameters for a specific network and service configuration. This framework/architecture is implemented with open source software tools and is being demonstrated in an actual WiMAX streaming video distribution platform.
I. Introduction
Assisted by the ever-increasing capacity of core and access networking technologies, video-related services are gaining ground in wired and wireless IP access platforms. Choosing among a large variety of services, from multicast IPTV and video-on-demand to Internet-based video suites like YouTube and to specialized applications such as remote surveillance, end users are gradually migrating from traditional broadcasting systems to IP access networks in order to access broadband multimedia content.
In this context, it is vital for the service provider to ensure that end users are enjoying their multimedia content at the desired quality of service (QoS), as this is perceived by them. In video services, this Perceived Quality of Service (PQoS) mostly corresponds to picture quality. However, approximating the users’ perception of picture quality in real time via DSP/image processing algorithms is a complicated procedure, requiring significant processing power. Thus, it is not feasible to be performed in consumer applications. On the other hand, network-level connection quality indicators, such as packet loss, jitter or delay, corresponding to the Network Quality of Service (NQoS), can be easily measured by the client terminal and monitored by the network provider. Moreover, the network provider can employ numerous mechanisms at network level in order to optimize the access network and compensate for such impairments. What is needed is the impact of this optimization on the user-perceived quality, whose improvement should be the ultimate goal.
Consequently, it would be desirable to associate the NQoS indicators to the actual PQoS level, as perceived by the viewer, so as to have at any moment an estimation of the viewed picture quality and to achieve at any moment the actual optimization of the network-service chain. For this purpose, we propose a methodology of out-of-service joint assessment of PQoS and NQoS which can be applied in any wired or wireless IP-based network, using selected test video sequences. The off-line processing of the results derived from this assessment can be used to associate the network- with the perceived-QoS and build a relationship between these two parameters which can be used in real-time monitoring.
The paper proceeds as follows: Section II presents the challenges associated with PQoS assessment in video streaming platforms. Section III describes the proposed network-agnostic
2 framework for joint N- and P-QoS assessment and presents an easily reproduceable implementation of this framework using open-source tools. Section IV illustrates the application of the proposed framework in a WiMAX network providing streaming video services in a lossy wireless environment and discusses the derived results. Finally, Section V concludes the paper.
II. Video streaming and Perceived QoS assessment
Video delivery in IP networks is achieved via two main mechanisms: download-and-play and streaming.
Download-and-play is the easiest approach, usually adopted in low-bandwidth Internet video applications with pre-recorded content. This approach involves the multimedia content being “blindly” downloaded as any data file from the server to the client over TCP, in a “best-effort” manner regarding the transfer speed. Playback starts either after the completion of the download, or before it. In the latter case, downloading and playback take place simultaneously, utilizing an intermediate buffer. As soon as this buffer empties, occasionally this happens when the connection speed is not enough, the video pauses until a new portion of video data is buffered.
Streaming is a more sophisticated mechanism. The Server-Streamer sends the video at a controlled rate, following specific timestamps within the stream, corresponding to the actual playback rate of the multimedia content. At the transport layer, UDP is more commonly used, combined with media-delivery-related protocols in the upper layers (such as RTP/RTSP). Unlike download-and-play, streaming is suitable for both unicast and multicast/broadcast services. Moreover it is suitable for both pre-recorded and live content. Apart from the Internet and mobile applications, streaming is also almost exclusively used in large IPTV platforms (e.g. in a “triple-play” package) and also in broadcasting systems. In this paper, we will concentrate in the streaming scenario.
A video streaming platform usually consists of the following elements:
- The Content generation modules, i.e. the digital storage units for pre-recorded content or the live encoders for live content
- The Streamer or Streaming Server
- The IP distribution network (core and access) involving a centralized access entity – e.g. a head-end in cable systems, a DSLAM in a DSL access network or a Base Station in a wireless network
- The client receiver/decoder and media presentation units
The video quality, as perceived by the user, can be affected by all the aforementioned elements. For example, a lot of research work has been carried out on the effect of the encoding procedure on the picture quality. In this paper we will focus on the effect of the IP distribution network and the associated network-level impairments i.e. the Network-level QoS on the perceived video quality (PQoS).Such impairments could include e.g. a congestion on a link-bottleneck in a wired system or a strong signal fading in a wireless platform, which are directly translated to increased delay, jitter and eventually packet loss. Various works deal with this subject, more specifically in [1] the authors study the effect of delay jitter on the perceptual quality of video while in [2] the authors present the effects of delay and jitter in users perception, integrating an eye tracking assessment for better understanding of user perception. In [3-5] the authors study the effects of loss on video transmission.
3 DiffServ have been made [6,7]. Effort has also been made in order to identify dynamic way to map the video flows to certain QoS categories [8,9] or ways to adapt the video stream to certain network conditions [10].
In a download-and-play service, which is mostly TCP-based, network-level impairments cause the slowing down of the TCP transfer and eventually the freezing of the playback when the client's playout buffer becomes empty. In a streaming service, which is mostly UDP-based, network-level impairments result in unrecoverable packet loss. The absence of certain blocks of data from the decoder causes severe picture artifacts. (Fig.1.)
Fig. 1. Impact of packet loss in an H.264 streaming video
In order to quantify this service degradation perceptually, either subjective or objective methods can be used. Subjective measurements involve presenting the distorted picture to a series of evaluators and asking them to record the quality degradation, as they perceive it, in terms of a certain scale (e.g. 1 to 5). In [11] the authors present experimental results linking users’ understanding and perception of multimedia clips with the presentation QoS.
Objective measurements involve feeding the distorted image into a digital image processing (DIP) algorithm, which analyses the picture artifacts and tries to approach a subjective-derived result.
At times, many video quality assessment algorithms have been proposed. They can be categorized as full-reference (FR), reduced-reference (RR) and no-reference (NR), in regard to the amount of original (undistorted) picture information that is needed. FR algorithms require the entire original and distorted video frames. RR algorithms extract some parameters from the original and the distorted frames, and compare these parameters in order to derive a quality score. NR algorithms are simpler to apply since they examine only the distorted frame, however they produce less accurate results.
Often, simple approaches for video quality estimation are adopted, such as the Decodable Frame Ratio [5, 12] or the PSNR (Peak Signal-to-Noise Ratio). Among the video quality assessment metrics, one of the most reliable is the VQM-GM (Video Quality Metric - General Model), as described in [13]. The VQM-GM utilizes a Reduced-Reference algorithm and has outperformed many other proposed metrics in approaching the users' perception of video quality. It was thus adopted as an ANSI Standard (ANSI T1.801.03-2003) and also by ITU-T in March of 2004 (ITU-T J.144), and by ITU-R in June of 2004 (ITU-R BT.1683). This is the metric that is used in this paper.
III. A network-agnostic framework for joint assessment of N- and P-QoS
end-4 users, a video quality assessment algorithm should be run on both the streaming server and the client terminal/set-top box. But such an approach is not feasible due to the high complexity of the video quality estimation algorithms and the increased processing power that is needed from the user terminals’ side. It should also pose a significant overhead on the streaming server, which should calculate PQoS metrics in real time for every stream that is served. Thus, a simpler approach would be to associate the Network- with the Perceived-QoS on a given video delivery system. In this way, NQoS parameters, which can be easily monitored for every user, would be instantly mapped to an associated PQoS score.
There can not be a single universal mapping of network-level QoS to video quality, valid for all systems and all configurations, even if a specific video codec is assumed. [14] attempts via a detailed analytical approach, to map transmission errors to video distortion. In [15] a NR Perceived-QoS assessment model is presented that tries to define a lower bound for Perceived Perceived-QoS deduced from various loss distributions. However, there are several system- and content- dependent factors that affect the impact of NQoS degradation to PQoS, most of which can be fine-tuned in order to optimise the PQoS:
- Burstiness of packet losses. It has been shown that the effect of burst packet losses on the video quality is less than distributed losses, given the same packet loss rate [5]. A bursty loss in a wireless network due to signal fading could somehow be compensated utilizing a packet interleaving scheme, either in data-link or network-layer.
- Packet size. Smaller sizes usually result in less per-packet data being lost, but require more overhead.
- Receiver buffer size. A larger buffer size always increases tolerance to excessive jitter, at the expense of memory resources [5]..
- Video content parameters, i.e. spatial and temporal dynamics, frame rate and resolution - Video codec (e.g. MPEG-2, MPEG-4, AVC etc.)
- Video GOP size i.e. distance between two consecutive I (Intra) frames. Since I-frames can be independently decoded, a small GOP size enables the system to recover faster from an error [14]. The presence of an I-frame stops the propagation of an error. However, smaller GOP size results in either higher bit rate or (if the bit rate remains the same) in poorer encoding quality.
- Decoder resilience and error detection and concealment capabilities. Most contemporary decoders utilize error detection methods and proactive algorithms in order to conceal the appearance of the error as much as possible.
Thus, one should begin with a specific network and service configuration, with a given set of network and service parameters, such as the ones aforementioned. Then, on this configuration, a set of various representative video sequences should be used for off-line evaluation, served under (natural or emulated/controlled) network impairments. For each sequence, both the NQoS (mostly packet loss and jitter - as reported by appropriate network-level probes) and the PQoS (as derived from the video quality assessment algorithm) should be extracted. The accumulation of a significant number of measured (NQoS, PQoS) pairs could assist in coming up with an acceptable correlation.
We could consider a universal, network-agnostic framework, for the simultaneous assessment of N- and P-QoS in a video streaming system. This framework/architecture is depicted in Fig.2 and can be seen as truly universal. Indeed, it can be applied on any centralized streaming video delivery system-
- for any type of streaming video service (live or pre-recorded, unicast or multicast, regardless of codec, resolution or content)
- for any type of IP delivery network, core or access, wired or wireless, from (W)LAN/(W)MAN/(W)WAN to cellular and even satellite and IP broadcasting systems
5 (like DVB-H)
- for any type of streaming server and associated client decoder/set-top box, provided that standardized transport protocols are used, such as RTP.
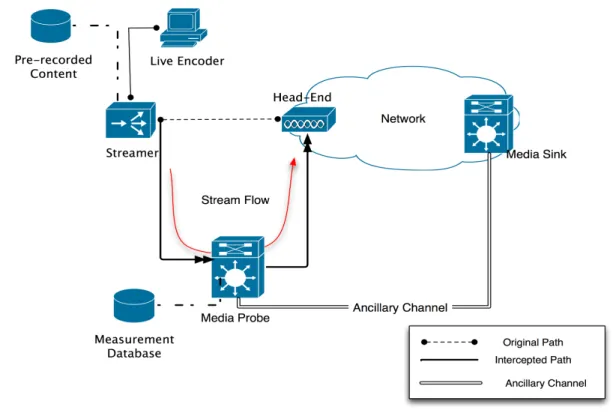
Figure 2. The proposed generic framework/architecture for joint N- and P-QoS assessment
As shown in Fig.2, this experimental architecture involves the insertion of two probe modules into the streaming video delivery chain to be evaluated.
The Media Probe transparently intercepts the link between the streamer and the distribution network. Due to the fact that the Media Probe operates in Layer 2, it is seamlessly integrated in the network configuration, without the need of altering the configuration of either the Content Provision part or the Network part, enhancing this way the network agnostic nature of the proposed framework,. It plainly forwards the video stream unaltered from its input to its output interface, monitoring at the same time the sequence numbers and timestamps of the packets constituting the streams. The Media Probe also extracts the video stream from the forwarded data and keeps a local copy to be used as a reference stream in PQoS assessment.
The Media Sink module is integrated into the client terminal/set-top-box. It performs similar functions, monitoring the sequence numbers and timestamps of the incoming media stream packets. At the same time, it decodes the video stream and locally saves it, along with any impairments that might have occurred.
The received and decoded video stream, along with the network analysis data are sent back to the Media Probe via an ancillary channel. The Media Probe performs the following functions:
- Compares the network dump data (timestamps, sequence numbers) to derive the NQoS indicators - packet loss, jitter and end-to-end delay along with their statistical distribution. - Runs the video quality assessment algorithm to compare the locally saved (reference) video
stream with the one sent from the Sink and produce a final PQoS score.
real-6 time network analyzers and hardware DSPs for fast image processing. However, it can also be implemented in a lower-profile setup, affordable and easy to implement. In order to illustrate this capability, we implemented this architecture in-lab using common PCs and exclusively open source software tools.
In our implementation, both the Media Probe and Media Sink modules were implemented in two identical PCs running Debian Linux, with kernel v.2.6.23. Common network tools (iptables, tcpdump) were used for real-time traffic handling and analyzing. The Media Encoder (mencoder) suite was used for real-time decoding of both the reference and the impaired video stream. Mencoder was build from a development source code release (dev-SVN-r29170) [16], with build in support of LIVE555 Streaming Media library [17]. Finally, the video quality of the captured videos was assessed according to ANSI T1.801.03, utilizing the publicly available VQM MATLAB-based code [18].
The ancillary channel was implemented as an Ethernet link. Unix shell scripts were used to automatically a) request and retrieve the video stream from the Sink, b) convey the video and network dump data back to the Probe, c) analyze the data and retrieve PQoS and NQoS metrics and d) group, statistically process and present the results.
IV. Application in a WiMAX network and results
For a proof-of-concept application of the aforementioned framework, we considered the scenario of on-demand video streaming over a WiMAX access network. The experimental set-up shown in Fig. 3 was used.
Figure 3. Application of the assessment framework in an actual WiMAX network
In an actual campus-wide WiMAX deployment, video streams were served on-demand via a central Base Station. 3.5-GHz units were employed, compliant to the IEEE 802.16-2004 specification. The Base Station was using a directional sector antenna, while the (single) wireless Subscriber Unit used an embedded high-gain (16dBi) one. The client terminal along with the Media Sink were fed by the
7 Subscriber Unit. The latter was placed in a location lacking line-of-sight connection, making the link subject to occasional packet losses due to poor propagation conditions. Instead of using a network emulator to inject deliberate packet losses, in our set-up the network-level impairments were all due to the weak radio link, natural and uncontrolled, in order to approach the actual condition of a WiMAX client with poor reception conditions. A similar behaviour would also be expected in a mobile reception case via a Mobile WiMAX or a 3G platform, within a multipath, fast-fading environment.
As a content, having in mind the movie-on-demand usage scenario, we used five 30-second video sequences extracted from HD movie content (Fig.4) The content was chosen to represent a variety of spatial complexity and temporal dynamics, as shown in Table 1. The clips were downsized to 640x256 resolution and encoded in H.264 format at 1.5 Mbps/25fps. The assessment procedure could also be carried out with the original HD content, but downsampling was chosen to speed up the video quality assessment procedure. A GOP size of 50 frames (2 seconds) was used. Having an independent/intra frame every 2 seconds meant that a single error could not propagate in the video stream for more than 2 seconds.
8
Figure 4. Snapshots from the test sequences that were used
Sequence no.
Source Spatial complexity Temporal dynamics
1 007 Quantum of Solace (MGM/Fox,
2008)
Medium Very high
2 007 Quantum of Solace (MGM/Fox,
2008)
Very high Very high
3 Marley & Me (Fox, 2009) High Medium
4 Lawrence of Arabia (Horizon, 1962) High Low
5 Lawrence of Arabia (Horizon, 1962) Low Low
Table 1. Characterization of content used
All video streams were server by the Darwin Streaming Server (DSS) [19]. DSS in an Open Source version of Apple’s QuickTime streaming server, that permits the transmission of streaming media to clients using the industry standard RTP/UDP and RTSP protocols. RTP sequence numbers and timestamps were recorded in real time by both the Media Probe and the Sink. The network dump data are concentrated in the Media Probe, where the NQoS data are extracted (RTP packet loss, jitter, end-to-end delay). At the same time, the captured videos are processed in comparison to the reference ones - which have been derived under ideal network conditions – and a PQoS score is calculated, within a scale from 100 (best quality, no noticeable visual artifacts) to 0 (worst quality). Negative PQoS scores – which were possible to occur – were truncated to 0. The 0-100 scale is used in most PQoS-related research work.
Twelve consecutive measurement sets were derived, all under the same wireless link conditions. Each set involved five measurements on each of the test sequences. The final outcome was a set of 60 NQoS measurements and associated PQoS assessments for each 30-second clip.
From the NQoS indicators, we concentrated on RTP packet loss. End-to-end delay did not (as expected) have an impact on picture quality, only on service response time. Moreover, even extreme jitter variations did not actually produce any visual artifacts, since they were “absorbed” by the sufficient buffer of the player/decoder. Fig. 5. shows the distribution of RTP packet loss which was recorded across all measurements. Correspondingly, Fig.6. shows the statistical distribution of PQoS scores.
9
Fig. 5. Distribution of RTP packet loss encountered
Fig.6. Distribution of PQoS (VQM) scores
In an effort to map network to perceived quality for each of the test sequences, Figures 7(a) to (e) shows the packet loss/video quality plots for Sequences 1 to 5, respectively.
10
11 It can be observed that, despite the high variation in the content and the spatial and temporal dynamics of the test sequences, the relationship between loss and quality follows more or less the same trendline. The only difference can be observed in Sequence 5, which seems to be the most tolerant, remaining viewable at a packet loss of even 10%. However, the behavior of all clips is more or less the same, which allows us to extract a universal NQoS-to-PQoS association, independent of the nature of the content.
For example, a linear best-fit across all sequences would yield: P = 100 - 3,92N
where P is the perceived video quality (%) and N the RTP packet loss (%). The correlation coefficient of the entire data set is 0.7. Using this approximation, the service provider, knowing a priori the per-user loss ratio, which is a figure available in real time, can have a very close estimation on the actual quality which the customer enjoys.
It must be again stressed out that this relationship is valid only for the specific configuration i.e. the specific access network type, network parameters, video resolution and encoding parameters and client/decoder configuration. The aforementioned results have no general application, they just demonstrate the methodology to be used. This means that, for a given network/service configuration, the system operator should carry on the aforementioned off-line procedure from the beginning, using carefully selected and representative test content, in order to obtain the desired NQoS- PQoS correlation.
V. Conclusion
We presented a generic framework for the joint assessment of Network- and Perceived- Quality of Service for all types of video streaming services. A simple and affordable implementation was demonstrated, using open-source, publicly available software modules and a standardized metric for video quality assessment. The proposed framework is applicable to all IP video distribution networks, and, as a proof-of-concept, its application to a WiMAX video distribution platform was illustrated. Using a variety of video content, results showed a consistent NQoS-PQoS correlation, regardless of the content dynamics. It can thus be deduced, that, in a given network and service configuration, the illustrated procedure can be followed on an off-line basis using carefully selected content, in order to provide service providers an estimation of the per-used perceived QoS, in real time.
References
[1] Claypool, M. and Tanner, J. 1999. The effects of jitter on the peceptual quality of video. In Proceedings of the Seventh ACM international Conference on Multimedia (Part 2) (Orlando, Florida, United States, October 30 - November 05, 1999). MULTIMEDIA '99. ACM, New York, NY, 115-118. DOI= http://doi.acm.org/10.1145/319878.319909
[2] Gulliver, S.R. and Ghinea, G., (2007) The Perceptual and Attentive Impact of Delay and Jitter in Mutimedia Delivery, IEEE Transactions on Broadcasting 53 (2) : 449-458
12 public Internet. In Proceedings of the Sixth ACM international Conference on Multimedia (Bristol, United Kingdom, September 13 - 16, 1998). MULTIMEDIA '98. ACM, New York, NY, 181-190. DOI= http://doi.acm.org/10.1145/290747.290770
[4] Stuhlmuller, K., Farber, N., Link, M., Girod, B., Analysis of video transmission over lossy channels, Selected Areas in Communications, IEEE Journal on, 18(6):1012-1032, Jun 2000.
[5] C. Lin, C. Ke, C. Shieh and N. Chilamkurti, The Packet Loss Effect on MPEG Video Transmission in Wireless Networks, in Proc. IEEE AINA '06
[6] Fei Zhang, Macnicol, J.;, Pickering, M.R., Frater, M.R., Arnold, J.F., Efficient Streaming Packet Video Over Differentiated Services Networks, Multimedia, IEEE Transactions on, Volume 8, Issue 5, Oct. 2006 Page(s):1005 – 1010.
[7] Fei Zhang, Pickering, M.R., Frater, M.R., Arnold, J.F, Arnold,, in Proc., IEEE International Conference on Speech, and Signal Processing (ICASSP), Volume 5, Page(s): V – 744-7, 6-10 April 2003.
[8] Jitae Shin, Jong Won Kim, Kuo C.-C.Jay, Quality-of-service mapping mechanism for packet video in differentiated services network, Multimedia, IEEE Transactions on, 3(2) : 219-231, 2001.
[9] T. Ahmed, A. Mehaoua, and G. Buridant, Implementing MPEG-4 video on demand over IP differentiated services, IEEE Global Telecom conference records (2001). PP. 2489-2493.
[10] Kusmierek, E. and Du, D. H. 2005. Streaming video delivery over internet with adaptive end-to-end QoS. J. Syst. Softw. 75, 3 (Mar. 2005), 237-252. DOI= http://dx.doi.org/10.1016/j.jss.2003.12.034.
[11] Ginea, G. and Thomas, J. P. 1998. QoS impact on user perception and understanding of multimedia video clips. In Proceedings of the Sixth ACM international Conference on Multimedia (Bristol, United Kingdom, September 13 - 16, 1998). MULTIMEDIA '98. ACM, New York, NY, 49-54. DOI= http://doi.acm.org/10.1145/290747.290754
[12] H. Koumaras, F. Liberal, L. Sun, PQoS Assessment Methods for Multimedia Services, Chapter contribution in "Wireless Multimedia: Quality of Service and Solutions", Editors Dr. Nikki Cranley, Dr. Liam Murphy, IGI Global Pub. ISBN: 978-1-59904-820-8, July 2008.
[13] M.Pinson and S.Wolf, “A New Standardized Method for Objectively Measuring Video Quality”, IEEE Transactions on Broadcasting, v. 50, n. 3, pp. 312-322, September, 2004. [14] Z. He and H.Xiong, “Transmission Distortion Analysis for Real-Time Video Encoding and
Streaming over Wireless Networks”, IEEE Trans. on Circ. Sys. for Video Technology, 16(9), pp.1051-1062
[15] H. Koumaras, A. Kourtis, C-H Lin, C-K Shieh, A Theoretical Framework for End-to-End Video Quality Prediction of MPEG-based Sequences, International Journal On Advances in Networks and Services, Vol. 1, No. 1, Jan 2009.
[16] Media Encoder, Mencoder, on-line http://www.mplayerhq.hu [17] Live555 Streaming Media, on-line: http://www.live555.com/
[18] Video Quality Measurement software, on-line: http://www.its.bldrdoc.gov/vqm/
[19] Darwin Streaming Server, on-line: http://developer.apple.com/opensource/ server/streaming/index.html.