The Economic Impact of the Green Industry
in the United States
Charles R. Hall, Professor, Department of Agricultural Economics, University of Tennessee, 2621 Morgan Circle Room 314B, Knoxville, TN 37996, crh@utk.edu
Alan W. Hodges, Associate, Department of Food and Resource Economics, University of Florida, PO Box 110240, Gainesville, FL 32611, awhodges@ufl.edu
John J. Haydu, Professor, Department of Food and Resource Economics, University of Florida, 2725 Binion Rd, Apopka, FL 32703, jjh@ifas.ufl.edu
ABSTRACT
This study estimates the economic impacts of the U.S. environmental horticulture industry (also known as the Green Industry) to be $147.8 billion in output, 1,964,339 jobs, $95.1 billion in value added, $64.3 billion in labor income, and $6.9 billion in indirect business taxes, with these values expressed in 2004 dollars.
ADDITIONAL KEY WORDS: environmental horticulture industry, economic impacts, Green industry, industry analysis.
JEL CODES: Industrial Organization; Industry Studies – Manufacturing, Services; Urban, Rural, and Regional Economics
Selected Paper prepared for presentation at the Southern Agricultural Economics Association Annual Meetings, Orlando, Florida, February 5-8, 2006
Copyright 2005 by Charles R. Hall, Alan W. Hodges, and John J. Haydu. All rights reserved. Reader may make verbatim copies of this document for non-commercial purposes by any means, provided that this copyright notice appears on all such copies.
1
Introduction
The U.S. environmental horticulture industry, also known as the Green Industry, is comprised of wholesale nursery and sod growers, landscape architects, designers/builders, contractors and maintenance firms, retail garden centers, home centers and mass merchandisers with lawn and garden departments, and marketing intermediaries such as brokers and
horticultural distribution centers (re-wholesalers). This industry is one of the fastest growing sectors in the nation’s agricultural economy; often experiencing growth and expansion even during recessionary periods.
The relationship between urban/community forestry and the Green Industry has become more widely recognized as urban forestry has become more acknowledged as an integral segment of the infrastructure of our communities. However, this relationship is still vastly unappreciated in terms of the degree of synergy that the two segments share. Not only is the Green Industry crucial for the support of urban forestry in providing quality plant material used in our cities, it also offers professional personnel with specialized expertise for growing,
maintaining, and managing city trees. Both entities enjoy the benefits of this symbiotic
relationship, and each would be diminished without the other. The importance of developing a mechanism by which this relationship can be measured, therefore, is crucial to understanding how to best plan for the future strengthening of each.
In spite of the magnitude and recent growth and interest in the Green Industry, there is surprisingly little information that has been developed on the national level regarding the economic impact of the Green Industry. The U.S.D.A. conducts floriculture and nursery crop surveys to collect information at the grower level, but data are often incomplete for some states, do not include small growers, and cash receipts reported do not reflect the further economic
2
impacts generated from this production activity. The census of agriculture data, including the 10-year census of horticultural specialties, are subject to the same limitations and have historically had other mitigating problems such as low response rate that reflect poorly on the data’s accuracy. For firms downstream in the supply chain, such as landscapers, re-wholesalers, and retailers, there are economic statistics and employment data maintained by each state’s office of the comptroller. However, misclassification errors and non-compliance on the part of industry participants have made some state data speculative at best. To date, no one source of data has proven historically to be instrumental in capturing the total economic importance of the Green Industry.
Recognizing the limitations of existing data sources and also the critical need for this type of economic impact data, several state nursery and landscape associations have sponsored and developed their own economic impact studies for their respective Green Industries. Such states have found these studies to be useful in communicating the importance of the Green Industry to decision makers, and in combating proposed legislation that would have had severe negative impacts on urban or community forestry initiatives and the Green Industry (e.g., labor
regulations, constraints on water usage, etc.). As useful as these state-specific studies have been, there have not been similar analyses conducted at the national level, which would provide similar benefits on a national scale. Additionally, these studies have used differing methodologies and included, in many cases, differing industry sectors. This has inhibited the direct comparison of these state studies across state lines. The objective of this study was to estimate the economic impacts of the Green Industry at the national level, reviewing the studies that have already been conducted by several states, and complementing those with data from other primary and
3
Methodology
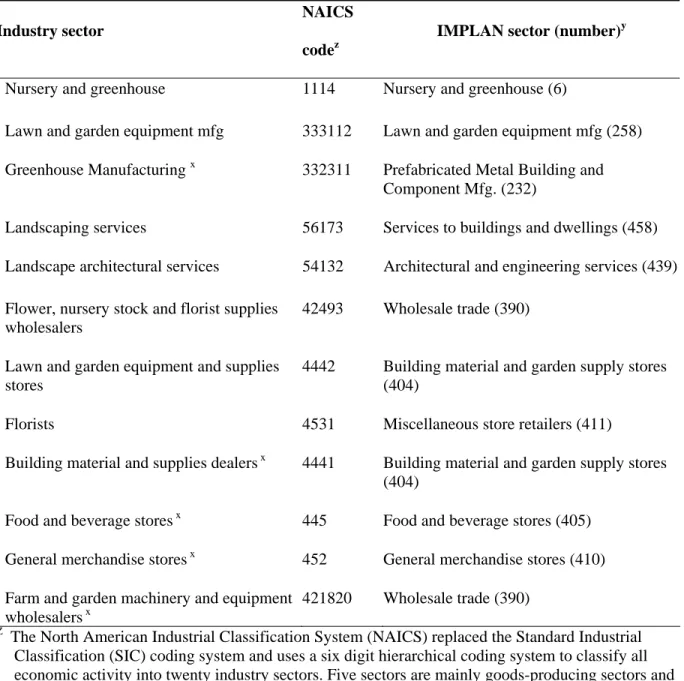
INDUSTRY SECTOR CLASSIFICATION. The economic sectors associated with the Green Industry were identified based on their primary product or service activity as described in the North American Industry Classification System (U.S. Census Bureau, 2005a) as indicated in Table 1. Production and manufacturing includes the sectors for nursery and greenhouse growers, lawn and garden equipment manufacturers, and greenhouse manufacturers (prefabricated metal buildings). The horticultural services sector includes lawn and landscape service firms and landscape architects. Wholesale and retail trade of horticultural goods includes sectors for flower, nursery stock and florist supplies wholesalers, lawn and garden stores, and florists. In addition, building material and supplies dealers, food and beverage stores, general merchandise stores, and farm and garden equipment wholesalers all have significant sales of horticultural merchandise as part of their overall business.
INFORMATION SOURCES.Economic information on the Green Industry in the U.S. was
compiled from a variety of sources. For the nursery and greenhouse sector, national and state information on number of farms and value of sales were taken from the census of agriculture for 2002 (U.S. Department of Agriculture, 2004a). For the various services and trade sectors, information on number of establishments, employment, and sales (receipts) were taken from the 2002 economic census industry report series (U.S. Census Bureau, 2004a-j, 2005b), while state-level information on number of firms, employment and payroll in 2002 were taken from county business patterns (U.S. Census Bureau, 2004k). For the sectors whose primary business is not in horticulture (such as general merchandise stores), employment and payroll were estimated in proportion to horticulture merchandise or product line sales as a share of total sales, which ranged from 1% for food and beverage stores to 27% for garden equipment wholesalers. Also,
4
state-level information on number of firms, employment and payroll were adjusted to match the U.S. totals. The census of agriculture and economic census were considered to be the most reliable information sources available, since they have well-established statistical methodologies, with adjustment for small or non-responding firms, and provide published confidence
parameters. For some states in which employment and wages were non-disclosed because of a small number of firms reporting, employment was estimated at the midpoint of the range indicated, and payroll was estimated at the national average annual wages per employee.
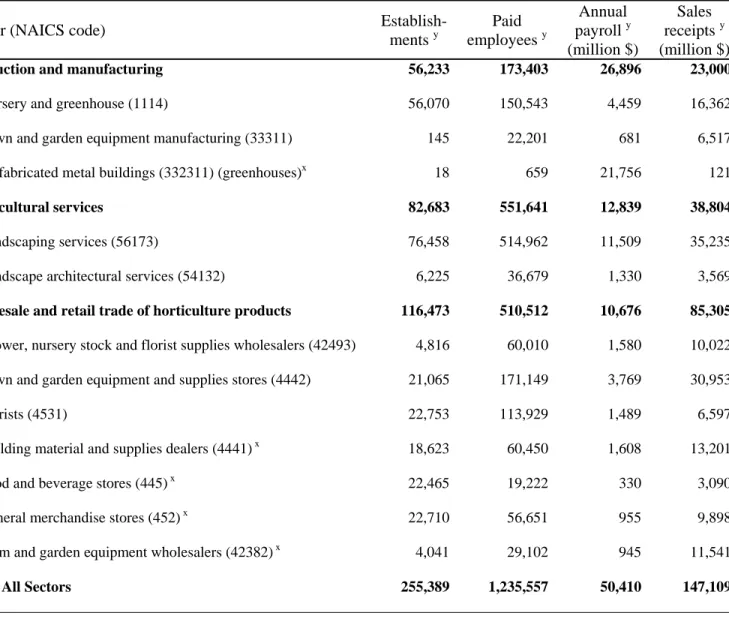
According to census data, the number of establishments, employment, payroll, and sales receipts for sectors of the Green Industry in the United States in 2002 are shown in Table 2. There were a total of 255,389 business establishments involved in the industry, including 56,233 nursery producers or manufacturers, 82,683 horticultural services firms, and 116,473
wholesale/retail trade firms. Total reported employment was 1.085 million employees, and total payroll was $46 billion, excluding the nursery and greenhouse sector. Total sales receipts in 2002 were $147.1 billion, including $23 billion for producers, $38.8 billion for horticultural services, and $85.3 billion for wholesale/retail trade.
Primary market research data regarding the structure and performance of the nursery industry were generated by the fourth national nursery industry survey conducted by the S290 multi-state regional research committee, a group of agricultural economists and horticulturists from 24 land-grant institutions across the country (including the authors of this paper). A total of 44 states participated in this survey. It is through the S290 survey efforts conducted in early 2004 that detailed data regarding sales of urban forest tree species were collected. For the first time in the survey’s history, a standard methodology of obtaining a sample frame was used. The
5
offices responsible for licensing nursery producers. A master file of all certified/licensed nursery operations was compiled at the University of Florida. Two states that had recently completed nursery surveys were excluded (Alabama and Arizona) in addition to four other states that had extremely small nursery numbers (Arkansas, Kansas, Maryland, and Wisconsin). The remaining 44 states resulted in a combined listing of 38,269 certified/licensed nursery operations. Based on considerations of budget and statistical reliability, a sample of 15,888 firms was selected for the survey, with sampling in each state based on its proportion of the overall nursery population. Where information was available on nursery production area, inventory or sales volume, sampling was stratified for three size classes: small (less than 5 acres), medium (5 to 19 acres), and large (20 or more acres). Sampling was weighted on larger firms, with 100% of the large nurseries, 60% of the medium nurseries, and 25% of the small nurseries. In several states, the nursery acreage values were not available, or not available for all certified or licensed operations, and in these states 40% of the identified firms were sampled. The final sample included 3,476 large nurseries, 3,778 in the medium category, 5,996 of the small firms, and 2,338 of unknown size. There were a total of 2,485 usable returned questionnaires returned, representing an overall response rate 15.9%. The number of respondents from individual states ranged from as few as 10 in Nevada to 476 in Florida.
ECONOMIC IMPACT ANALYSIS.To evaluate the broad regional economic impacts of the
Green Industry in the United States, regional economic models were developed for each state using the IMPLAN software system and associated state datasets (MIG, 2004). The IMPLAN system includes over 500 distinct industry sectors. The sectors pertinent to the Green Industry are indicated in Table 3. The information for these models was derived from the U.S. national income and product accounts, together with regional economic data collected by the U.S.
6
Department of Commerce, Bureau of Economic Analysis. Input-output models represent the structure of a regional economy in terms of transactions between industries, employees, households, and government institutions (Miller and Blair, 1985). The IMPLAN data used for this analysis was based on fiscal year 2001.
According to the logic of input-output analysis, changes in local final demand or exports cause a change in direct output or employment, which leads to a corresponding change in the activity of input supply firms (indirect effects), and to changes in employee income and spending (induced effects). The total economic impact is the sum of direct, indirect and induced effects. Economic multipliers derived from the models were used to estimate these effects for the Green Industry in each state. Multipliers represent the multiple of economic activity generated by a unit change in direct output or employment. The regional IMPLAN models were constructed as fully closed models, with all household, government, and capital accounts treated as endogenous, to derive social accounting matrix (SAM) type multipliers, which represent transfer payments as well as earned income. Separate multipliers are provided for output (sales), employment, value added, labor income, and business taxes. The multipliers for output, value added, labor income, and indirect business taxes are expressed in units of dollars per dollar output, while the
employment multiplier is expressed in jobs per million dollars output. The total output
multipliers generally ranged from 1.5 to 2.8. Differences in values of the multipliers reflect the structural linkages of industry sectors, the regional mix of supplier industries, and the size of the regional economy. The multipliers were applied to estimated industry sales or output in order to estimate total economic impacts. For the producer and service sectors, total economic impacts were estimated as:
7
for the wholesale trade sectors, impacts were estimated as:
Ihij= Shi x Gi [ Ahij + Ehi x ( Bhij + Chij)]; and for the retail trade sectors, impacts were estimated as:
Ihij = Shi x Gi [ Ahij + Bhij + Chij], where
Ihij is total impact for measures (j) of output, employment, value added, labor income, or indirect business taxes, in each sector (i), and state (h).
Shi is industry sales in sector i and state h.
Ehi is the proportion of industry sales exported or shipped outside the state, by sector i in state h.
Ahij is the direct effects multiplier for measure j in sector i and state h. Bhij is the indirect effects multiplier for measure j in sector i and state h. Chij is the induced effects multiplier for measure j in sector i and state h. Gi is the gross margin on retail sales for sector i.
The calculation for the producer, wholesale, and service sectors assumes that only the export portion of output is sold to final demand, while the remainder of in-state sales represents
intermediate demand from other business sectors. Therefore, export sales for the production and service sectors are subject to the indirect and induced effects multipliers in a fully closed I-O/SAM model. Local sales do not represent final demand for the production and service sectors, so they are subject only to the direct effects multipliers, however, local sales do represent final demand for the retail sector. Data on exports were taken from the IMPLAN database for 2001 or 1999, except in the case of the nursery and greenhouse sector, where information for some states
8
was taken from the 2003 S290 national nursery survey. For the wholesale and retail trade sectors, output was taken as the gross margin on sales according to national averages: 20.1% for flower and nursery stock wholesalers, 24.7% for general merchandise stores, 26.5% for lawn and garden equipment wholesalers, 28.5% for food and beverage stores, 29.5% for lawn and garden stores, 29.5% for building materials and supply stores, and 42.3% for florists (miscellaneous retailers) (U.S. Census Bureau, 2004l-m).
All results were stated in 2004 dollars by adjusting values using the gross domestic product (GDP) implicit price deflator (U.S. Department of Commerce, 2005).
Results
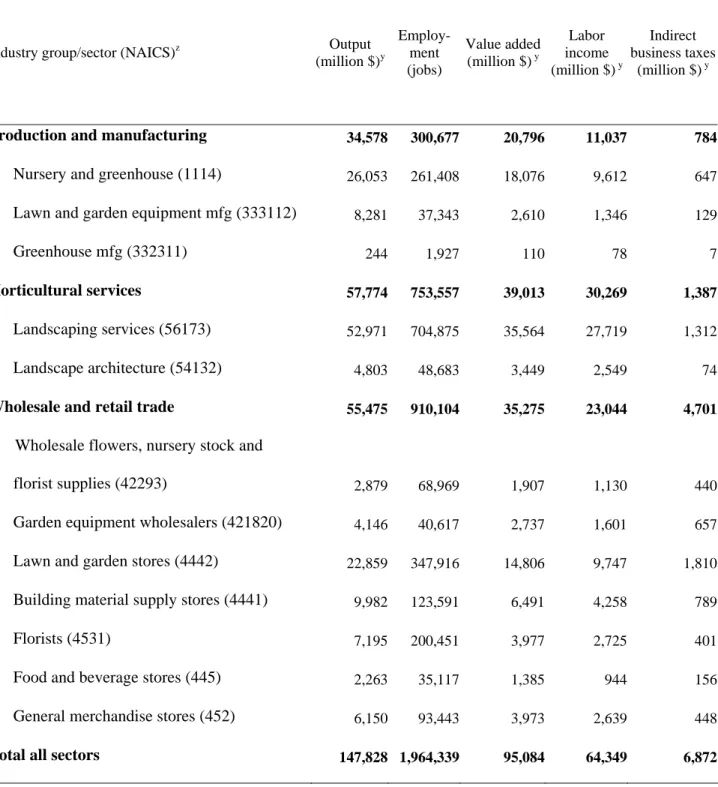
NATIONAL RESULTS. Economic impact estimates for each group and sector of the U.S.
Green Industry are summarized in Table 3. Estimated impacts for all states were $147.8 billion in output, 1,964,339 jobs, $95.1 billion in value added, $64.3 billion in labor income, and $6.9 billion in indirect business taxes. Again, note that values for 2002 were stated in 2004 dollars, which were approximately 4.07% higher. The value added impact represents the net change in value of commodities and services after deducting the cost of inputs purchased from other businesses, and is a broad measure of income generated by the industry. The employment impact estimate includes all jobs, both fulltime and part-time, with no adjustment for a fulltime
equivalent (FTE) basis. The labor or “earned” income impact includes employee wages and salaries and proprietor’s income to business owners.
For the production and manufacturing sectors, including nurseries and greenhouses, lawn and garden equipment manufacturers, and greenhouse manufacturers, total output impacts were $34.6 billion, employment impacts were 300,677 jobs, and value added impacts were $20.8
9
billion. For the horticultural services sectors, including landscape services and landscape architects, total output impacts were $57.8 billion, employment impacts were 753,557 jobs, and value added impacts were $39.0 billion. For the wholesale/retail trade sectors, total output impacts were $55.5 billion, employment impacts were 910,104 jobs, and value added impacts were $35.3 billion.
The largest individual sectors in terms of output impact were landscaping services ($53.0 Billion), nurseries and greenhouses ($26.1 billion), retail lawn and garden stores ($22.9 billion), building material supply stores ($10.0 billion), lawn and garden equipment manufacturers ($8.3 billion), and florists ($7.2 billion). In terms of employment impacts, the largest individual sectors were landscaping services (704,875 jobs), lawn and garden stores (347,916 jobs), nurseries and greenhouses (261,408 jobs), florists (200,451 jobs), and building material supply stores (123,591 jobs). Value added impacts by sectors were as follows: landscaping services ($35.6 billion); nurseries and greenhouses ($18.1 billion); lawn and garden stores ($14.8 billion); building material and supply stores ($6.5 billion); general merchandise stores ($4.0 billion); florists ($4.0 billion); landscape architects ($3.4 billion); lawn and garden equipment manufacturers ($2.6 billion); lawn and garden equipment wholesalers ($2.7 billion); wholesale flower, nursery stock, and florist supplies ($1.9 billion); and food and beverage stores ($1.4 billion).
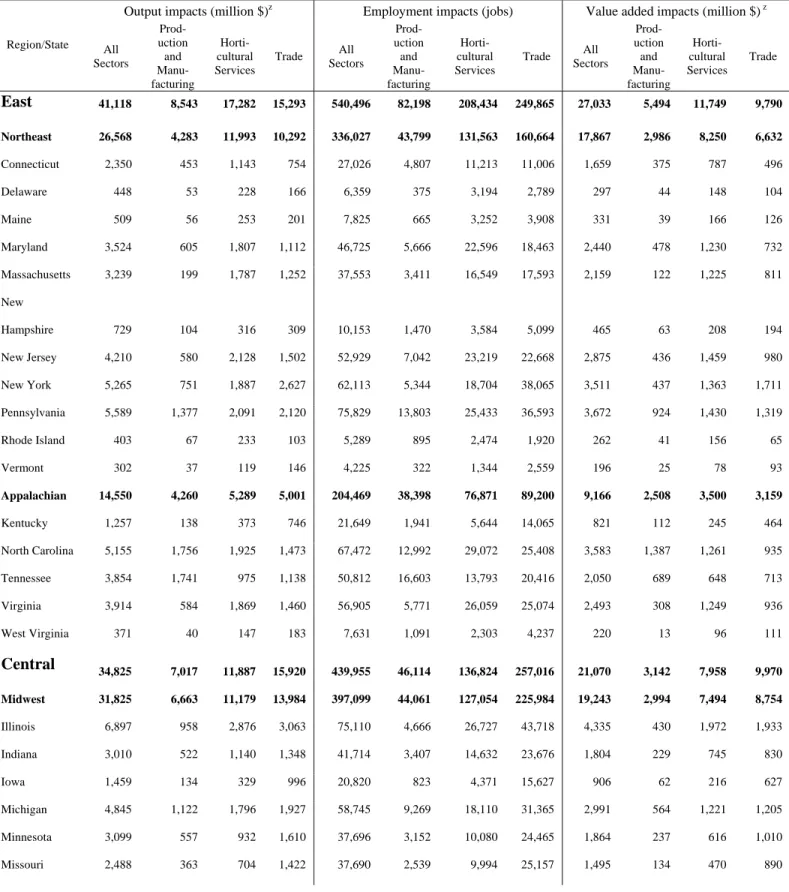
STATE AND REGIONAL RESULTS. Total output, employment, and value added impacts are
summarized by state and region in Table 4. The largest individual states in terms of output impacts, all exceeding $4 billion, were California ($20.4 billion), Florida ($9.9 billion), Texas ($9.7 billion), Illinois ($6.9 billion), Ohio ($5.9 billion), Pennsylvania ($5.6 billion), New York ($5.3 billion), North Carolina ($5.2 billion), Michigan ($4.8 billion), and Georgia ($4.2 billion). The largest individual states in terms of employment, all exceeding 60,000 employees, were
10
California (253,977), Florida (147,795), Texas (140,295), Ohio (79,841), Pennsylvania (75,829), Illinois (75,110), North Carolina (67,472), Georgia (62,493), and New York (62,113). Total value added impacts were largest in the midwestern U.S. region ($19.2 billion), followed by the pacific U.S. region ($18.4 billion), the northeastern U.S. ($17.9 billion), and the southeastern U.S. ($13.5 billion). The largest individual states in terms of value added impacts, all exceeding $3 billion, were California ($13.7 billion), Florida ($7.1 billion), Texas ($6.1 billion), Illinois ($4.3 billion), Pennsylvania ($3.7 billion), New York ($3.5 billion) and Ohio ($3.5 billion).
The Green Industry share of gross state product (GSP) is an important indicator of the relative importance of the industry in each state. In concept, GSP represents total value added of all industry sectors, and is equivalent to its gross output (sales or receipts and other operating income, commodity taxes, and inventory change) minus intermediate inputs purchased from other U.S. industries or imported. Thus, GSP is often considered the state counterpart of the nation's GDP – the broadest measure of the U.S. economy. In the U.S., the total value added of the Green Industry ($95.1 billion) represented slightly less than 1% of the GSP sum of all states ($10,830 billion). The top five states with the highest percentage contribution of the Green Industry to GSP were Oregon (1.7%), Idaho (1.4%), South Carolina (1.4%), Florida (1.3%) and Wisconsin (1.2%).
CONCLUSIONS.Nationwide, the Green Industry generates a total of $147.8 billion in
output or sales, 1.9 million jobs, and $95.1 billion in value-added impacts, including $64.3 billion in labor income and $6.9 billion in indirect business taxes. Results of the study will be beneficial in educating legislators, regulators and the public at large as to the economic importance of the environmental horticulture industry and urban forestry. This research is the first to evaluate the economic impacts of the Green Industry for the entire United States, and it
11
shows how the industry contributes to personal income and job growth in local and regional economies. Also, this work serves to establish a standard methodology for future economic studies of the Green Industry, in terms of the sectors to be considered, information sources, and input-output analysis procedures.
Literature Cited
MIG, Inc. 2004. IMPLAN 2001 50 State Data Package. Stillwater, MN.
MIG, Inc. 1999. IMPLAN Professional Social Accounting and Impact Analysis Software: User’s Guide, Analysis Guide and Data Guide. Stillwater, MN.
Miller, R.E. and P.D. Blair. 1985. Input-output analysis: foundations and extensions. Prentice-Hall, Englewood Cliffs, N.J.
U.S. Census Bureau. 2005a. North American Industrial Classification System, United States. Accessed 15 Jan. 2005. www.census.gov/epcd/www/naics.html
U.S. Census Bureau. 2005b. Prefabricated metal building and component manufacturing, 2002 economic census manufacturing industry series, EC02-311-332311 (RV). U.S. Dept. Commerce, Washington, D.C.
U.S. Census Bureau. 2004a. Architectural, engineering and related services, 2002 economic census professional, scientific and technical services industry series, EC02-541-03. U.S. Dept. Commerce, Washington, D.C.
U.S. Census Bureau. 2004b. Building material and supplies dealers, 2002 economic census retail trade industry series, EC02-441-18. U.S. Dept. Commerce, Washington, D.C.
U.S. Census Bureau. 2004c. Farm, floral and nursery supplies, 2002 economic census wholesale trade industry series, EC02-421-15. U.S. Dept. Commerce, Washington, D.C., Nov. 2004.
U.S. Census Bureau. 2004d. Florists, 2002 economic census retail trade industry series, EC02-441-16. U.S. Dept. Commerce, Washington, D.C.
U.S. Census Bureau. 2004e. Food and beverage stores, 2002 economic census retail trade industry series, EC02-441-07. U.S. Dept. Commerce, Washington, D.C.
U.S. Census Bureau. 2004f. General merchandise stores, 2002 economic census retail trade industry series, EC02-441-11. U.S. Dept. Commerce, Washington, D.C.
U.S. Census Bureau. 2004g. Lawn and garden equipment and supplies stores, 2002 economic census retail trade industry series, EC02-441-08. U.S. Dept. Commerce, Washington, D.C.
12
U.S. Census Bureau. 2004h. Lawn and garden tractor and home lawn and garden equipment
manufacturing, 2002 economic census manufacturing industry series, EC02-311-333112 (RV). U.S. Dept. Commerce, Washington, D.C.
U.S. Census Bureau. 2004i. Machinery, equipment and supplies, 2002 economic census wholesale trade industry series, EC02-421-09. U.S. Dept. Commerce, Washington, D.C.
U.S. Census Bureau. 2004j. Services to buildings and dwellings, 2002 economic census administrative and support and waste management and remedial services industry series, EC02-561-07. U.S. Dept. Commerce, Washington, D.C.
U.S. Census Bureau. 2004k. 2002 County business patterns county and state database on NAICS basis. U.S. Dept. Commerce, Washington, D.C.
U.S. Census Bureau. 2004l. Annual benchmark report for retail trade and food services: January 1992 through February 2004. Current Business Reports BR/03-A. U.S. Dept. Commerce, Washington, D.C.
U.S. Census Bureau. 2004m. Annual benchmark report for wholesale trade: January 1992 through December 2003. Current Business Reports BW/03-A. U.S. Dept. Commerce, Washington, D.C. U.S. Census Bureau. 2004n. Annual estimates of the population for the U.S. and states and Puerto Rico:
April 1, 2000 to July 1, 2004. (NST-EST2004-01). Population Division, Washington, D.C. U.S. Department of Agriculture National Agricultural Statistics Service. 2004a. 2002 Census of
agriculture, U.S. summary and state geographic area series. U.S. Dept. Agr., Washington, D.C. U.S. Department of Agriculture National Agricultural Statistics Service. 2004b. Floriculture crops 2003
summary. U.S. Dept. Agr., Washington, D.C.
U.S. Department of Agriculture National Agricultural Statistics Service, 2004c. Nursery Crops 2003 Summary. U.S. Dept. Agr., Washington, D.C.
U.S. Department of Commerce. 2005. Gross domestic product implicit price deflator, 1970-2004, annual. Bureau of Economic Analysis, Washington, D.C.
13
Table 1. Classification of economic sectors associated with the Green Industry as defined
by the North American Industrial Classification System (NAICS)and IMPLAN.
Industry sector
NAICS
codez
IMPLAN sector (number)y
Nursery and greenhouse 1114 Nursery and greenhouse (6)
Lawn and garden equipment mfg 333112 Lawn and garden equipment mfg (258) Greenhouse Manufacturing x 332311 Prefabricated Metal Building and
Component Mfg. (232)
Landscaping services 56173 Services to buildings and dwellings (458) Landscape architectural services 54132 Architectural and engineering services (439) Flower, nursery stock and florist supplies
wholesalers
42493 Wholesale trade (390)
Lawn and garden equipment and supplies stores
4442 Building material and garden supply stores (404)
Florists 4531 Miscellaneous store retailers (411)
Building material and supplies dealers x 4441 Building material and garden supply stores (404)
Food and beverage stores x 445 Food and beverage stores (405) General merchandise stores x 452 General merchandise stores (410) Farm and garden machinery and equipment
wholesalers x
421820 Wholesale trade (390) Z
The North American Industrial Classification System (NAICS) replaced the Standard Industrial Classification (SIC) coding system and uses a six digit hierarchical coding system to classify all economic activity into twenty industry sectors. Five sectors are mainly goods-producing sectors and fifteen are entirely services-producing sectors. This six digit hierarchical structure allows greater coding flexibility than the four digit structure of the SIC. NAICS allows for the identification of 1,170 industries compared to the 1,004 found in the SIC system.
y
IMPLAN classifies business according to 509 industrial sectors that are typically 5 digit NAICS in manufacturing and 2-4 digit NAICS for other sectors.
x
Businesses are classified according to primary business activity. Thus, merchandise or product line sales of horticultural goods represents a portion of overall business of the sectors indicated.
14
Table 2. Number of establishments, employment, payroll, and sales receipts in the U.S.
Green Industry (also known as the environmental horticulture industry), by sector, 2002.
Sector (NAICS code)
Establish-ments y Paid employees y Annual payroll y (million $) Sales receipts y (million $)
Production and manufacturing 56,233 173,403 26,896 23,000
Nursery and greenhouse (1114) 56,070 150,543 4,459 16,362
Lawn and garden equipment manufacturing (33311) 145 22,201 681 6,517
Prefabricated metal buildings (332311) (greenhouses)x 18 659 21,756 121
Horticultural services 82,683 551,641 12,839 38,804
Landscaping services (56173) 76,458 514,962 11,509 35,235
Landscape architectural services (54132) 6,225 36,679 1,330 3,569
Wholesale and retail trade of horticulture products 116,473 510,512 10,676 85,305
Flower, nursery stock and florist supplies wholesalers (42493) 4,816 60,010 1,580 10,022
Lawn and garden equipment and supplies stores (4442) 21,065 171,149 3,769 30,953
Florists (4531) 22,753 113,929 1,489 6,597
Building material and supplies dealers (4441) x 18,623 60,450 1,608 13,201
Food and beverage stores (445) x 22,465 19,222 330 3,090
General merchandise stores (452) x 22,710 56,651 955 9,898
Farm and garden equipment wholesalers (42382) x 4,041 29,102 945 11,541
Total All Sectors 255,389 1,235,557 50,410 147,109
z
The North American Industrial Classification System (NAICS) replaced the Standard Industrial Classification (SIC) coding system and uses a six digit hierarchical coding system to classify all economic activity into twenty industry sectors. Five sectors are mainly goods-producing sectors and fifteen are entirely services-producing sectors. This six digit hierarchical structure allows greater coding flexibility than the four digit structure of the SIC. NAICS allows for the identification of 1,170 industries compared to the 1,004 found in the SIC system. y
Data sources: U.S. Census Bureau, 2004a-j; U.S. Department of Agriculture, 2004a; MIG, 2004.
x Payroll and employment estimated in proportion to merchandise line sales as share of total sales: 6% for building materials and supplies dealers, 1% for food and beverage stores, 2% for general merchandise stores, 2% for prefabricated metal buildings, 27% for farm and garden equipment wholesalers.
15
Table 3. Economic impacts of the U.S. Green Industry (also known as the environmental
horticulture industry), by sector, 2002.
Industry group/sector (NAICS)z Output
(million $)y Employ-ment (jobs) Value added (million $) y Labor income (million $) y Indirect business taxes (million $) y
Production and manufacturing 34,578 300,677 20,796 11,037 784
Nursery and greenhouse (1114) 26,053 261,408 18,076 9,612 647 Lawn and garden equipment mfg (333112) 8,281 37,343 2,610 1,346 129
Greenhouse mfg (332311) 244 1,927 110 78 7
Horticultural services 57,774 753,557 39,013 30,269 1,387
Landscaping services (56173) 52,971 704,875 35,564 27,719 1,312 Landscape architecture (54132) 4,803 48,683 3,449 2,549 74
Wholesale and retail trade 55,475 910,104 35,275 23,044 4,701
Wholesale flowers, nursery stock and
florist supplies (42293) 2,879 68,969 1,907 1,130 440 Garden equipment wholesalers (421820) 4,146 40,617 2,737 1,601 657 Lawn and garden stores (4442) 22,859 347,916 14,806 9,747 1,810 Building material supply stores (4441) 9,982 123,591 6,491 4,258 789
Florists (4531) 7,195 200,451 3,977 2,725 401
Food and beverage stores (445) 2,263 35,117 1,385 944 156 General merchandise stores (452) 6,150 93,443 3,973 2,639 448
16 z
The North American Industrial Classification System (NAICS) replaced the Standard Industrial
Classification (SIC) coding system and uses a six digit hierarchical coding system to classify all economic activity into twenty industry sectors. Five sectors are mainly goods-producing sectors and fifteen are entirely services-producing sectors. This six digit hierarchical structure allows greater coding flexibility than the four digit structure of the SIC. NAICS allows for the identification of 1,170 industries compared to the 1,004 found in the SIC system.
y
Values expressed in 2004 dollars using gross domestic product (GDP) implicit price deflator, an economic metric that accounts for inflation by converting output measured at current prices into constant-dollar GDP. The GDP deflator shows how much a change in the base year's GDP relies upon changes in the price level. Also known as the "GDP implicit price deflator." (U.S. Dept. Commerce, 2005).
17
Table 4. Economic impacts of the U.S. Green Industry (also known as the environmental
horticulture industry) by state/region and industry group, 2002.
Output impacts (million $)z Employment impacts (jobs) Value added impacts (million $) z
Region/State All Sectors Prod-uction and Manu-facturing Horti-cultural Services Trade All Sectors Prod-uction and Manu-facturing Horti-cultural Services Trade All Sectors Prod-uction and Manu-facturing Horti-cultural Services Trade East 41,118 8,543 17,282 15,293 540,496 82,198 208,434 249,865 27,033 5,494 11,749 9,790 Northeast 26,568 4,283 11,993 10,292 336,027 43,799 131,563 160,664 17,867 2,986 8,250 6,632 Connecticut 2,350 453 1,143 754 27,026 4,807 11,213 11,006 1,659 375 787 496 Delaware 448 53 228 166 6,359 375 3,194 2,789 297 44 148 104 Maine 509 56 253 201 7,825 665 3,252 3,908 331 39 166 126 Maryland 3,524 605 1,807 1,112 46,725 5,666 22,596 18,463 2,440 478 1,230 732 Massachusetts 3,239 199 1,787 1,252 37,553 3,411 16,549 17,593 2,159 122 1,225 811 New Hampshire 729 104 316 309 10,153 1,470 3,584 5,099 465 63 208 194 New Jersey 4,210 580 2,128 1,502 52,929 7,042 23,219 22,668 2,875 436 1,459 980 New York 5,265 751 1,887 2,627 62,113 5,344 18,704 38,065 3,511 437 1,363 1,711 Pennsylvania 5,589 1,377 2,091 2,120 75,829 13,803 25,433 36,593 3,672 924 1,430 1,319 Rhode Island 403 67 233 103 5,289 895 2,474 1,920 262 41 156 65 Vermont 302 37 119 146 4,225 322 1,344 2,559 196 25 78 93 Appalachian 14,550 4,260 5,289 5,001 204,469 38,398 76,871 89,200 9,166 2,508 3,500 3,159 Kentucky 1,257 138 373 746 21,649 1,941 5,644 14,065 821 112 245 464 North Carolina 5,155 1,756 1,925 1,473 67,472 12,992 29,072 25,408 3,583 1,387 1,261 935 Tennessee 3,854 1,741 975 1,138 50,812 16,603 13,793 20,416 2,050 689 648 713 Virginia 3,914 584 1,869 1,460 56,905 5,771 26,059 25,074 2,493 308 1,249 936 West Virginia 371 40 147 183 7,631 1,091 2,303 4,237 220 13 96 111 Central 34,825 7,017 11,887 15,920 439,955 46,114 136,824 257,016 21,070 3,142 7,958 9,970 Midwest 31,825 6,663 11,179 13,984 397,099 44,061 127,054 225,984 19,243 2,994 7,494 8,754 Illinois 6,897 958 2,876 3,063 75,110 4,666 26,727 43,718 4,335 430 1,972 1,933 Indiana 3,010 522 1,140 1,348 41,714 3,407 14,632 23,676 1,804 229 745 830 Iowa 1,459 134 329 996 20,820 823 4,371 15,627 906 62 216 627 Michigan 4,845 1,122 1,796 1,927 58,745 9,269 18,110 31,365 2,991 564 1,221 1,205 Minnesota 3,099 557 932 1,610 37,696 3,152 10,080 24,465 1,864 237 616 1,010 Missouri 2,488 363 704 1,422 37,690 2,539 9,994 25,157 1,495 134 470 890
18
Output impacts (million $)z Employment impacts (jobs) Value added impacts (million $) z
Region/State All Sectors Prod-uction and Manu-facturing Horti-cultural Services Trade All Sectors Prod-uction and Manu-facturing Horti-cultural Services Trade All Sectors Prod-uction and Manu-facturing Horti-cultural Services Trade Ohio 5,855 1,303 2,354 2,198 79,841 10,077 31,493 38,271 3,532 607 1,556 1,369 Wisconsin 4,170 1,704 1,046 1,420 45,483 10,130 11,647 23,706 2,317 731 697 890 Great Plains 2,999 355 708 1,936 42,855 2,053 9,770 31,032 1,827 147 463 1,216 Kansas 1,362 231 417 714 19,316 1,395 5,837 12,084 813 93 274 446 Nebraska 961 75 214 672 13,383 385 2,783 10,215 596 32 141 424 North Dakota 307 22 32 254 4,500 138 452 3,910 189 9 21 160 South Dakota 369 27 46 297 5,657 135 699 4,823 228 13 28 187 South 34,559 10,189 12,270 12,100 498,420 93,753 188,420 216,247 22,150 6,301 8,194 7,656 Southcentral 13,992 3,644 4,601 5,746 209,935 36,629 70,909 102,397 8,615 1,974 3,039 3,602 Arkansas 1,395 628 255 513 16,680 3,349 4,135 9,197 675 195 166 315 Louisiana 1,069 157 265 647 19,617 1,762 4,785 13,070 679 100 173 406 New Mexico 520 87 207 226 8,739 660 3,437 4,642 353 72 137 145 Oklahoma 1,352 449 322 580 24,603 5,498 7,158 11,947 819 247 212 359 Texas 9,656 2,324 3,551 3,781 140,295 25,360 51,394 63,541 6,088 1,360 2,351 2,377 Southeast 20,568 6,545 7,669 6,354 288,486 57,124 117,511 113,850 13,535 4,327 5,155 4,054 Alabama 1,681 437 668 576 26,804 4,521 10,617 11,666 1,148 353 434 360 Florida 9,997 3,025 4,051 2,921 147,795 32,966 62,632 52,197 7,076 2,463 2,747 1,866 Georgia 4,726 1,143 1,782 1,800 62,493 7,362 25,620 29,511 3,020 644 1,213 1,162 Mississippi 977 296 190 491 14,236 1,789 3,309 9,138 548 120 122 306 South Carolina 3,187 1,644 978 565 37,157 10,486 15,333 11,337 1,745 747 638 359 West 37,326 8,829 16,335 12,162 485,467 78,612 219,879 186,976 24,830 5,859 11,112 7,859 Mountain 9,824 1,473 4,750 3,601 132,982 10,557 64,279 58,146 6,449 954 3,185 2,309 Arizona 3,206 826 1,508 873 43,882 5,796 23,198 14,888 2,081 506 1,013 563 Colorado 3,085 294 1,612 1,179 37,630 1,554 19,059 17,017 2,019 178 1,083 758 Idaho 853 107 250 496 12,000 923 3,534 7,543 576 91 164 320 Montana 357 57 68 232 5,988 492 931 4,564 219 31 43 145 Nevada 1,248 16 929 303 17,324 121 12,433 4,770 844 13 633 198 Utah 901 165 316 420 13,577 1,614 4,388 7,575 600 130 206 264 Wyoming 174 8 68 98 2,581 57 736 1,788 109 4 44 61 Pacific 27,502 7,356 11,585 8,561 352,485 68,055 155,600 128,830 18,382 4,905 7,927 5,550 Alaska 159 18 53 88 2,110 146 467 1,497 104 10 36 58
19
Output impacts (million $)z Employment impacts (jobs) Value added impacts (million $) z
Region/State All Sectors Prod-uction and Manu-facturing Horti-cultural Services Trade All Sectors Prod-uction and Manu-facturing Horti-cultural Services Trade All Sectors Prod-uction and Manu-facturing Horti-cultural Services Trade California 20,362 4,736 9,371 6,255 253,977 36,236 126,428 91,313 13,656 3,165 6,429 4,063 Hawaii 745 254 320 171 11,166 3,394 4,492 3,281 531 200 220 112 Oregon 3,173 1,711 660 802 43,980 21,632 9,171 13,177 2,010 1,048 448 515 Washington 3,064 636 1,181 1,246 41,251 6,647 15,042 19,561 2,080 482 795 803 Total all regions 147,828 34,578 57,774 55,475 1,964,339 300,677 753,557 910,104 95,084 20,796 39,013 35,275 z
Values expressed in 2004 dollars using gross domestic product (GDP) implicit price deflator, an economic metric
that accounts for inflation by converting output measured at current prices into constant-dollar GDP. The GDP deflator shows how much a change in the base year's GDP relies upon changes in the price level. Also known as the "GDP implicit price deflator." (U.S. Dept. Commerce, 2005).