©2007 ASHRAE. 435 ABSTRACT
Indoor moisture and temperature conditions and equip-ment operation were measured and analyzed for 43 homes in warm-humid and mixed-humid climate regions of the United States. A range of house and mechanical system types were evaluated, including standard building enclosures and cooling systems and high-performance building envelopes with enhanced cooling or supplemental dehumidification systems. Conventional cooling systems in standard houses usually provide reasonable humidity control (below 60% RH) in midsummer. However, high humidity levels are observed at times when cooling loads are modest. The addition of contin-uous mechanical ventilation to standard houses in humid climates did not consistently increase indoor humidity levels. Indoor humidity levels were highest in high-performance, low sensible heat gain homes with mechanical ventilation. In these homes, the temperature balance point is higher, so there are many hours when sensible cooling is not required yet there are still significant moisture loads from internal sources and venti-lation. These homes often require a separate dehumidifier to maintain space humidity in the swing seasons and at night when the thermostat is satisfied. The use of supplemental dehu-midification in a high-performance house enables the imple-mentation of efficiency improvements that significantly reduce sensible cooling demand while still maintaining proper humid-ity levels.
INTRODUCTION
The overall goal of the USDOE Building America resi-dential research program is to reduce average whole house energy use in new residential buildings from 30% to 90% by 2020, including homes that achieve zero net energy use on an
annual basis. High-performance air-conditioning equipment and control systems that match the high performance of Build-ing America envelopes are necessary to meet these energy performance targets. Conditioning systems with integrated mechanical ventilation and year-round temperature and humidity control are a prerequisite.
Common improvement measures used to achieve high-performance building goals generally affect the sensible cool-ing load far more than the latent coolcool-ing load. For example,
adding insulation, low solar gain windows, Energy Star®
appliances, and fluorescent lighting all reduce heat gain to the conditioned space but do nothing to reduce the latent (mois-ture) gain. In hot-humid climates, reducing building air leak-age and duct leakleak-age (or moving ducts inside the conditioned space) has a large beneficial effect on reducing the latent and sensible cooling load. While the benefit of air tightening is significant, there is a limit to the benefit if year-round mechan-ical ventilation is used to meet ASHRAE 62.2 requirements (ASHRAE 2004a).
Modeling has pointed to the problem of maintaining indoor relative humidity in residences below 60% all year in humid climates (Trowbridge et al. 1994). Testing of high-performance homes over the last few years has shown that adequate humidity control is difficult to achieve throughout the year without supplemental dehumidification (Rudd et al. 2005). Conventional cooling equipment is capable of meeting the sensible and latent loads—and maintaining acceptable humidity levels—at design conditions (i.e., hottest times of the day). However, high humidity levels are typically observed at part-load conditions when sensible cooling loads are modest or nonexistent. At these times, moisture loads due to internal gains and ventilation remain high even though the sensible
Monitored Indoor
Moisture and Temperature Conditions
in Humid-Climate US Residences
Armin Rudd
Hugh I. Henderson, Jr., PE
Member ASHRAE Member ASHRAE
Armin Rudd is principal research engineer at Building Science Corporation, Westford, MA. Hugh Henderson is principal at CDH Energy Corporation, Cazenovia, NY.
DA-07-046
©2007, American Society of Heating, Refrigerating and Air-Conditioning Engineers, Inc. (www.ashrae.org). Published in ASHRAE Transactions, Volume 113, Part 1. For personal use only. Additional reproduction, distribution, or transmission in either print or digital form is not permitted without ASHRAE’s prior written permission.
loads go to zero, and comfort control may not be achieved (Henderson et al. 1992). High-performance homes have greatly reduced sensible loads in the space, further exacerbat-ing this problem. In many cases, latent loads occur at times when no sensible cooling is required (i.e., the thermostat is satisfied). Humidity control during these periods requires dehumidification that can be provided separate from sensible cooling. Conventional cooling equipment is not well suited to meeting these loads.
Most cooling equipment needs to operate for at least 10 to 15 minutes at a time to begin to operate efficiently and remove much moisture (Shirey and Henderson 2004). Typical over-sizing compounds the indoor moisture control problem by causing short on-time cycles (ACCA 2004). Several types of space-conditioning equipment and control enhancements have been proposed and used to address the need for better part-load dehumidification.
Several equipment manufacturers offer equipment with enhanced moisture removal at part load. These systems typi-cally vary blower speed, operate at lower compressor stages, or lower cooling setpoints to provide more dehumidification. The increasing use of variable-speed fan motors, lower-cost humidity sensors, and embedded electronic controls in higher-end cooling systems have made these control approaches prac-tical. Typical control algorithms lower airflow at low-load conditions to reduce coil temperatures and provide more mois-ture removal (Krakow et al. 1995; Andrade and Bullard 2002). While these enhanced control approaches can increase the proportion of total cooling capacity that is provided as latent, they do not allow moisture removal to be provided separately from sensible cooling.
Stand-alone dehumidifier appliances are widely avail-able to meet latent loads and provide humidity control. These systems add sensible heat to the space as they remove moisture, which some may perceive as inefficient. These stand-alone appliances can dehumidify a room but can only indirectly provide whole-house dehumidification, assuming distribution is accomplished via operation of the central air distribution system. To address this concern, some manu-facturers are now offering ducted dehumidifiers to provide better air distribution throughout the house.
Enthalpy recovery ventilation units temper incoming ventilation air. They cannot strictly dehumidify a space, but can lessen the incoming ventilation load by exchanging heat and moisture between the exhaust and ventilation airstreams. This equipment has the greatest effect at times when the outdoor enthalpy is high. At part-load conditions, enthalpy exchangers have little moisture control effect, since the dew point of the incoming ventilation air can only approach (but not be lower than) the space dew point.
This paper presents measured space humidity data from a variety of standard and high-performance homes that use conventional cooling equipment as well as the types of HVAC systems mentioned above. The results confirm that humidity is usually maintained below 60% RH at design or peak load
conditions. However, high humidity typically occurs at part-load conditions when sensible cooling part-loads are low or non-existent. This paper seeks to understand and explain the effect that building envelope performance and HVAC system config-uration had on humidity levels in these homes.
STUDY APPROACH
To better understand moisture control dynamics in homes, indoor temperature and humidity data were collected from several test houses as part of the USDOE Building Amer-ica Program. Data were collected at 43 houses from May 2000 through February 2005. The houses are located in various climate regions, including the hot-humid cities of Houston, Austin, Dallas, Jacksonville, Fort Meyers, and Orlando, as well as less humid areas such as Oklahoma City.
The data set included “high-performance” houses that were designed and built to Building America standards as well as standard houses that were monitored to establish a baseline. Some of the houses included enhanced air condi-tioners, dehumidifiers, or energy recovery ventilators (ERVs). Most houses also included an explicit means to deliver ventilation air to the space.
Battery-powered temperature and relative humidity data-loggers were placed in various locations in the conditioned space and attic at each home. At some sites, additional data-loggers were installed to record the runtime or status of the cooling, heating, dehumidification, and ventilation systems. All dataloggers were programmed to collect data at hourly intervals. Data collection continued for periods ranging from several months to over a year at each site.
The data collected from the test homes were analyzed to understand when and why high humidity occurs. The analysis also evaluates how closely high humidity and the need for dehumidification correspond to cooling operation.
House and System Characteristics
The study includes three types of building envelopes:
• standard-performance design (e.g., standard builder
practice)
• medium-performance design (e.g., Energy Star® home)
• high-performance design (e.g., Building America)
Tables 1 and 2 summarize the characteristics of the tested homes and their HVAC systems. The homes identified as STD in the tables are standard home designs, while the high-perfor-mance Building America or Energy Star® designs are identi-fied with BA and ES, respectively. The high-performance Building America homes were built to an airtightness standard of 0.25 cfm/ft2 (1.27 L/s⋅m2) of building enclosure area at 0.20 in. w.c. (50 Pa) (pressure differential (same as 2.5 in.2 of equivalent leakage area per 100 ft2 of building enclosure area [1.74 cm2/m2]). The standard houses typically had at least 50% more leakage and the medium-performance houses were generally in between. As is becoming more commonplace, the builders of all the houses understood the importance of duct
ASHRAE Transactions 437
leakage and addressed it in some way. Many of the duct systems were tested for leakage. Those that were not tested were inspected to make sure they did not have obvious flaws. Some of the standard houses had duct leakage less than 6% of total fan flow to outdoors. All were expected to have less than
10% leakage. All of the medium- and high-performance houses were enrolled in an Energy Star duct leakage sampling protocol with test criteria of less than 5% duct leakage to outside. The standard and medium-performance houses had the air handler and ducts in the attic, with the exception of the
Table 1. Description of Homes—Builder 1
# House Type1,2 Builder No./ City Stories Floor Area (ft2) AHU/ Duct Location Whole-House Ventilation Cooling System # AHUs/Type Dehumidification Equipment3
1 BA 1/Houston 2 2386 inside CFI 1/Std Stand-alone DH, Closet
2 BA 1/Houston 2 2397 inside CFI 1/Std Stand-alone DH, Closet
3 BA 1/Houston 2 2397 inside CFI 1/Std Stand-alone DH, Attic
4 BA 1/Houston 2 2448 inside CFI 1/Std Stand-alone DH, Attic
5 BA 1/Houston 1 2100 inside thru DH 1/Std Ventilating Ducted DH
6 BA 1/Houston 2 2448 inside thru DH 1/Std Ventilating Ducted DH
7 BA 1/Houston 2 2397 inside thru DH 1/Std Ventilating Ducted DH
8 BA 1/Houston 1 1830 inside thru DH box 1/Std DH in Ducted Box
9 BA 1/Houston 1 2100 inside thru DH box 1/Std DH in Ducted Box
10 BA 1/Houston 2 2386 inside thru DH box 1/Std DH in Ducted Box
11 BA 1/Houston 1 1830 inside ERV 1/Std ERV
12 BA 1/Houston 1 2197 inside ERV 1/Std ERV
13 BA 1/Houston 2 2448 inside ERV 1/Std ERV
14 BA 1/Houston 1 2197 inside CFI 1/2-Stage
w/ECM blower none
15 BA 1/Houston 2 2386 inside CFI 1/Std none
16 BA 1/Houston 1 2197 inside CFI 1/Std none
17 BA 1/Houston 2 2386 inside CFI 1/Std none
18 STD 1/Houston 2 2448 attic none 1/Std none
19 STD 1/Houston 1 2197 attic none 1/Std none
20 STD 1/Houston 2 ~3000 attic none 2/Std none
21 BA 1/Jacksonville 1 ~2500 inside CFI 1/Std Stand-alone DH, Closet
22 BA 1/Jacksonville 2 ~2800 inside CFI 1/Std Stand-alone DH, Closet
23 STD 1/Ft. Myers 1 ~2000 gar/attic none 1/Std none
24 STD 1/Ft. Myers 1 ~2000 gar/attic none 1/Std none
Notes:
1-Homes 1-17, 21-22 are high-performance with unvented/conditioned attic, ducts in conditioned space, roof insulation, shingle roof. (Home 22 has vented attic, BUT with ducts in conditioned space.)
2-Homes 18-20, 23-24 are std-performance with vented attic, ducts in attic, ceiling insulation, shingle roof 18-20, tile roof 23-24 3-Stand-alone dehumidifiers are 50 pint/day (23.7 L/day) units.
Ft. Meyers houses, which had the air handler in the garage. All of the high-performance houses had all ducts and the air handler inside conditioned space.
Most of the homes used a central-fan-integrated (CFI) supply ventilation system with a dedicated controller for fan and motorized damper control. This system configuration is shown in Figure 1. The fan controller periodically activated the outdoor air damper and AHU supply fan when ventilation was required based on the programmed timer settings. If the central supply fan had not run in 20 minutes due to a call for heating or cooling, the fan operated alone for 10 minutes to provide ventilation and circulation (a 33% duty cycle). The system also closed the outside air damper if cooling or heating operation provided 20 minutes of ventilation for the hour. As
a result, a consistent amount of ventilation was provided regardless of heating or cooling load.
For some of the HVAC systems in the study, ventilation was provided by a separate means. In these cases, fan control was still used to provide adequate mixing in the home. Several types of dehumidification or HVAC system enhancements were used at the homes, including:
• Stand-Alone DH, Closet. A conventional stand-alone 50 pint/day (23.7 L/day) dehumidifier (DH) was located in a closet, with a louvered door, near the central return air grille for the house. The relative humidity controller was located on the unit. About 20 cfm (9.4 L/s) of venti-lation is provided by a CFI system (60 cfm [28.3 L/s] × 33% of time).
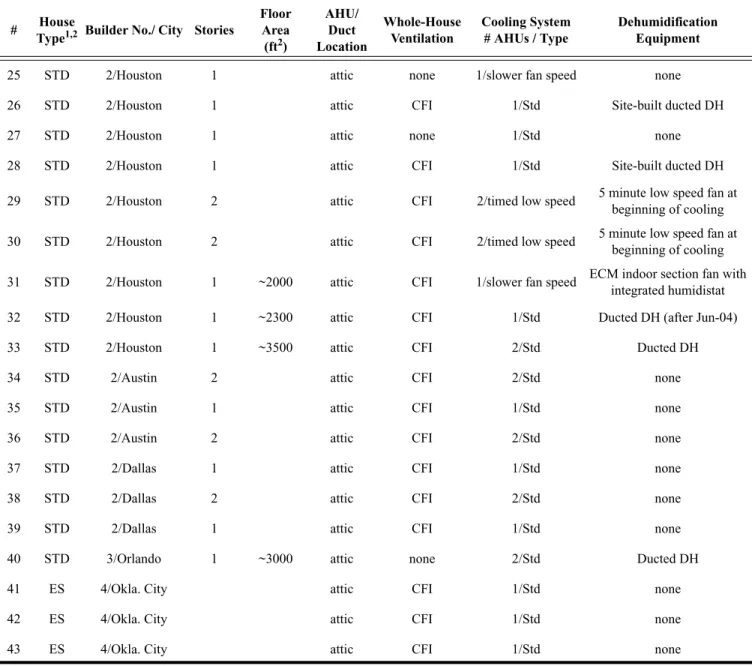
Table 2. Description of Homes—Builders 2, 3, and 4
# House
Type1,2 Builder No./ City Stories
Floor Area (ft2) AHU/ Duct Location Whole-House Ventilation Cooling System # AHUs / Type Dehumidification Equipment
25 STD 2/Houston 1 attic none 1/slower fan speed none
26 STD 2/Houston 1 attic CFI 1/Std Site-built ducted DH
27 STD 2/Houston 1 attic none 1/Std none
28 STD 2/Houston 1 attic CFI 1/Std Site-built ducted DH
29 STD 2/Houston 2 attic CFI 2/timed low speed 5 minute low speed fan at
beginning of cooling
30 STD 2/Houston 2 attic CFI 2/timed low speed 5 minute low speed fan at
beginning of cooling
31 STD 2/Houston 1 ~2000 attic CFI 1/slower fan speed ECM indoor section fan with
integrated humidistat
32 STD 2/Houston 1 ~2300 attic CFI 1/Std Ducted DH (after Jun-04)
33 STD 2/Houston 1 ~3500 attic CFI 2/Std Ducted DH
34 STD 2/Austin 2 attic CFI 2/Std none
35 STD 2/Austin 1 attic CFI 1/Std none
36 STD 2/Austin 2 attic CFI 2/Std none
37 STD 2/Dallas 1 attic CFI 1/Std none
38 STD 2/Dallas 2 attic CFI 2/Std none
39 STD 2/Dallas 1 attic CFI 1/Std none
40 STD 3/Orlando 1 ~3000 attic none 2/Std Ducted DH
41 ES 4/Okla. City attic CFI 1/Std none
42 ES 4/Okla. City attic CFI 1/Std none
43 ES 4/Okla. City attic CFI 1/Std none
Notes:
1- Homes 25-40 are all std-performance with vented attic, ceiling insulation, ducts in attic, shingle roof.
ASHRAE Transactions 439
• Stand-Alone DH, Attic. A conventional stand-alone 50 pint/day (23.7 L/day) dehumidifier was located in the attic (which was a conditioned space at these sites). The relative humidity controller was located on the unit. A small branch off the main return duct pulled dehumidi-fied air from near the DH unit to supply the entire house. About 20 cfm (9.4 L/s) of ventilation was provided by a CFI system (60 cfm [28.3 L/s] × 33% of time).
• Ventilating Ducted DH. This was a more efficient 100 pint/day (47 L/day) dehumidifier that mixed about 40 cfm (18.9 L/s) of ventilation air with 120 cfm (56.6 L/s) of air from the living space. Return and fresh air were mixed to avoid introducing high dew-point air directly into cool central supply ducts. The dehumidifier unit discharged into the main central supply duct. The uninsulated unit was located in the conditioned attic. The relative humidity controller was located next to the thermostat or on the unit. The central air-handler unit (AHU) supply fan was set to cycle on at a 17% duty cycle (ON for 10 minutes if it has been off for 50 min-utes) to provide good air distribution in the home. • DH in Ducted Box. A conventional 50 pint/day
(23.7 L/day) stand-alone dehumidifier was installed in a sheet metal box in the conditioned attic. A ventila-tion/filtration system continuously mixed about 40 cfm (18.9 L/s) of ventilation air with 120 cfm (56.6 L/s) of living space air. That air discharged through the metal box containing the dehumidifier then into the main central supply duct. The relative humidity controller was located on the dehumidifier unit. The AHU supply fan was set to cycle on at a 17% duty cycle (ON for 10 minutes if it has been off for 50 minutes) to provide good air distribution in the home.
• ERV. An energy/enthalpy recovery ventilator exchanged
heat and moisture between exhaust and ventilation
air-streams. The ERV continuously supplied and exhausted 40 cfm (18.9 L/s). The tempered fresh air was dis-charged into the main central return duct. The AHU sup-ply fan was set to cycle on at a 17% duty cycle to provide good air distribution in the home.
• Site-Built Ducted DH. This was a conventional 50 pint/ day (23.7 L/day) dehumidifier with a plastic blower wheel that was installed in a sheet metal cabinet. The insulated metal cabinet that enclosed the dehumidifier was located in the standard vented attic and was ducted to and from the living space. The relative humidity con-troller was located next to the thermostat.
• Ducted DH. This was a more efficient, factory-built, 90 pint/day (42.6 L/day) ducted dehumidifier with an internal blower able to overcome the static pressure of a central duct system. The insulated unit was installed in the standard vented attic, drawing air from the living space and supplying dehumidified air into the central sys-tem supply trunk. The dew-point sys-temperature controller was located next to the thermostat or in the dehumidifier return air duct.
• Enhanced AC. An air-conditioning unit with enhanced dehumidification features. These systems were either (1) two-stage cooling systems with variable-speed sup-ply fans and controls to reduce the blower speed and depress the cooling setpoint when humidity was high, (2) single-stage systems with controls to reduce the blower speed and depress the cooling setpoint when humidity was high, or (3) single-stage systems that reduced blower speed for the first few minutes of the compressor on cycle.
Whether continuous or intermittent, 20 to 40 cfm on aver-age was continuously provided by each system described Figure 1 Schematic of central-fan-integrated supply ventilation system.
above. These continuous ventilation rates were less than the 50 to 65 cfm (23.6 to 30.7 L/s) specified by ASHRAE Standard 62.2 (50 cfm [23.6 L/s] for a 2000 ft2 (260 m2) house with three bedrooms; 65 cfm (30.7 L/s) for a 2800 ft2 (185.8 m2) home with four bedrooms [ASHRAE 2004a]).
Data Collection
Temperature and humidity conditions were measured at all the sites in one to four zones in the conditioned space (Table 3). Ambient conditions and conditions in the attic were also recorded at some sites. Typically, battery-powered dataloggers were used. Other dataloggers and status sensors were installed to measure the runtime of heating, cooling, and dehumidifica-tion equipment at 27 of the 43 sites. Table 3 lists the parameters that were measured at each site.
RESULTS
The data from the sites were analyzed to categorize the measured relative humidity (RH) and temperature readings into groupings that would facilitate an understanding of when, how often, and how long relative humidity conditions existed at each site. A series of tables and graphs were generated for each site for every humidity level between 50% and 70% RH, in 5% increments. Space temperature data from the thermostat location were included to give an understanding of the indoor relative humidity readings.
Generally the hours, percent hours, and number of events decreased as the humidity threshold increased. By comparing the hours or events above humidity thresholds with the coin-cident space temperature, high-humidity conditions could be linked to either high or low indoor temperature. A description of the analysis table entries is given in Table 4. The appendices of Henderson and Rudd (2005) provide the full results of this analysis for each site.
Similar sets of tables were developed and generated for those houses where equipment runtime data were collected. By comparing the hours above humidity thresholds with occurrence of active cooling or dehumidification, inference can be made as to whether high-humidity conditions can be linked to equipment operation. A description of the analysis table entries are given in Table 5. The appendix of Henderson and Rudd (2005) provides the full results of this analysis at each site.
The month representing the highest indoor humidity condition was also identified for each house (see Table 6). As expected, the spring and fall months most often had highest humidity, though some sites did show high humidity in the summer and winter. Three sites were removed from Table 6 because of unusual average cooling setpoints above 85°F (29.4°C) when indoor humidity was highest.
The following general observations were made about the sites based on the data in Table 6.
• There was little clear difference between standard houses with and without ventilation. However, the standard houses with ventilation were all in the somewhat less
humid regions of Austin and Dallas versus Houston. Sites 34 and 35 were houses with ventilation that surprisingly had low humidity levels. However, both of those were large houses with low occupancy (one to two people) and, hence, presumably low internal moisture generation.
• Two of the three medium-performance houses with
ven-tilation showed a marked increase in humidity compared to standard houses with ventilation, in spite of the drier climate.
• All three high-performance houses with ventilation only showed a marked increase in humidity compared to standard houses with ventilation. The high-humidity conditions in high-performance houses with ventilation were not very different from the medium-performance houses with ventilation. However, the times of year when high humidity occurred were different, probably due to the hot-humid versus mixed-humid climates.
• All three high-performance houses with energy recovery
ventilation showed a marked increase in humidity com-pared with standard houses, but slightly lower humidity than high-performance houses with ventilation. Thus, the effect of reducing the latent ventilation load through energy recovery may have helped but was insufficient to avoid high humidity at part-load and no-load conditions.
• Sites 29–31 were standard houses with ventilation and
cooling system enhancements. There was no definitive impact of adding these cooling system dehumidification enhancements for these houses. The occupants at Site 31 had inadvertently switched the thermostat fan control to the constant fan mode, which severely degraded dehu-midification performance even though the enhanced mode was activated.
• The single high-performance house with ventilation and
cooling system enhancements had elevated humidity in the same range as high-performance houses with venti-lation. The cooling system enhancement lowered the space temperature by 3°F (1.7°C) below the requested setpoint, which kept the house at about 71°F (21.7°C) and caused occupant discomfort.
• Three of the five standard houses with ventilation and supplemental dehumidification exhibited superior humidity control throughout the year. The remaining two showed about the same humidity conditions as the middle range of standard houses with ventilation, because the homeowner selected relatively high humi-distat settings. For all of these houses, the dehumidifi-cation systems were ducted into the central air distribution system.
• All of the high-performance houses with ventilation and supplemental dehumidification generally had the capac-ity to control indoor relative humidcapac-ity below 60%. Sites 3, 5, and 10 all had different systems that controlled humidity well. However, the same systems in different houses with different occupants did not perform the same, mostly due to higher dehumidification settings. At Site 21, the occupant turned the dehumidifier on and off
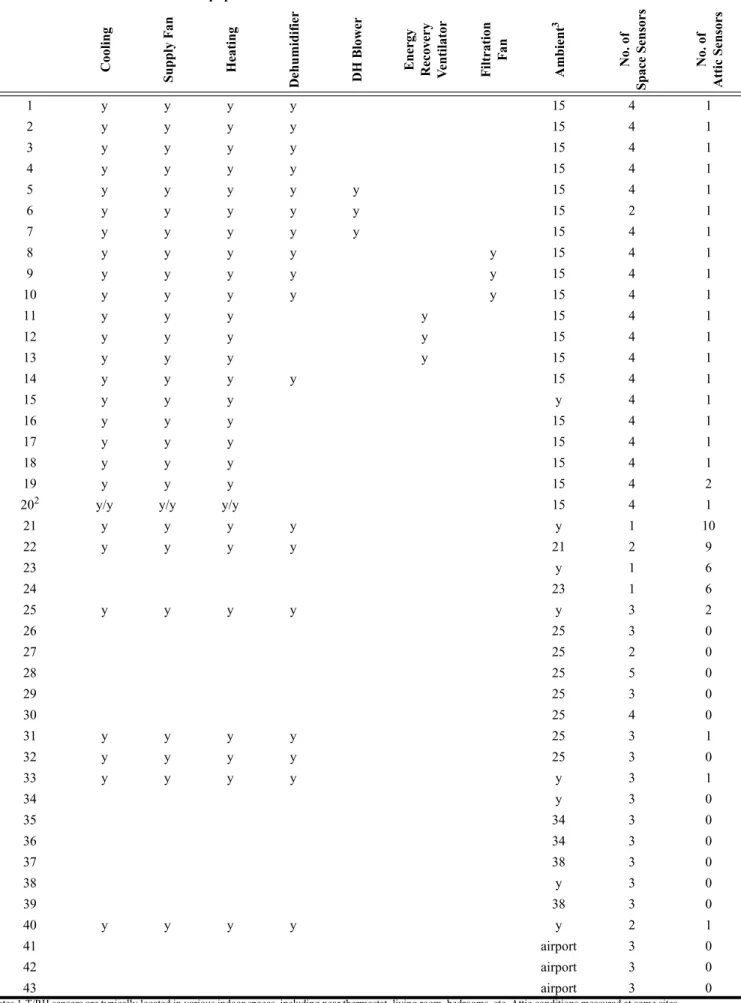
ASHRAE Transactions 441 Table 3. Summary of Sensors Installed at Test Homes
Equipment Status/Runtime Sensors T/RH Sensors1
Cooling Supply F a n Heating Dehumidif ier DH Blo w er Ener g y Reco v ery V e ntilator Filtration Fa n Ambient 3 No. of Space Sensors No. of Attic Sensors 1 y y y y 15 4 1 2 y y y y 15 4 1 3 y y y y 15 4 1 4 y y y y 15 4 1 5 y y y y y 15 4 1 6 y y y y y 15 2 1 7 y y y y y 15 4 1 8 y y y y y 15 4 1 9 y y y y y 15 4 1 10 y y y y y 15 4 1 11 y y y y 15 4 1 12 y y y y 15 4 1 13 y y y y 15 4 1 14 y y y y 15 4 1 15 y y y y 4 1 16 y y y 15 4 1 17 y y y 15 4 1 18 y y y 15 4 1 19 y y y 15 4 2
202 y/y y/y y/y 15 4 1
21 y y y y y 1 10 22 y y y y 21 2 9 23 y 1 6 24 23 1 6 25 y y y y y 3 2 26 25 3 0 27 25 2 0 28 25 5 0 29 25 3 0 30 25 4 0 31 y y y y 25 3 1 32 y y y y 25 3 0 33 y y y y y 3 1 34 y 3 0 35 34 3 0 36 34 3 0 37 38 3 0 38 y 3 0 39 38 3 0 40 y y y y y 2 1 41 airport 3 0 42 airport 3 0 43 airport 3 0
Notes 1-T/RH sensors are typically located in various indoor spaces, including near thermostat, living room, bedrooms, etc. Attic conditions measured at some sites. 2-Site 20 had two space conditioning units (upstairs and downstairs) that were monitored.
manually instead of using the automatic control. Only the UA and FV systems were ducted into the central air distribution system supply.
• The average cooling setpoints were generally several
degrees lower than the commonly assumed value of 78°F (25.6°C). The data in Table 6 provided no clear indication that either lower or higher cooling setpoints caused high humidity events.
Site-by-Site Analysis
To help explain the nature of and reason for the high-humidity condition at each site, we closely examined the seven- to-ten-day period when humidity was highest. We looked at space temperature and humidity conditions, ambient humidity (taken from a nearby airport), and equipment oper-ating status to understand the cause of each high humidity
event. In some cases, high humidity was linked to unexpected occupant behavior, such as manual thermostat operation, ther-mostat set up, or extremely high or low temperature setpoints. However, in general we found that high humidity was caused primarily by low or nonexistent sensible loads in high-perfor-mance homes at times when ambient humidity was still high. The effects of continuous ventilation on humidity could be seen in some cases and not in others.
Many hours for many of the sites showed conditions outside the ASHRAE comfort region (ASHRAE 2004b)— usually below the lower temperature or above the upper humidity bound. It is not clear why occupants chose temper-ature setpoints outside the comfort region. Most of these homes were well insulated and had low solar heat gain glazing, which would seem to factor out any compensation for mean radiant temperature. A few sites had thermostat controls that
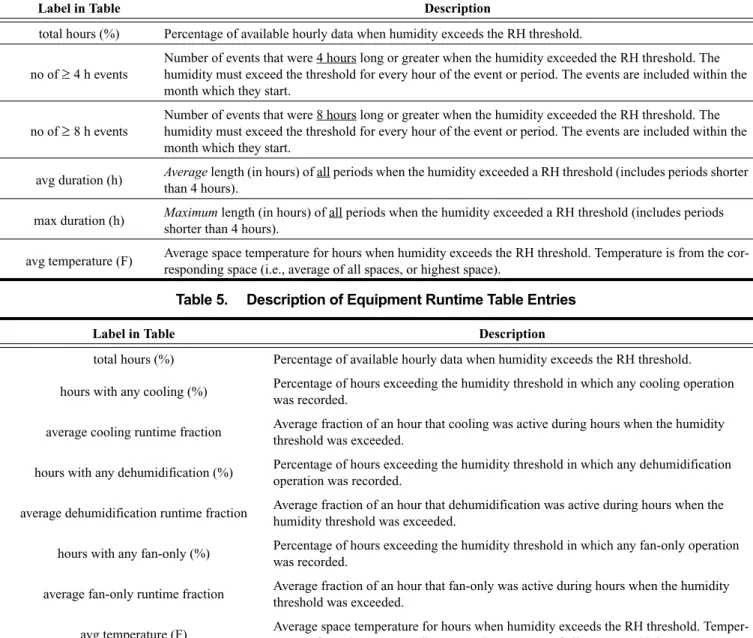
Table 4. Description of Humidity Event Table Entries
Label in Table Description
total hours (%) Percentage of available hourly data when humidity exceeds the RH threshold.
no of ≥ 4 h events
Number of events that were 4 hours long or greater when the humidity exceeded the RH threshold. The humidity must exceed the threshold for every hour of the event or period. The events are included within the month which they start.
no of ≥ 8 h events
Number of events that were 8 hours long or greater when the humidity exceeded the RH threshold. The humidity must exceed the threshold for every hour of the event or period. The events are included within the month which they start.
avg duration (h) Average length (in hours) of all periods when the humidity exceeded a RH threshold (includes periods shorter than 4 hours).
max duration (h) Maximum length (in hours) of all periods when the humidity exceeded a RH threshold (includes periods shorter than 4 hours).
avg temperature (F) Average space temperature for hours when humidity exceeds the RH threshold. Temperature is from the cor-responding space (i.e., average of all spaces, or highest space).
Table 5. Description of Equipment Runtime Table Entries
Label in Table Description
total hours (%) Percentage of available hourly data when humidity exceeds the RH threshold. hours with any cooling (%) Percentage of hours exceeding the humidity threshold in which any cooling operation
was recorded.
average cooling runtime fraction Average fraction of an hour that cooling was active during hours when the humidity threshold was exceeded.
hours with any dehumidification (%) Percentage of hours exceeding the humidity threshold in which any dehumidification operation was recorded.
average dehumidification runtime fraction Average fraction of an hour that dehumidification was active during hours when the humidity threshold was exceeded.
hours with any fan-only (%) Percentage of hours exceeding the humidity threshold in which any fan-only operation was recorded.
average fan-only runtime fraction Average fraction of an hour that fan-only was active during hours when the humidity threshold was exceeded.
avg temperature (F) Average space temperature for hours when humidity exceeds the RH threshold. Temper-ature is from the corresponding space (i.e., average of all spaces, or highest space).
ASHRAE Transactions 443 Table 6. Worst Month at Each Site with Percentage of Hours and Events
Over 60% and 65% RH, and Coincident Average Temperature
Site Hours % hours % hours
No System City Month/Yr of Data over 60% over 65% >60% >65% >60% >65% over 60% over 65%
Standard houses without ventilation
20 STD Houston Mar-02 744 19% 3% 11 1 6 1 72 72
27 STD Houston Mar-03 744 20% 1% 13 0 6 0 70 70
25 STD Houston May-04 744 48% 26% 23 13 18 9 75 75
19 STD Houston Apr-02 720 57% 22% 11 10 11 5 74 74
18 STD Houston Nov-01 335 67% 5% 12 2 11 0 74 73
Standard houses with ventilation
35 STD-CFI Austin Jan-03 396 0% 0%
34 STD-CFI Austin May-03 744 5% 0% 1 0 74
39 STD-CFI Dallas May-03 744 24% 3% 11 0 3 0 74 75
37 STD-CFI Dallas Jun-03 717 38% 6% 12 2 5 0 76 76
38 STD-CFI Dallas May-03 744 51% 16% 22 10 12 4 76 76
35 STD-CFI Austin May-03 744 66% 15% 9 7 7 4 77 77
Medium performance houses with ventilation
43 ES-CFI OK City Nov-03 720 24% 13% 5 6 4 4 72 72
42 ES-CFI OK City Jun-03 720 100% 82% 1 22 1 16 79 79
41 ES-CFI OK City Jun-03 720 100% 94% 2 17 2 16 73 73
High performance houses with ventilation
17 BA-CFI Houston Apr-02 720 82% 34% 21 21 19 13 75 76
15 BA-CFI Houston Feb-01 537 95% 68% 4 8 4 8 71 73
16 BA-CFI Houston Feb-01 514 99% 90% 1 2 1 2 68 68
High performance houses with energy recovery ventilation
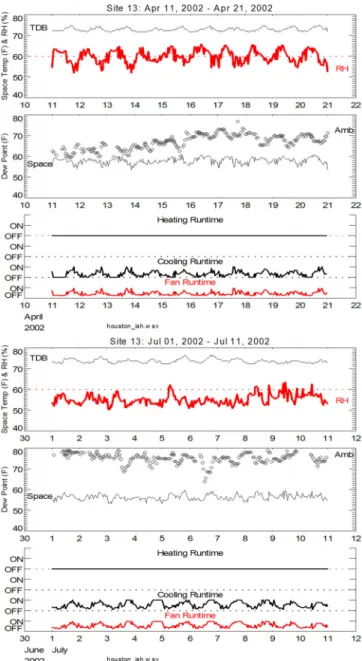
13 BA-ERV Houston Apr-02 720 56% 18% 30 12 22 1 74 74
12 BA-ERV Houston Apr-02 720 85% 52% 3 23 3 10 78 78
11 BA-ERV Houston Apr-02 720 98% 53% 8 30 8 20 75 75
Standard houses with ventilation and cooling system enhancement
30 STD-CFI-MOR Houston Nov-02 720 13% 2% 8 1 4 1 72 77
29 STD-CFI-MOR Houston Nov-02 720 14% 0% 4 0 1 0 73 75
31 STD-CFI-ECM Houston Jun-04 560 100% 91% 0 14 0 12 73 73
High performance house with ventilation and cooling system enhancement
14 BA-CFI-ECM Houston Apr-02 720 88% 29% 14 15 11 9 71 71
Standard houses with ventilation and supplemental dehumidification
26 STD-CFI-DH-D Houston Nov-02 720 0% 0% 0 0 73
33 STD-CFI-APR Houston Apr-04 720 5% 1% 1 0 0 0 72 73
32 STD-CFI-APR Houston Mar-04 744 9% 3% 2 1 1 1 71 71
28 STD-CFI-DH-D Houston Nov-02 720 18% 0% 5 0 4 0 72 72
40 STD-CFI-APR Orlando Sep-04 720 25% 5% 10 1 6 1 77 78
High performance houses with ventilation and supplemental dehumidification
10 BA-FV Houston Oct-02 449 13% 4% 1 0 0 0 75 75
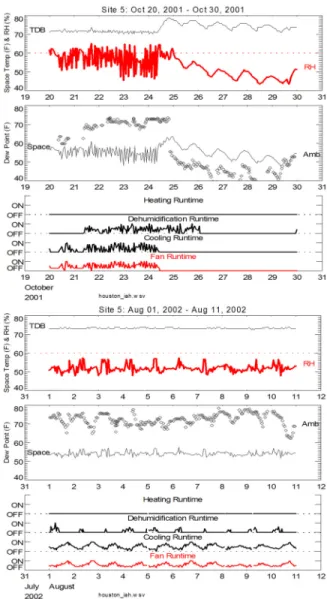
5 BA-UA Houston Oct-01 340 23% 2% 4 0 0 0 73 73
3 BA-CFI-DH-A Houston Apr-02 720 26% 2% 12 0 4 0 74 75
2 BA-CFI-DH-C Houston Oct-01 656 45% 17% 16 7 10 1 74 74
6 BA-UA Houston Apr-02 720 61% 12% 37 0 18 0 75 76
1 BA-CFI-DH-C Houston Apr-02 720 62% 33% 23 22 21 12 75 76
8 BA-FV Houston Jun-02 720 69% 10% 9 3 6 2 80 79
7 BA-UA Houston Oct-02 452 70% 28% 19 6 9 1 76 76
22 BA-CFI-DH-C Jacksonville Sep-00 720 74% 25% 21 14 16 8 75 76
9 BA-FV Houston Apr-02 720 74% 26% 25 21 24 7 76 77
21 BA-CFI-DH-C Jacksonville Nov-00 399 86% 43% 4 5 2 3 72 74
Average temperature (F)
Number of events Number of events
lowered the temperature by as much as 3°F (1.7°C) below the requested setpoint, of which some occupants complained.
The next sections progressively show results for houses with standard and high-performance building envelopes both with and without ventilation or supplemental dehumidifica-tion. While the results are in some cases anecdotal, the progression is intended to illustrate what we observe as the major factors affecting space humidity levels in this sample of homes. A report is available (Henderson and Rudd 2005) that provides full detailed results for each site.
Standard House without Ventilation
Figure 2 shows the indoor space temperature and humid-ity data for a standard house without mechanical ventilation (Site 19) on a psychrometric chart, with the ASHRAE comfort region highlighted. Figure 3 shows a comparison of 10-day periods from the worst month (April) and a normal summer month (August). As observed for other standard houses with-out ventilation, humidity control is good in the summer due to high demand for cooling operation. However, the lightly loaded spring period resulted in humidity levels over 60% RH. At this site, the supply fan cycles on and off with the compres-sor (since CFI ventilation does not activate the fan when the compressor is off).
Standard houses without ventilation are more consistent with general industry experience: humidity is usually controlled below 60% RH in the summer, with some modest excursions during the swing season and nights. Infiltration is often low in swing seasons, so space humidity can be main-tained by occasional cooling operation driven by modest sensible gains.
Standard House with Ventilation
Figure 4 shows the indoor conditioned space temperature and coincident relative humidity data for a standard house with
Figure 2 Standard house without ventilation; temperature and RH measured in four conditioned space zones from June 2001 to October 2002.
Figure 3 High-humidity month (April) compared to typical summer month (August) for standard house without ventilation.
Figure 4 Standard house with ventilation; temperature and RH measured in three conditioned space zones from January to June 2003.
ASHRAE Transactions 445
mechanical ventilation (site 35). Figure 5 shows a week from the month with the highest indoor relative humidity (May). The difference between standard homes with and without ventilation was not definitive at every site due to differences in occupancy, internal loads, setpoints, and other factors that affected space humidity levels.
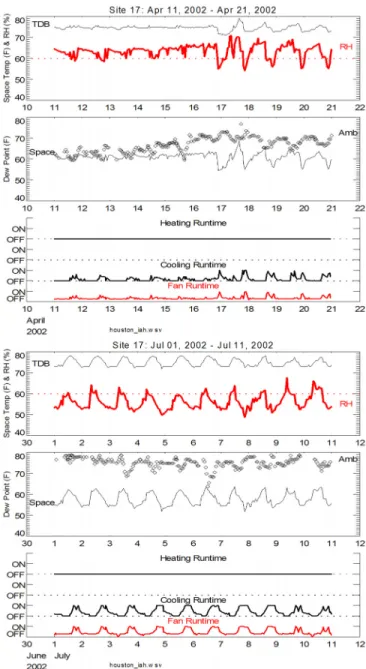
High-Performance House with Ventilation
Figure 6 shows the indoor space temperature and humid-ity data on the psychrometric chart for a high-performance house with mechanical ventilation (Site 17). Figure 7 shows a week from the month with the highest indoor relative humidity (April) as well as a typical summer week. The additional supply fan operation associated with the CFI ventilation system is apparent for this site (see Figure 7). When the outdoor temperature is mild and sensible loads are small, the high-performance house with ventilation has relatively high indoor humidity. High humidity occurs when there is little or
no demand for sensible cooling (i.e., the thermostat is satis-fied). At this site, thermostat setup during daytime working hours also reduced the cooling demand and caused higher indoor relative humidity. Similar results were observed at the other high-performance homes. At some sites, the reduction in cooling loads during summer nights also led to higher humid-ity levels.
Figure 8 illustrates the effect that continuous ventilation and internal generation have on space humidity levels in a high-performance home (Site 1). After a long cooling cycle, CFI ventilation is still provided to the space for several hours
Figure 5 High-humidity month (May) shows long periods with RH between 60% and 70% for standard house with ventilation.
Figure 6 High-performance house with ventilation; temperature and RH measured in four conditioned space zones from July 2001 to October 2002.
Figure 7 High-humidity month (April) compared to typical summer month (July) for high-performance house with ventilation.
without further cooling operation. During this noncooling period, the space dew point slowly approached the ambient value. This example shows how infrequent cooling operation combined with continuous whole-house ventilation and inter-nal generation can cause high humidity levels. In contrast, a naturally ventilated home would experience very little venti-lation at these mild conditions, since the driving potential for natural infiltration is small. Therefore, the space humidity might have been more consistently maintained.
High-Performance House with ERV
Energy recovery ventilators are sometimes identified as a solution to humidity control in humid climates. However, the data in Figure 9 confirm that, while these devices can lessen the incoming ventilation load by tempering the outdoor air, their impact is limited during mild outdoor conditions. When space and ambient humidity conditions are similar, the ERV provides essentially no dehumidification of ventilation air. The bottom of Figure 9 shows that indoor humidity was controlled reasonably well for typical summer conditions, since the difference between indoor and outdoor conditions provides more potential for dehumidification.
High-Performance House with Ventilation and Enhanced Cooling
Modest improvement can be seen in high-performance houses with enhanced cooling systems designed to increase latent removal capacity. Figure 10 shows data for a high-performance house with an enhanced cooling system that
lowers the temperature setpoint by as much as 3°F (1.7°C) when humidity is high. While overcooling does increase compressor operation and provide a lower dew point, the lower temperature tends to increase the relative humidity. The top of Figure 10 shows that overcooling pushed the space temperature down by the full 3°F (1.7°C) for this period in April (to below 70°F [21.1°C]), making the space uncomfort-able for occupants and driving the RH above 60%. The summer day charted at the bottom of Figure 10 shows that system worked better at these conditions. The dehumidifica-tion signal, which was triggered when the space was above Figure 8 Steady increase of indoor humidity driven by
continuous ventilation and internal generation during non-cooling hours.
Figure 9 High-humidity month (April) compared to typical summer month (July) for high-performance house with energy recovery ventilator (ERV).
ASHRAE Transactions 447
50% RH, periodically drove down space temperature slightly, but the RH was always maintained below 60% RH.
High-Performance House with Ventilation and Dehumidification
The addition of a high-performance dehumidifier in the high-performance house results in good humidity control throughout the year. Figure 11 shows the space temperature and humidity data for Site 5 on the psych chart. The dehumid-ifier always maintained the space below 60% RH in this home. Figure 12 shows a week from the high-humidity month (Octo-Figure 10 High-humidity month (April) compared to typical summer month (July) for high-performance house with ventilation and enhanced cooling.
Figure 11 High-performance house with ventilation and dehumidification; temperature and RH measured in four conditioned space zones from October 2001 to October 2002.
Figure 12 High-humidity month (October) compared to typical summer month (August) for high-performance house with ventilation and dehumidification.
ber) as well as a typical summer week in August. Figure 12 shows that dehumidification and cooling were required in October for a brief period until the ambient humidity dropped and reduced the latent load. In the summer, the dehumidifier was only required to operate for brief periods at night when the humidity briefly increased. Dehumidifier operation was not required during the middle of the day in the summer.
CONCLUSIONS
Conventional cooling systems in standard houses usually provide reasonable humidity control (i.e., below 60% RH) for summer conditions in warm-humid and mixed-humid climates. Space humidity excursions above 60% RH usually occur during the swing months in the spring and fall, or at night, when sensible cooling loads are modest or nonexistent. The effect of adding mechanical ventilation to standard houses in humid climates was not a consistently clear or strong signal. Differences in occupancy and occupant behavior seem to have a larger impact.
High-performance homes have smaller sensible heat gains and, therefore, have a higher balance-point temperature for cooling. As a result, there are many hours when sensible cooling is not required yet there are still significant moisture loads from internal sources and ventilation. The result is higher space humidity levels at times when the cooling ther-mostat is satisfied.
The combination of high-performance, low sensible heat gain buildings and continuous mechanical ventilation has significantly increased the number of hours in the year that require dehumidification without sensible cooling. Humidity loads in these high-performance homes cannot always be met by conventional or enhanced cooling systems, but instead require separate dehumidification. These load conditions— which have not typically been observed in standard homes— do not occur during peak summer cooling conditions but mostly occur in the swing seasons and may occur during summer nights.
The addition of supplemental dehumidification to high-performance homes enables the energy savings of efficiency improvements that significantly reduce cooling demand with-out the fear of elevated indoor humidity.
ACKNOWLEDGMENT
This work was supported by the United States Depart-ment of Energy, Building Technologies Program. We espe-cially appreciate the leadership of Ed Pollock, George James, and the National Renewable Energy Laboratory.
REFERENCES
ACCA. 2004. Manual J—Residential Load Calculation, 8th ed. (version two). Air Conditioning Contractors of America.
Andrade, M.A., and C.W. Bullard. 2002. Modulating blower and compressor capacities for efficient comfort control. ASHRAE Transactions 108(1):631–37.
ASHRAE. 2004a. ANSI/ASHRAE Standard 62.2-2004,
Ventilation and Acceptable Indoor Air Quality in Low-Rise Residential Buildings. Atlanta: American Society of Heating, Refrigerating and Air-Conditioning Engi-neers, Inc.
ASHRAE. 2004b. ANSI/ASHRAE Standard 55-2004,
Ther-mal Environmental Conditions for Human Occupancy. Atlanta: American Society of Heating, Refrigerating and Air-Conditioning Engineers, Inc.
Henderson, H., and A. Rudd. 2005. Analysis of indoor envi-ronmental data. Report to US Department of Energy, National Renewable Energy Laboratory, Golden, CO. Henderson, H.I., K. Rengarajan, and D.B. Shirey. 1992. The
impact of comfort control on air conditioner energy use in humid climates. ASHRAE Transactions 98(2):104–13. Krakow, K.I., S. Lin, and Z.S. Zang. 1995. Temperature and humidity control during cooling and dehumidifying by compressor and evaporator fan speed variation. ASHRAE Transactions 101(1):292–304.
Rudd, A., J. Lstiburek, and K. Ueno. 2005. Residential dehu-midification systems research for hot-humid climates. US Department of Energy, Energy Efficiency and Renewable Energy, NREL/SR-550-36643. www.osti. gov/bridge/.
Shirey, D., and H. Henderson. 2004. Dehumidification at part load. ASHRAE Journal 46(4).
Trowbridge, J.T., K.S. Ball, J.L. Peterson, B.D. Hunn, and M.M. Grasso. Evaluation of strategies for controlling
humidity in residences in humid climates. ASHRAE
Transactions 100(2):59–73.
DISCUSSION
Douglas Kosar, Principal Research Engineer, University of Illinois at Chicago, Chicago, IL: In ANSI/ASHRAE/ IESNA Standard 90.1, there is a standard that may preclude the use of a separate dehumidification-only system for comfort control that uses simultaneous cooling and heating (a packaged household dehumidifier) and new energy in commercial/institutional applications. Does such language exist in ANSI/ASHRAE Standard 90.2 that could limit this supplemental dehumidification?
Armin Rudd: Section 6.10.3.2 of ANSI/ASHRAE Standard 90.2-2004 addresses additional energy used for reducing humidity. It states, “If additional energy-consuming equip-ment is provided for reducing humidity, it shall be equipped with controls capable of being set to prevent energy from being used to produce a relative humidity within the space below 50% during periods of human occupancy or below 60% during unoccupied periods.” That language does not preclude the use of supplemental dehumidification for humidity control, nor should any new language be construed to do so. In humid climates, especially for energy-saving, low-sensible-load houses, supplemental dehumdification is good for improving comfort, health, and durability.
ASHRAE Transactions 449 Lew Harriman, Director of Research and Consulting,
Mason-Grant Consulting, Portsmouth, NH: This informa-tion is very helpful to researchers, manufacturers, and build-ing scientists as they try to understand the real-world operating results of residential air-conditioning systems. So that the information can be even better understood in its full context, I would strongly encourage the authors and the Soci-ety to include the color photos of the buildings, building details, and system diagrams used in the presentation in the printed version of Transactions. These photos were very help-ful in understanding the complete operating context of this very important and useful information.
Rudd: Color photos, systems diagrams, and building details for a large group of the houses represented in this paper can be found in two references:
Rudd, A., J. Lstiburek, and K. Ueno. 2003. Residential dehu-midification and ventilation systems research for
hot-humid climates. Proceedings of 24th AIVC and BETEC
Conference, Ventilation, Humidity Control, and Energy, Washington, DC, October 12–14, pp. 355–60. www.aivc.org or www.buildingscience.com/resources/ presentations/Rudd_Residential_Dehumidification_and _Ventilation_Systems.pdf.
Rudd, A., J. Lstiburek, and K. Ueno. 2005. Residential dehu-midification systems research for hot-humid climates. US Department of Energy, Energy Efficiency and Renewable Energy, NREL/SR-550-36643. www.eere.energy.gov/ buildings/building_america/publications.html (click on Cooling Systems and Technical Reports then Search, or www.nrel.gov/docs/fy05osti/36643.pdf).