INTRODUCTION
Tax is a compulsory payment, in exchange for which the taxpayer does not receive immediate direct benefits (i.e. it is unrequited). Taxes cover the costs of allocation of public goods. Their other function is to provide for income redistribution together with transfers. There are various social preferences regarding redistribution, which are basically related to the issue as to what extent the groups with different levels of income should be beneficiaries or bearers of burdens. On the basis of fairness, usually a deviation from vertical equity (i.e. contribution in equal proportion to income, independent of income level) is preferred, in other words lower incomes should be taxed at a lower rate, while higher incomes should be taxed at a higher rate.
This article deals with two other dimensions of taxation: horizontal equity and efficiency, as well as the relationship between these dimensions and tax evasion. Conditions for horizontal equity hold true if taxpayers with the same income bear the same tax burden. A tax system is efficient if it ensures a given tax revenue at a minimum social cost. Social cost has three elements: the cost of tax administration, the cost of compliance and the excess burden caused by the distorting effects of taxes on economic behaviour. Excess burden is the welfare loss caused by taxation over and above the revenue it raises. The excess burden increases with the square of the tax rate. On the other hand, the higher is the tax elasticity of the commodity or income, the higher the loss. Therefore, in order to minimise the loss, tax rates should be inversely proportional to their elasticities. In this case, for example, there would be a lower-than-average tax burden on capital incomes and higher incomes and a higher-than-average burden on basic consumer goods.
Efficiency considerations, namely tax rates inversely proportional to elasticities, may conflict with the social preferences regarding vertical equity. While efficiency would require preferential rate for higher incomes, fairness would justify just the opposite. One possible solution is when taxation addresses efficiency considerations, while social transfers ensure fairness. The underlying reason is that fairness can be assured not only by progressive taxation, but also through social transfers. However, one must not forget that, depending on the specific design, a reduced tax burden and a transfer may have different effects.1
From the perspective of our analysis, it is a more interesting issue that tax burdens inversely proportional to elasticities may also violate the principle of horizontal equity. The underlying reason is that the tax burden on the income of corporations, entrepreneurs and employees of small companies is lower than that of other employees who earn the same income. On the one hand, the higher elasticity of the former incomes stems from the fact that the first group of taxpayers can respond to an increase in tax burdens with a real change of its activity (for example, by restraining its labour supply or relocating its activity in another country). On the other hand, they may also react with tax evasion, i.e. with an apparent change of activity, for example by underreporting the registered activity, hiding the profit and transferring it abroad.
The remaining part of the article first examines the issue of tax evasion and its magnitude in Hungary, followed by a review of how, on the basis of international experience, it would be possible to reduce the elasticity of tax bases allowed by tax evasion.
Tax evasion reduces the efficiency of the economy as unequal opportunities of tax evasion leads to an inefficient distribution of resources. In Hungary, based on data for 2005–2006, tax evasion resulted in a transfer of 7.9 per cent of GDP from taxpayers to tax evaders. Following measures aimed to reduce tax evasion, this transfer was estimated to be 6.7 per cent of GDP in 2006 and 2007. Underlying reasons for tax evasion are the different burdens on labour and capital incomes. According to international experience, either the control of splitting labour and capital incomes or bringing their contribution burdens closer to one another can help in this situation. The effect of administrative measures is often temporary, because they do not improve tax-compliance attitude. A positive change in taxpayers’ attitude is an especially difficult task; one of its possible means can be a shift in the tax burden in favour of local taxes.
changes in Hungary
1The situation is similar in the case of the provision of family allowances in the forms of tax benefits and expenditure, where there is a significant difference between
TAX EVASION IN HUNGARY
The concept of tax evasion is used below in a broader sense, including both tax avoidance, which exploits the loopholes in the tax system, and the clearly illegal tax evasion. However, it may be justified to distinguish them because they require different solutions. As tax avoidance is attributable to loopholes in taxation, the solution can be to change the tax system in such a way as to make it more difficult to circumvent the rules. In the case of the loopholes granted by a compromise between the authority and the taxpayer (e.g. in the case of the acceptance of a minimum payment), the question is to what extent the compromise can be considered as reasonable. Besides administrative efforts (controls, penalty) and improving the tax-compliance attitude, illegal tax evasion can also be reduced by adequately changing the tax system. International experience regarding the impact of tax changes on tax evasion are discussed in more detail in the next part.
As mentioned in the Introduction, taxes, on the one hand, cover the costs of allocation of public goods, and, on the other hand, ensure income redistribution together with transfers. Consequently, the tax-compliance attitude is partly determined by how – for services of what quality, at what rate of corruption – the paid taxes are spent according to the perception of taxpayers. The other determining factor is the perceived fairness of the tax system, i.e. to what extent it meets the distribution preferences regarding horizontal and vertical equity.
Tax evasion is a serious problem because it may result in a significant welfare loss by allowing transfers from taxpayers to tax evaders. This loss is due to an efficiency loss on the one hand and horizontal inequity on the other hand. Efficiency is reduced because the unequal opportunity of tax evasion leads to an inefficient distribution of resources. Enterprises exploiting the various opportunities of tax evasion gain unjustified advantage over their competitors, as they are able to pay wages which are consistent with the labour market equilibrium even if the labour is used at a much lower efficiency. Meanwhile, due to the loss of tax revenue, the tax burden on those who cannot avoid paying their taxes has to be increased, and thus the companies that are more efficient (i.e. by using one unit of labour, they produce higher added value and income which can be redistributed), but comply with the rules, may be not competitive in the labour market. Horizontal equity is violated by the fact that a group of taxpayers is able to hide their income; therefore, the other
group of taxpayers pays instead of them as well, which results in a further deterioration of the tax-compliance attitude. It is hard to estimate these welfare losses, but it is certain that the loss is smaller than the size of the ‘transfer’ allowed by tax evasion. Since the costs of the fight against tax evasion (the costs of tax administration and compliance) may be very high beyond a certain point, an optimal level of tax evasion exists, where the total cost including welfare loss is minimal.
Not only the optimal level of tax evasion, but even its current magnitude is hard to estimate because in the case of a part of economic agents the actual sales and income remain hidden. In a statistical sense those activities belong to the hidden economy which, according to international methodology, constitute a part of production, but are missing from the statistical surveys and administrative data. In Hungary, the estimate of the Central Statistical Office (CSO) for the hidden economy reached 16 per cent and 12 per cent of GDP in 1997 and 2000, respectively.2
At the same time, there are several methods to estimate the size of the hidden economy: comparison with pieces of information independent of the tax returns, food consumption, representative survey of earnings, electricity consumption. In the case of Hungary, the estimates based on various methods determine the ratio of the hidden economy as 20-30 per cent of the official GDP. This estimated ratio in the 1990s and early 2000s can be classified as extraordinary high even when compared with the developed countries (Schneider, 2005, Lackó, 2000, Renooy et al., 2005). However, some estimates found an improving trend as well compared to the early 1990s. In the group of companies examined by Semjén and Tóth (2004) (which account for 70 per cent of GDP) the weight of the hidden economy declined between 1996 and 2001, but, according to their conclusion, this took place partly as a result of ‘contracting out’ the tax evasion. They found that its main form is employment at an extremely low level of wages, as a means of reducing taxes. According to the EU’s comparative analysis, in 1998 the ratio of underreported work (black and grey labour) was 18 per cent, which is similarly high to the levels of Latvia, Lithuania, Romania, Bulgaria and Slovenia3 (European Commission, 2004). According to more recent estimates regarding underreported work (Juhász et al., 2006) this ratio is higher again, between 20-30 per cent.
According to Szabó’s estimate (2007) based on a comparison of expenditures and incomes from a household panel survey, 6 per cent of households may belong to the hidden economy.
2
This is below the 15 per cent estimated for Poland and Slovakia, but exceeds the 7 per cent for the Czech Republic. At the two dates the Eurostat methodologies applied by the CSO were different; the differences may explain half of the decline. In the figure for 1997 even those were included who would otherwise not be subject of taxation under the relevant provisions of law; therefore, the figure for 2000 is more appropriate for estimating the degree of tax evasion.
3
In the author’s opinion this ratio may be higher because participants of the hidden economy may have refused to answer, and even if they did answer, they may have shown their grey income as legal. A significant part of the hidden economy is concentrated in the group of small enterprises; the average hidden income of the self-employed exceeds that of employees by at least 24 percentage points. (Benedek and Lelkes, 2007) In the case of certain professions, 80 per cent of their total transactions may be related to the hidden economy, the weight of which is 52 per cent within their total expenditure (Semjén et al., 2001).
According to the findings of our earlier study (Krekó and P. Kiss, 2007), the total effect of the various channels of tax evasion may be around 21 per cent of revenues. This estimate, augmented with a review of developments in 2006 and 2007, is presented below. The starting point of the estimate was that the various channels of tax evasion are connected. An obvious solution is failing to issue an invoice; this way not only the tax on the income from the invoice value, but also the VAT can be saved. Based on this, we started from the assumption that at the level of the economy, the magnitude of the hidden domestic sales is equal to the magnitude of hidden income. We also assumed that all hidden income is missing from labour incomes, as taxes and contributions on the latter are much higher than the tax on income withdrawn as corporate profit. Moreover, the profit can further be reduced by inflated costs; therefore, its actual burden is minimal. The form of hiding labour income is that employees are paid (partly) ‘under the table’, while the self-employed report only a minimum income in the form of wages.
VAT EVASION
The efficiency of VAT and the magnitude of VAT evasion can be measured by a comparison of the actual and potential VAT revenues. Potential VAT revenues are calculated by multiplying the weighted average of nominal VAT rates with the potential VAT basis (purchased consumption in national accounts minus VAT revenues). The ratio between actual and potential revenues is called the VAT efficiency indicator. As the potential VAT basis is determined by the estimate of the CSO for the hidden economy, the ratio between the actual and potential revenues could reflect this estimate.
We carried out a comparison where we tried to determine the actual tax base on the basis of tax returns and the potential tax base on the basis of CSO statistics. Due to methodological differences, the contents of the VAT return – as they follow
the regulations of the given year – change every year. Moreover, the tax bases in the VAT return are so different from the CSO data that we could only find a quite aggregated breakdown (See Krekó and P. Kiss, 2007 for details). Our findings are presented in Chart 1, but we do emphasise that they should be interpreted with caution.
Another possibility for estimation stems from the fact that monthly VAT revenues on a cash basis are available starting from 1995, and their change can be divided into a part that can be explained with various factors and to a part that cannot be explained. This latter residual part can be considered as the effect of the change in tax evasion. We prepared our calculation for the change in the gross VAT revenue, as it is difficult to exclude the effect of the government discretionary timing of refunds (bringing them forward or delaying them) from the net revenue. Therefore, only a partial estimate can be prepared for the tax evasion carried out in the form of refund, as the gross VAT payment reflects only the effect of VAT deduction, but not its amount requested to be refunded in money.
In addition to the dynamics of household consumption, several factors explain the trends in gross VAT payments. The most important one of these factors is the estimated effect of changes in taxes; thus, for example, we deducted the total amount of the simplified entrepreneurial tax (SET) revenue from the VAT, assuming that the former completely replaced the latter. Second, the same net cash-flow revenue may evolve with different combinations of cumulated gross payments and refunds; therefore, it is also worth eliminating the effect of changes in their accumulation from the gross VAT payment.4
4We made a correction for the fact that after 2004 the dynamics of gross VAT revenues was restrained by the termination of the collection at the border which reduced
accumulation (and thus the refund as well).
Chart 1
Results of the two estimates for evasion of VAT
-5.0 0.0 5.0 10.0 15.0 20.0 25.0 1995 1996 1997 1998 1999 2000 2001 2002 2003 2004 2005 2006 2007 VAT-loss based on cash-flow data
VAT-loss based on CSO data for consumption
Third, the comparison would be distorted by the fact that the weights of other smaller tax bases (housing construction, government purchase) also changed, and thus we also made corrections for the effect of this. There is only one explanatory factor the effect of which we did not estimate. This is the changes in the composition of household consumption, but we assumed that different VAT rates were not a considerable effect on the changes of revenue.
Chart 1 presents a comparison of tax returns and CSO figures on the one hand, as well as the estimate of the change in tax evasion from the revenues on a cash basis, on the other hand. As for the level of the cash-flow estimation, we assumed that the comparison between tax returns and the CSO figures provides a good estimate for the magnitude of tax evasion as an average of the period. This is an acceptable assumption, as thus the result for the level of the cash-flow estimation is that evasion did not decline below 5 per cent even in the most favourable year.
The chart shows that according to the cash-flow estimation VAT evasion declined significantly between 1995 and 1999, and then increased steadily between 2000 and 2004 before starting to decline again in 2005. Our earlier study followed the developments only until 2006. We have now prepared an estimate for 2007 as well, indicating a more than 3 percentage point decline in VAT evasion. The following is a review of the possible explanations of this strong fluctuation, first examining the domestic VAT, then the import VAT.
On the one hand, one of the ways of avoiding the domestic VAT is that reporting lower sales than the sale value threshold makes exemption from taxes possible. At times of sudden valorisations of this threshold (doubled in 1995, 1997 and 2003) it was more difficult to leave the group of taxpayers, while in the interim periods it became increasingly easier because of the lack of valorisation. On the other hand, those who became subject of VAT above this threshold could continue the evasion of VAT by underreporting their sales, while they could deduct the VAT of their purchases from this reported obligation. In 2003 and 2004, the increase in evasion may have been related to the introduction and expansion of the SET, which may have resulted in a bigger loss of VAT than the revenues from the SET were. Although the obligation to pay SET on the sales revenue replaces the VAT obligation, the possibility of VAT deduction ceased to exist only in principle. The underlying explanation is that by establishing affiliated companies, taxpayers requested the refunding of the VAT content of received invoices in another company belonging to them. This possibility ceased to exist as of 2006, when the reduced standard VAT rate (20%) became lower than the raised SET rate (25%).
The evasion of import VAT, which caused serious problems in the early 1990s, declined steadily from 1995. New companies did not have a chance to avoid paying the import VAT, because when they imported, they immediately had to pay a deposit. Later they could be exempted from this requirement, if they qualified as reliable taxpayers. After joining the EU, evasion increased again, as with the termination of the customs borders between Member States the imposition of taxes was replaced by self-assessment for those subject to VAT. Following our EU accession, cross-border transactions with chains of traders exploiting the rules of Community sales were identified in exports as well, where the trader can sell at favourable prices by the insertion of a fictitious ‘missing trader’, avoiding the payment of VAT on sales. The revealed amount equals 0.1 per cent of GDP, which, depending on the efficiency of the investigations, suggests that 1 to 2 per cent of GDP may be lost at the level of tax bases due to these types of VAT frauds. This size of this difference matches the statistical gap which evolved between the import-export balance on an accrual basis and the relevant financial statistics on a cash basis. There is usually a difference between the two statistics because of natural reasons as well, but due to the different data sources we may also assume that financial statistics on a cash basis that are built on data collection through questionnaires and data reporting by banks are less sensitive to these forms of VAT fraud. Based on the statistical deviation, between 2004 and 2006 evasion could be higher, then from 2007 the lost tax base may have declined by as much as half per cent of GDP. In the case of excise goods, illegal imports were motivated by the fact that the excise tax burden, further increased by VAT payable on this burden, was very high compared to that in some of the neighbouring countries. The resulting loss in VAT was reduced by the increased control of excise goods from 2006. According to various estimations, the controls added 0.1 per cent of GDP to the excise tax in 2007, simultaneously increasing VAT revenues as well.
EVASION OF INCOME TAXES AND
CONTRIBUTIONS
We do not deal with the group of companies excluding small enterprises because, according to earlier analyses (Semjén and Tóth, 2004), tax evasion has declined among them, and was partly ‘contracted out’ in the form of employment at a low wage level. This group of employees turned into economically dependent workers (outsourcing, contracting out). This group is formally self-employed, but essentially they can be considered as forced or involuntary entrepreneurs. In the following, we examine the self-employed (private entrepreneurs, partners of companies) first, then employees.
Despite the fact that every seventh employed person is self-employed, these people contribute to the taxation only by 0.8 per cent of GDP, which is a disproportionately low figure compared to employees. However, the group of the self-employed is not homogeneous; it ranges from dependent workers to high-income entrepreneurs. If the share of low-income entrepreneurs is higher, it is also possible, in principle, that the contribution to GDP and average income of the self-employed is actually lower than those of the employees. By contrast, the comparison of the sectoral distribution of private entrepreneurs and employees justifies only a minor difference; in 2005, calculating whole-economy earnings with the weights of private entrepreneurs’ sectoral distribution, the resulting earnings would be only 4 per cent lower than the average earnings. (Obviously, the group of employees does not provide an adequate basis for comparison either, as tax evasion is significant here as well.)
Based on the Hungarian personal income tax returns, private entrepreneurs’ tax basis is below that of employees; in 2001 employees’ total income was only 8 per cent higher than that of private entrepreneurs, while in 2005 it was already 85 per cent higher. Based on the returns, entrepreneurs’ tax basis were calculated as 2 per cent of their total reported revenues, i.e. private entrepreneurs calculated a 98 per cent cost ratio on average in 2005, and 61 per cent of private enterprises were loss-makers or operated at break-even. Half of this group reported losses in 2007 as well, although almost without exception they also complied with the minimum tax requirement introduced from the second half of 2007, which is 2 per cent of the sales revenue which can be corrected with limited items. This measure will have a full-year effect on 2008.
Tax evasion is further increased by stating labour incomes as capital incomes, which is profitable because there is a substantial difference between the effective tax and contribution burdens on the two types of income. No data are available for us regarding the illegal forms of declaring labour incomes as entrepreneurial income (simulated contracts). For private entrepreneurs and small companies another form of rechannelling labour incomes is splitting the entrepreneur’s income into labour and capital incomes. For example, private entrepreneurs determine their own labour income (entrepreneur’s withdrawal), which is the basis for the social security contribution, by self-assessment, which practically allows for the legal avoidance of contribution payment. Based on the personal income tax returns, in the case of the private entrepreneurs that declare labour income
(180,000 people in 2005), for 77 per cent of them this income (which is the basis for the social security contribution) was below the minimum wage, and for 92 per cent of them below twice the minimum wage (75 per cent of the average wage). The amount of average labour income did not reach the amount of the minimum wage, which was only 36 per cent of employees’ average salary. Therefore, from September 2006, a required minimum basis for contribution was introduced for entrepreneurs as well, amounting to the double of the minimum wage. (In 2007 the total additional revenue may have amounted to 0.2 per cent of GDP, but only a part of it was paid by the self-employed.)
Another possibility is comparison with the average of the EU, where the share of the self-employed within the employed exceeds that of Hungary only by a small extent. Assuming that not only the ratio of the number of Hungarian self-employed persons but also their actual contribution to GDP is close to that of the EU, the difference between their reported income in Hungary and in the EU (2.2 per cent of GDP in 2005) can be seen as a result of a higher Hungarian tax evasion.5 As an EU average, we assumed a 30 per cent magnitude of tax evasion. Adding this revenue loss of 1.5 per cent of GDP to the Hungarian loss which exceeds the average by 2.2 percentage points, we estimated the lost revenue from self-employed as 3.7 per cent of GDP for 2005. As in the case of the major part of the tax base the total burden (tax and contributions on labour incomes) exceed 50 per cent, this loss may result from a 7.5 per cent evasion of the tax base. As a result of the measures taken in 2006 and 2007 (minimum tax and minimum base of contributions), this magnitude may gradually decline by 0.2 to 0.3 percentage point. Another reducing factor is the decline in the ratio of the self-employed, which may reduce their total income by a further 0.6 percentage point. Accordingly, tax evasion may decrease to 6.7 per cent of GDP.
These measures which affect all self-employed reflect new approach of the authorities abandoning the earlier approach of differentiation by professions or sectors. As we mentioned above, the group of the self-employed is not homogeneous at all. In the case of some professions income underreporting may even reach 80 per cent of total transactions; this is why individual professions used to be treated separately (for example, in the case of certain professions the option of simple flat-rate taxation was introduced replacing all normal taxes (including VAT), whereas in the case of other professions average figures regarding the presumed income were published by the tax authority).
5According to Eurostat, as an EU average the implicit tax rate of the self-employed is only two thirds of the implicit tax rate of companies, which is partly attributable
to the lower tax burdens and partly to underreporting incomes and inflated costs. Estimates for income underreporting of the self-employed are available only for a few countries, e.g. England (35%, Pissarides and Weber, 1989), Finland (16-40%, Johansson, 2000) and Sweden (30%, Engström and Holmlund, 2006).
The best example of the new approach of the authorities is the introduction of the SET in 2003, which became an option for a wide range of entrepreneurs and companies, as it could be simply chosen on the basis of the amount of the sales revenue, without any restrictions for given professions or sectors. First, companies and private entrepreneurs with sales revenues below HUF 15 million were allowed to opt for the SET, then, from 2005, this limit was raised to HUF 25 million. Within the framework of the SET, enterprises used to pay 15 per cent of their sales revenues, which was increased to 25 per cent as of September 2006. This replaced entrepreneurs’ personal income tax, the dividend tax and the VAT of entrepreneurs and the corporate profit tax in the case of companies. The basis of the social security contribution is the minimum wage.
The compromise (lower tax and contribution) made with the taxpayers who chose the SET is reasonable in a sense that the SET reduces the costs of tax administration and compliance, and may increase the willingness to pay tax. It is especially favourable for those taxpayers who reported inflated costs earlier.
However, due to the lack of restrictions in terms of professions or sectors, the SET means an actual saving of taxes for those taxpayers who have a low cost ratio in reality. Consequently, nearly 60 per cent of those who opted for the SET operated in the sectors of real estate activities and economic services, where the cost ratio is in fact lower. This tax saving is indicated by the fact that very few enterprises chose to leave the SET following the 10 percentage point increase in the SET rate in 2006. Another incentive is that the double basis of contributions introduced later has not become applicable to the SET, as due to the simplified accounting requirement there is no means of control. By virtue of its low tax and contribution burden and its simplicity the SET is especially advantageous for employees, although they can choose the SET only after a transitional period (first they have to become entrepreneurs).6It is a strong incentive for simulated contracts changing the employee status to a SET-paying entrepreneur’s contract that the higher the total labour costs, the more advantageous the SET, partly due to the flat-rate replacing progressive taxation and partly due to the required ‘fixed’ minimum contribution replacing the social security contribution payable in proportion of labour income.
Overall, as a result of a compromise, the SET was able to attract some tax evaders to the legal economy, although it ensured unjustifiably low taxes for others, as there was no
adequate control of entry. In other words, the price of simplicity was that in the case of some professions the elasticity of tax bases reflected in tax evasion increased.
An internationally widespread form of income underreporting is when companies report their employees with lower wages than their actual wages, for example as part-time employees or employees with minimum wage, and pay the difference – free of taxes and contributions – ‘under the table’. Analysing 17 countries, Tonin (2006) came to the conclusion that there is a positive correlation between the ratio of minimum wage earners and the size of the hidden economy. According to foreign experience, companies respond to increases in the minimum wage by changing part-time employment (Ressler et al., 1996); one of the ways is to declare a shorter working time than the actual working hours. The role of part-time employment in tax evasion in Hungary can be illustrated by the fact that when the minimum wage was doubled in 2001–2002, the ratio of employees declaring less than the minimum wage increased from 16 per cent in 2000 to 26 per cent in 2002, while the working time survey did not show any rise in the number of people employed in part-time jobs. In 2000, 572,000 people declared an income in a range between the old and the new minimum wages, but 354,000 of them remained in the same range in spite of the increase in minimum wages, while the number of employees declaring minimum wages increased from 177,000 only to 225,000 despite the doubling of the minimum wage.
According to the personal income tax returns, 30 per cent and 25 per cent of taxpayers earned minimum wages or less in 2005 and 2006, respectively. However, these income distribution figures for the whole year cannot be compared with the earning statistics of the EU, based on which, in turn, it can be established that in 2005 8 per cent of full-time employees received wages proportional to the minimum wage in terms of working time. The question is whether the different hours of work indicated by the various data can cause a difference of this degree. Using the wage distribution of full-time workers of companies with more than 4 employees for 2005 and the labour survey data regarding part-time employment and the number of those who work only during a part of the year, we estimated a hypothetical annual wage distribution. This shows what the distribution of all employed taxpayers’ annual labour income would look like, assuming that the monthly wage distribution of the employees of companies with more than 4 persons is not far from the monthly wage distribution of all employees. This assumption by itself would be distorting, because the actual
6For example, in the case of an annual net labour cost of HUF 4.8 million – i.e. a gross HUF 6 million income similar to the average income of those who pay SET – the
income of enterprises employing less than 5 people may be lower than that of companies with more than 4 workers, on the other hand the phenomenon of underreported wage also exists among companies with more than 4 persons, and this alters the result in exactly the opposite direction (Krekó and P. Kiss, 2007).
According to our findings, in 2005 the number of employees whose wage really did not exceed the minimum wage could be 700,000-750,000. Consequently, it can be calculated that approximately 460,000 employees reported a lower than actual wage. As a result, in this group more than 2 per cent of GDP may have been lost from the total labour income. Assuming that our estimate is an adequate basis for comparison in 2006 as well, based on the personal income tax returns only 1.4 per cent of GDP may be underreported. However, for 2006 it can be seen that the minimum wage peak became somewhat flatter, tax evasion may have partly declined and reported income partly passed through from the range below the minimum wage to the range above the minimum wage.
We have not prepared an estimate for the wage underreporting of employees above the minimum wage, but used the correlation according to which it is the underreporting of domestic sales that allows for hiding income as well. Accordingly, deducting the hidden income of the self-employed from the hidden sales, we receive the hidden wage of employees. However, the categories of the self-employed and of the employees partially overlap, as those self-employed who, as members of companies are registered with their own firms also appear as employees.
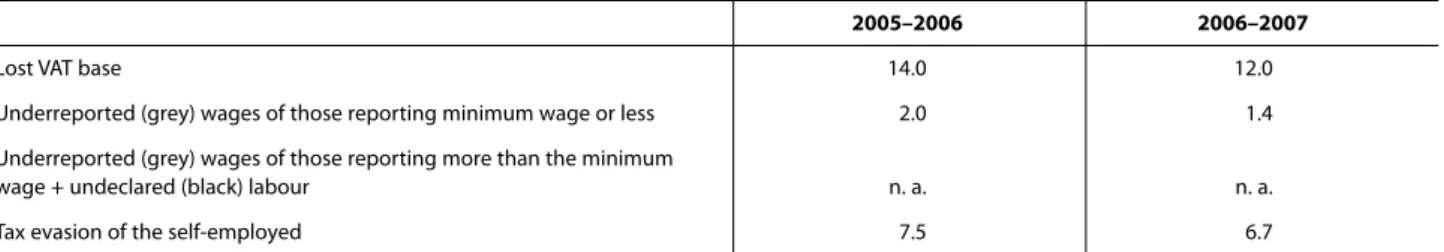
Table 1 is a summary of our findings based on the personal income tax returns of 2005 and the estimated VAT lost up to 2006 (the 2005–2006 column) and the updates based on the personal income tax returns of 2006 and the estimated VAT lost up to 2007 (the 2006–2007 column). Here, it is the combined effect of the various forms of tax evasion that is presented; its further breakdown would only be illustrative (Krekó and P. Kiss, 2007).
Estimated on the basis of 1995–2006, VAT evasion could amount to 14 per cent. Considering its factors, we know that the statistical estimate for the underreported domestic sales is 12 per cent, thus 2 per cent remains for underreported import and inflated VAT refund. Excluding the VAT content of the 12 per cent, 10 per cent income underreporting is estimated. Total hidden income may be 11 per cent, because taxable income may be reduced by around 1 per cent by inflated costs which would actually constitute private (household) consumption. The self-employed and those employees who are registered at and below the minimum wage may hide an income of 9.2 per cent of GDP together, provided that the magnitude of the assumed overlap between them reaches 0.3 per cent of GDP. This means that 1.8 per cent of GDP remains for wage underreporting by other employees. This may partly be the result of hidden wages above the minimum wage, and partly may include undeclared (black) labour as well.
As an average of 2006–2007, the lost tax base of VAT may amount to 12 per cent, of which domestic sales may amount to 10.2 percentage points. Accordingly, after the deduction of VAT, the result is an underreported income of 8.5 per cent of GDP, and assuming a 1 per cent for inflated cost it allows for a 9.5 per cent hidden income. Of this, the tax evasion of employees registered at or below the minimum wage is supposed to have dropped to 1.4 per cent based on the personal income tax returns. Presuming a 6.7 per cent tax base avoidance of the self-employed and a 0.2 per cent overlap, the hidden income of these two groups may reach 7.9 per cent of GDP. Consequently, the remaining 1.6 per cent may be the result of hidden wage of other employees.
In 2005, wage underreporting may have affected approximately 12.5 per cent of employees’ total wage income, followed by an estimated decline to 10 per cent in 2006. This is in line with the fact that in 2006 the number of those who submitted personal income tax returns increased by 2.4 per cent, which may partly be related to a decline in black labour. In addition to that, there was also a change in the composition of those who filed tax returns; the ratio of
2005–2006 2006–2007
Lost VAT base 14.0 12.0
Underreported (grey) wages of those reporting minimum wage or less 2.0 1.4
Underreported (grey) wages of those reporting more than the minimum
wage + undeclared (black) labour n. a. n. a.
Tax evasion of the self-employed 7.5 6.7
Table 1
Estimated loss of tax base
(as a percentage of GDP)
those above the minimum wage rose noticeably, i.e. there may have been some whitening taking place in terms of wage level too. Estimates suggest that it occurred gradually during the year, reaching 2.5 per cent by the last quarter7(Eppich and Lõrincz, 2007).
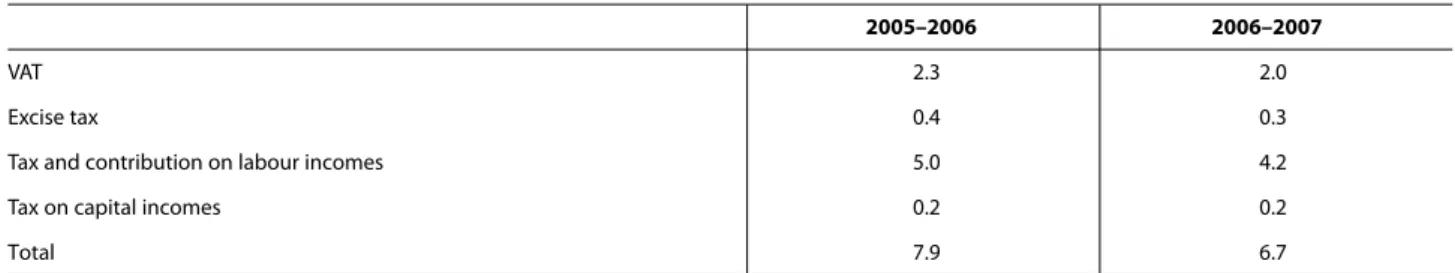
Table 2 presents the lost revenue which can be estimated on the basis of the tax base evaded. While based on 2005–2006 the estimated lost revenue reached 7.9 per cent of GDP, based on 2006–2007 the loss may have declined to 6.7 per cent. Two thirds of the tax evasion (income taxes and contributions) is concentrated among the self-employed and a part of employees, while one third (VAT and excise tax) is shared between a more stable group of sellers and a variable one of buyers. With the exception of buyers, the groups of tax avoiders and taxpayers can be separated, i.e. a dual system can be outlined, where 90 per cent of the estimated tax evasion can be considered as transfers between these two groups.
TAX CHANGES – INTERNATIONAL
EXPERIENCE
The theory of optimal taxation is based on the assumption that the various tax systems can be compared depending on the objective of the government, i.e. it can be examined as to which tax structure is the most favourable in terms of social welfare. This requires the estimation of how economic agents react to a given structure of taxes in the current equilibrium and in all other possible equilibria. Due to the lack of complete information, this complex response cannot be examined in practice; instead, using a solution which requires much less information, the analysis of the so-called marginal tax reform can be performed. This analysis may provide an answer as to the direction of changes in individual taxes in order to increase social welfare, but cannot provide any information on the extent and ranking of the measures. In addition to the analysis of taxes, transfers also need to be
analysed, since it is not worth separating the distribution and incentive effects of taxes and transfers.
It is an additional problem that the starting point of the analysis of the marginal tax reform would exactly be the current tax evasion behaviour, and the analysis would not be able to take into account the complex effect of the proposed changes on behaviour. If, let’s say, the elasticity of individual tax bases related to tax evasion could be reduced, the question is how it would affect real elasticity. For example, by terminating simulated contracts, a part of the dependent staff could be driven back to employee status (their tax evasion elasticity would decline), although another part of them would not be able to enter the labour market (their real elasticity would increase) because of higher taxes.
The question is whether reducing high tax rates can be a solution. Neither theoretically, nor on the basis of empirical experience can it be stated that reducing the rates would in itself increase tax compliance, thus increasing the tax bases over the short run. Although numerous empirical analyses found a positive correlation between the tax burden and the grey economy (e.g. Schneider, 2005), experience suggests that the reduction of the tax burden itself does not reduce the size of the hidden economy, and only because of declining tax rates the attitude of tax payers does not change. Accordingly, if tax evasion has become a widespread practice, tax cuts do not provide sufficient incentives, not even if it was partly the high taxes that constituted the underlying reason for the evolution of tax evasion. In addition, the relationship between high taxes and tax evasion is endogenous, i.e. tax rates are high as a consequence of the widespread informal economy. Increase in the tax base and improvement in the tax compliance were experienced only in the case of such comprehensive reforms which, in addition to reducing the tax rates, also aimed at the reduction of the elasticity of the ‘grey’ tax bases, including, for example, the simplification of the tax system, eliminating elements that encourage and
2005–2006 2006–2007
VAT 2.3 2.0
Excise tax 0.4 0.3
Tax and contribution on labour incomes 5.0 4.2
Tax on capital incomes 0.2 0.2
Total 7.9 6.7
Table 2
Estimated lost revenue
(as a percentage of GDP)
Source: own calculations.
allow for tax evasion, enhancing tax audits and a significant improvement of administration (e.g. Russia 2001, Sweden 1991). Analysing Austria’s tax reform in 1988, Schneider (1994) found that a tax cut did not result in a significant reduction of the grey economy, because the regulation did not change. In their New Zealand analysis, Giles et al. (1999) found some evidence that the grey economy responds to tax cuts to a lesser extent than to tax increases. All this calls the attention to the fact that it is better to carry out a comprehensive tax reform when the favourable budget balance and a cut of expenditure allow for a loss of tax revenues and a gradual improvement in tax compliance.
The question is whether it is possible to restructure the tax burden between the tax evaders and the taxpayers. The problem is that a taxpayer’s reaction to a tax cut is less elastic than a tax evader’s reaction to a tax increase. In other words, tax loss is certain, while revenue is uncertain. According to international experience, a shift towards better defined tax bases, a restructuring of the tax system and the focus of audit may be of decisive importance.
It is an observed trend that the ratio of informal employment is high in countries where the burden on capital income is lower than the burden on labour income, thereby directly encouraging the underreporting of labour. Violating the horizontal equity by allowing different tax burdens may damage the tax-compliance attitude. However, flat-rate tax systems often tried to impose equal tax burdens on labour and capital incomes without success, because the real difference between the burdens on entrepreneurs and employees can be identified in the differences of social security contributions and the definition of the tax base. These differences explain the diverse effects the flat-rate tax reforms of the last decade had on tax compliance and on the economy (Keen et al., 2006, Saavedra, 2007).
Is it a solution to decrease the difference between contributions payable by entrepreneurs and employees? This may be suggested by the trend that in those countries where the social insurance burdens of the self-employed are much lower than those of the employees, the ratio of the self-employed is higher, and the problem of tax evasion through small enterprises is more serious (OECD, 2004). Greece, Latvia and Lithuania can be mentioned as examples, where the self-employed pay a low, one-sum contribution. The situation is similar in Hungary as well; the self-employed pay their contributions on the basis of at least the minimum wage (SET-payers) or the double of the minimum wage, instead of
paying on the basis of their actual income. There is really no significant compliance problem in those countries where the contribution paid by the self-employed is roughly equal to that paid by the employees and employers (e.g. Australia, New Zealand, Denmark and Finland) (OECD, 2004). In Finland, the extension of contributions to personal capital incomes is implemented through the obligation to pay on the dividend as well.8
In practice, the alternatives to reducing the difference between the contribution burdens are focused audits and administrative measures. According to the OECD (2004), the problem of hidden income is less significant in those countries where instead of controlling the amount of labour, great emphasis is put on determining corporate income (e.g. Australia). In the fight against the illegal forms of reporting labour income as capital income an important role may be played by administrative measures, such as revealing simulated contracts and entrepreneurs that have one customer. In Norway, for example, where the taxation of labour income is different from that of capital income (dual income taxation), the splitting between labour and capital incomes for the self-employed and small enterprises is done in accordance with a specific and strict method. According to the Norwegian ‘split’ model, from the total income the capital income is defined as the yield of the capital invested in the enterprise according to a specific rate, while the remaining part is the labour income. Certainly, even the split model does not allow for exact separation, as it adds some kind of a risk correction factor to the risk-free rate of return. However, it can allow for professional and sectoral aspects to be taken into account instead of undifferentiated solutions (e.g. SET, minimum tax, etc.).
Decreasing the difference between contributions payable by entrepreneurs and employees can be also implemented by reducing the contributions of employees and increasing other taxes. The limit of the reduction of contributions is that it cannot affect those pension contributions to which a direct benefit is linked by individual. This has to be treated in a closed system, i.e. revenues should be consistent with expenditures over the longer term as well. By contrast, health-care, unemployment benefits or disability pension do not constitute a closed system by individuals, and according to international experience these can be covered from taxes too. Consequently, in this case it would be possible to carry out a regrouping between contributions and those taxes which impose taxes on hidden incomes or do not distort the tax burden between labour and capital incomes.
8Currently, health contribution has to be paid on certain capital incomes in Hungary as well, and the rate of contributions increased from 2007 onwards, but only up
One of the options of restructuring is the local business tax applied in developed countries, which imposes tax on labour and capital incomes at the same time. This is a tax on domestic added value, irrespective of its use (consumption, export). From this aspect, it is different from VAT, which imposes tax on imports instead of exports. The EU was also of the opinion that the IRAP applied in Italy does not constitute a duplication of VAT. It is also easier to collect than VAT, because it can be imposed on the basis of the corporate balance sheet and not on the basis of individual invoices. In Germany, this tax was introduced in the 1930s, but the tax base gradually narrowed in the 1980s. Starting from the 1950s it was adopted in several states of the USA; in some states it complemented, in other states it replaced the corporate tax. In its current form it has been applied in Hungary and Italy since 1998 and Japan since 2004. Subsequently, in Canada and France the tax reform committee proposed its introduction. With its low rate and broad tax base the local business tax results in significant revenues, because it is hard to avoid (consequently, it is less popular). In our case, a 3 per cent rate could even result in a revenue of 2.7 per cent of GDP, which could partly replace either health-care or unemployment contributions.
The other possibility of restructuring stems from imposing taxes on hidden incomes, although a much lower level of revenue regrouping can be expected of such a measure. The underlying reason is that due to the information asymmetry the authority cannot distinguish between those who hide their income and those who have low earnings. In order to avoid the negative labour market effects on the really low-wage group, there can be two ways of widening the tax base. One of them can be a low amount of fixed health-care contribution, which is not related to employment, but all insured adults are subject to it, with very few eligible for exemption (e.g. the unemployed, pensioners). The other possibility is a type of property tax. This can particularly increase the efficiency of the tax system and enhance the prevalence of the principle of horizontal equity, if income underreporting is a widespread and relatively easy exercise, while hiding property elements from the tax authority is costly, and the collection of property type taxes is simpler and feasible at a lower cost. For example, it is more difficult to hide real estates from the tax authority, although an efficient recording of real properties requires resources, and a property tax which is introduced without serious sanctions and which is easy to circumvent does not contribute to the reduction of tax evasion. For example, in the case of the tax on housing real estate, reporting the housing real estate as company property in order to avoid taxation must be prevented. Otherwise it is exactly those entrepreneurs who will have an opportunity to avoid paying
the new tax who also have better opportunities in evading their income tax. In addition, the introduction of the property tax, if it can be deducted from the personal income tax, is possible through the widening of the tax base in a way that the burdens of current taxpayers will not or only hardly increase.
To summarise the lessons drawn from international experience, it needs to be emphasised that ‘permanent tax reform’, i.e. continuous changing of tax rules year by year generates an unforeseeable economic environment and has a negative impact on tax-compliance attitudes. Terminating the loopholes that result in significant revenue losses and administrative measures against tax evasion is not equal to tax reform. Measures that increase tax compliance over the short run and mitigate and technically prevent tax evasion over the short run do not necessarily result in a longer-term improvement in the tax-compliance attitude. Sweden in the 1980s and the example of Greece show that after learning the new tax rules and finding the loopholes, the level of tax evasion is restored, and tax amnesty even spoils tax-compliance attitude by being easily included in the expectations. However, a consistent and comprehensive package of measures (changing the tax structure, reasonable compromises and administrative rules) contributing a positive change in taxpayers’ attitude (Sweden in the 1990s), may be successful. Increasing the role of local taxes (real estate tax, business tax) may contribute to the improvement of tax-compliance; in this case information is also more direct, and taxpayers can also perceive the benefit of the tax paid.
REFERENCES
BENEDEK, D. ANDLELKES, O. (2007): “Estimating the Incidence
of Income Tax Evasion in Hungary”, paper for AIM-AP.
EC (2004): Undeclared work in an Enlarged Union.
ENGSTRÖMP. ANDHOLMLUND, B. (2006): “Tax Evasion and Self-Employment in a High-Tax Country: Evidence from Sweden”, CESifo working paperNo. 1736.
EPPICH, GY. AND LÕRINCZ, SZ. (2007): “Három módszer a bérstatisztika fehéredés okozta torzítottságának becslésére” (Three methods to estimate the whitening-related distortion of the wage statistics), MNB Occasional PapersNo. 66.
GILES, DAVIDE. A., WERKNEH, GUGSAT. ANDJOHNSON, BETTY
J. (1999): “Asymmetric Responses of the Underground Economy to Tax Changes: Evidence From New Zealand Data”, University of Victoria Econometrics Working Paper EWP 9911.
JOHANSSON, E (2000): “An Expenditure-Based Estimation of Self-Employment Income Underreporting in Finland”,
Working Paper 433, Swedish School of Economics and Business Administration, Helsinki.
JUHÁSZ, JUDIT (ET AL.) (2006): “Migráció és feketemunka
Európában” (Migration and irregular work in Europe), MTA Földrajztudományi Kutatóintézet és Panta Rhei Társadalomkutató (Geographical Research Institute, Hungarian Academy of Sciences and Panta Rhei Sociological Research).
KEEN M., KIM, Y. AND VARSANO, R. (2006): “The ‘Flat Tax(es)’: Principles and Evidence”, IMF Working Paper No. 06/218.
KREKÓ, J. ANDP.KISS, G. (2007): “Adóelkerülés és a magyar adórendszer” (Tax evasion and the Hungarian tax system),
MNB Occasional PapersNo. 65.
LACKÓ, M. (2000): “Egy rázós szektor: a rejtett gazdaság és hatásai a poszt-szocialista országokban háztartási áramfelhasználásra épülõ becslések alapján” (A shocking sector: The hidden economy and its impacts in the post-socialist countries based on estimations of the household electricity method).
OECD (2004): Employment Outlook,Chapter 5.
PISSARIDES, C. A. ANDWEBER, G. (1989): “An
Expenditure-Based Estimate of Britain’s Black Economy”, Journal of Public Economics(39:1) pp. 17-32.
RENOOY, P., IVARSSON, S., VAN DERWUNSTEN-GRITSAI, O. AND
MEIJER, R. (2004): “Undeclared work in an enlarged Union”, European Commission.
RESSLER, R. W., WATSON, J. K. ANDMIXON, F. G. (1996):
“Full wages, part-time employment and the minimum wage”,
Applied Economics,Volume 28, pp. 1415-1419.
SAAVEDRA, P. WITH CONTRIBUTIONS FROMMARCINCIN, A. AND
VALACHY, J. (2007): Flat Income Tax Reforms, in: “Fiscal
Policy and Economic Growth”, GRAY, C., LANE, T. AND
VAROUDAKIS, A. (ed.), World Bank.
SCHNEIDER, F. (1994): “Can the shadow economy be reduced
through major tax reforms? An empirical investigation for Austria”, supplement to Public Finance49, pp. 137-152.
SCHNEIDER, F. (2005): “Shadow Economies of 145 Countries
all over the World: Estimation Results over the Period 1999 to 2003”.
SEMJÉN, A., SZÁNTÓ, Z. ANDTÓTH, I. J. (2001): “Adócsalás és
adóigazgatás – Mikroökonómiai modellek és empirikus elemzések a rejtett gazdaságról” (Tax evasion and tax administration – microeconomic models and empirical analyses of the hidden economy).
SEMJÉN, A. AND TÓTH, I. J. (2004): “Rejtett gazdaság és
adózási magatartás, Magyar közepes és nagy cégek adózási magatartásának változása 1996–2001” (Hidden economy and taxpaying behaviour, changes in the taxpaying behaviour of medium-sized and large Hungarian companies, 1996–2001) MTA KTI (Institute of Economics, Hungarian Academy of Sciences).
SZABÓ, P. A. (2007): “A 2000–2001. évi minimálbér-emelés
hatása a jövedelemeloszlásra” (The effect of the minimum wage increase in 2000 and 2001 on income distribution),
Közgazdasági Szemle,May 2007 (pp. 397-414).
TONIN, M. (2006): “Minimum Wage and Tax Evasion: Theory and Evidence”, manuscript Stockholm University.