GCA Consultant Scheduling Software
A Manuscript Submitted to
the Department of Computer Science and the Faculty of the
University of Wisconsin-La Crosse La Crosse, Wisconsin
by
Drew A Kozicki
in Partial Fulfillment of the Requirements for the Degree of
Master of Software Engineering
May, 2010
GCA Consultant Scheduling Software
By Drew Kozicki
We recommend acceptance of this manuscript in partial fulfillment of this candidate‟s requirements for the degree of Master of Software Engineering in Computer Science. The candidate has completed the oral examination requirement of the capstone project for the degree.
____________________________________ _______________________
Kenny Hunt Date
Examination Committee Chairperson
____________________________________ _______________________
Thomas Gendreau Date
Examination Committee Member
____________________________________ _______________________
Mark Headington Date
iii
ABSTRACT
Kozicki, Drew, A., “GCA Consultant Scheduling Software”, Master of Software Engineering, 04 2010, (Dr. Kasi Periyasamy, Dr. Kenny Hunt, Dr. Thomas Gendreau).
Since the opening of the GCA computer labs at the University of Wisconsin La Crosse, the scheduling of the lab consultants has been done manually. At the start of the scheduling process, each consultant in turn, based on seniority, is assigned a time slot where he or she can come into the head consultant‟s office to sign up for hours in the labs. The head consultant then enters the schedule in an Excel spreadsheet and posts the schedule online. Throughout the semester, if a lab consultant needs to take a shift off, they must enter a request in a designated forum and another lab consultant must state that he or she will pick up the shift. Using the forum to accomplish this task requires that other consultants check for available shifts on a regular basis. This process often leaves labs without consultants since consultants often do not check the forum.
On the administrative side, this process is time consuming to manage. If a shift is left uncovered, the manager must search the forums to see who was supposed to cover the shift. No rules are in place limiting the number of times the consultant covering a shift can change, which causes the tracking of a shift to be a “connect the dots” puzzle. This makes tracking and disciplining the consultant responsible for the shift a time consuming process.
This paper describes a software application designed to provide administrative support for the scheduling of GCA consultants. The application was developed at the University of Wisconsin La Crosse in coordination with the GCA department.
iv
The application provides the consultants with the ability to: view lab schedules, sign up for shifts, request shifts off, and sign up for notifications of open shifts. The application provides the head consultant with the ability to: create and edit lab schedules, assign shifts to consultants, monitor consultant activity, and view shift reports.
v
ACKNOWLEDGEMENTS
I would like to express my sincere thanks to my project advisors Dr. Kenny Hunt and Dr. Thomas Gendreau for their valuable guidance. I like to thank the project sponsor, the GCA group of University of Wisconsin La Crosse who initiated this project and provided the support for this project. I would also like to express my thanks to the Computer Science Department and the University of Wisconsin-La Crosse for providing the computing environment for my project. Finally, I wish to thank my friends and family who had to tolerate me through the course of this project.
vi
TABLE OF CONTENTS
ABSTRACT ... iii
ACKNOWLEDGEMENTS ... v
TABLE OF CONTENTS ... vi
LIST OF TABLES ... viii
LIST OF FIGURES ... ix
GLOSSARY ... x
1. Introduction ... 1
1.1 Project Description... 3
1.2 Project Stakeholders... 4
2. Project Lifecycle Model ... 5
2.1 Brief introduction to software life cycle models ... 5
2.1.1 Waterfall Method ... 5
2.1.2 Agile Development ... 7
2.1.3 Iterative and Incremental Development ... 6
2.2 Selected Model... 8 3. Requirements ... 10 3.1 Initial Requirements ... 10 3.2 Changes in requirements ... 12 4. Design ... 13 4.1 Design ... 13
4.2 Final Class Diagram ... 18
4.3 Overall Description of the classes ... 19
5. Implementation ... 23
5.1 Languages and tools used ... 23
5.2 Coding Phase ... 24
5.3 Presentation Decisions ... 26
5.3.1 Editing a Semester ... 26
5.3.2 Editing a Lab ... 27
5.3.3 Editing Waves ... 28
5.3.4 Viewing a Lab Schedule ... 29
vii
7. Status ... 33
7.1 Limitations ... 33
7.2 Future Work ... 33
8. Conclusion ... 34
8.1 Things that worked well ... 34
8.2 Things that didn‟t work well and I would do over ... 34
8.3 Cost estimation versus final results ... 34
9. Bibliography ... 37
10. Appendix A: Initial Design ... 38
viii
LIST OF TABLES
ix
LIST OF FIGURES
Figure 1-1. Example schedule from old system ... 2
Figure 2-1. A diagram of the Waterfall method ... 6
Figure 2-2. an iterative development model ... 7
Figure 3-1. Use Case Diagram ... 12
Figure 4-1. 3 Tier Design ... 13
Figure 4-2. Original ER diagram ... 14
Figure 4-3 Original Class Diagram for the Business Tier and DatabaseLogic Class ... 16
Figure 4-4. Revised ER Diagram ... 19
Figure 5-1. Edit Semester Screen ... 27
Figure 5-2. Edit Lab Screen ... 28
Figure 5-3. Edit Wave Screen ... 29
Figure 5-4. Lab Schedule (Manager‟s view) ... 30
Figure 5-5. A consultant's view of a lab schedule ... 31
Figure 10-1. Initial ER Diagram ... 38
Figure 10-2. Use Case Diagram ... 39
x
GLOSSARY
Verification
A process that confirms a development process or activity or task to be correct. Validation
A process that confirms that the product (or partial product) meets the expectations.
Testing
A type of validation applied to source code. GCA
General Computer Access of University of Wisconsin La Crosse Lab Consultant
An individual in charge of monitoring a lab. The duties include general maintenance on the printers and answering lab users‟ computer related questions. Lab
A room with multiple computers for general computer usage for students. Wave
A group of lab consultants that can sign up for up to a predefined number of hours at a given time.
Web Application
An application that uses web sites as the GUI layer. ORM Classes
xi
Object-Relational Mapping Classes. These are used to have an entity or class represent a table in a relational database
Relational Database
A relational database matches data by using common characteristics found within the data set. The resulting groups of data are organized and are much easier for many people to understand
Assertion
In computer programming, an assertion is a predicate (i.e., a true–false statement) placed in a program to indicate that the developer thinks that the predicate is always true at that place.
Example: For every foreign-primary key relationship, every foreign key in the relationship must have a primary key with that value.
KLOC
1000 lines of code ASP.NET
A web application framework developed by Microsoft and allows web pages to be written in any of the .NET supported languages.
ADO.NET
A set of computer software components for the .NET framework used to access data and data services.
Internet Information Services (IIS)
A web server application created by Microsoft for use with Microsoft Windows. LINQ to SQL
A Microsoft .NET Framework component adding native data querying capabilities for databases to the .NET languages.
xii
Pronounced “see sharp”, is a programming language developed by Microsoft for the .NET Framework. It has roots based in several programming disciplines including, imperative, functional, generic, and object-oriented.
1
1.
Introduction
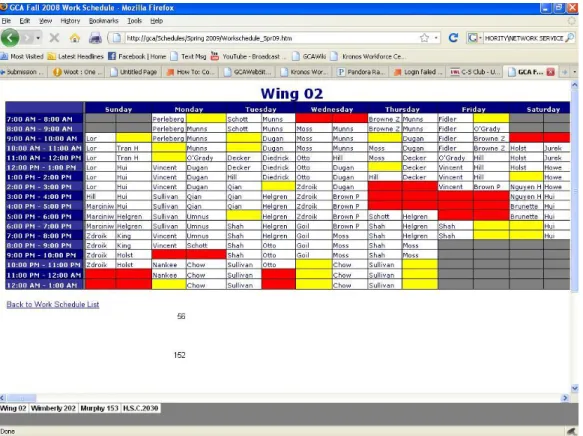
The ability to schedule and manage lab consultants is a challenging and time-consuming task as evidenced by a recent proposal by IT staff to hire two full time positions dedicated to managing the lab consultants. The scheduling of consultants can be divided into several main tasks. One is organizing or separating the consultants into groups or waves. After separating into waves, another task is having the consultants come in by wave at a certain time to sign up for hours. This task is complicated for many reasons. Consultants are not always able to make it into campus to sign up for hours. To determine the number of hours a consultant can sign up for, requires taking the following into consideration: what semester are they signing up for, has that semester begun, does the consultant belong to wave, if so is it past the wave‟s sign up time, and does the consultant have any special considerations restricting the number of hours he/she can work for (international students, how many classes are he/she signed up for, etc.). Ensuring that lab consultants do not sign up for more hours than they are allowed to work is time consuming for the head consultant and is prone to human error. When mistakes are found another consultant must be enlisted to take the shift vacated by the reduction in hours. It is not always possible for the head consultant to find a permanent replacement after sign up is complete. After all the consultants have finished signing up, another task for the head consultant is inputting the schedule into an Excel spreadsheet. Figure 1.1 shows an example of such a spreadsheet.
2
Figure 1-1. Example schedule from old system
Although this technology supports lab scheduling it is tedious to maintain and prone to errors due to manual entry. In addition, it is difficult for a consultant to read his/her schedule. As an example of the cumbersome nature of this technology, the schedule for a consultant cannot be viewed as a report but must be viewed by clicking on every lab and textually searching for his or her name.
For a consultant to request time off in this system the only tool available is a forum. A consultant initiates a topic and posted the time that they need to take off. Then another consultant must browse through the forums and find any shifts that he or she wants to pick up. The forum is ordered by the time of creation, and not by order of the shifts themselves. This process is time consuming for both the consultants and the head consultant. The consultants must determine times they are able to pick up more shifts, find shifts within topics for those times, and see if those shifts are still available. If no one showed up for a shift, the head consultant
3
must search through all of the topics to determine if the original consultant had requested the shift off and if another consultant agreed to cover the shift then repeat the process in case the second consultant requested the shift off and so on.
1.1 Project Description
The goal of this project is to reduce the work load of the head consultant; enough to eventually eliminate the need for a person whose sole responsibility is scheduling of the other GCA consultants. The work could then be delegated to the GCA manager.
The GCA Scheduling Software takes on the role of managing the consultants and enforcing the domain rules related to the GCA scheduling. The GCA manager is only responsible for initializing the scheduling process which involves inputting who is in each wave, the maximum number of hours each person in that wave can sign up for, when the individuals in that wave can begin signing up, and any special circumstances for consultants where the number of hours they can sign up for differs from the default.
The software reduces complications involved for the consultants. The consultants are able to sign up for shifts anytime after their signup has been enabled by the software, and can only sign up for the predetermined number of hours. This can be done from any computer on campus and does not require the supervision of the manager. The consultants are able to logon at anytime to view their schedules, this will display their entire schedule on one screen without the clutter of other consultant‟s shifts. While viewing their schedules, the consultants can select a shift to request it off, selecting either for an individual day or for the rest of the semester. The consultants are also able to view all available shifts in a weekly format, excluding any that have already been picked up by another consultant. If a consultant picks up a shift it will then appear on his/her personal schedule. Consultants are also able to sign up for daily email reminders of open shifts.
4
The program keeps a log of each shift so the manager knows what has changed. When someone doesn‟t show up for a shift, the GCA manager can just view the history of the shift and find out who was suppose to be there. This eliminates the “connect the dots” puzzle of the previous forums and turns it into selecting the shift that was missed. Due to the power of the web application, it reduces the amount of time spent managing the consultants.
1.2 Project Stakeholders
The major stakeholder in the project is the GCA department of the University of Wisconsin La Crosse. Eliminating the need for a head consultant reduces a full time paid position, reducing the budget needs for the department. The GCA manager also benefits because the workload of managing consultants is reduced. The GCA consultants benefit by having software dedicated to scheduling and managing their shifts.
5
2.
Project Lifecycle Model
2.1 Brief introduction to software life cycle models
A software development process is a structure imposed on the life cycle of a software product. Software developers can choose from many life cycle models or variations of them. The most common life cycle models include the waterfall model, rapid prototyping, incremental prototyping, and agile development. Each of these models has its own strengths and weaknesses. The model that should be chosen for use on a particular software project is determined by the team‟s strength and abilities, the customer‟s demands, project deadlines, and the nature of the project.
2.1.1 Waterfall Method
The waterfall method describes a basic methodology of emphasizing focus on the design before implementation. This method derives its name from having one phase of the project completed before the project moves forward. This method works the best when the customer doesn‟t need to see a prototype within the first phases of the project. The customer must know most of the requirements before the development process can begin. If at any point during the life cycle a bug is found, the project must go back to the phase the bug originated in, make the necessary changes, and step back through the phases.
6
Figure 2-1. A diagram of the Waterfall method [1]
The waterfall phases include, but are not limited to: requirements gathering and analysis; design; implementation (coding); testing, validation, and verification; deployment; and maintenance.
One of the variations on the waterfall model is the Sashimi model. This model is an implementation of the waterfall model; the key difference is phases overlap. This overlap allows the design flaws to be seen and corrected earlier. In this method the general design should still be finished before beginning the implementation.
Another variation is big design up front. This method puts heavier emphasis on the design document being perfected before continuing to the implementation. However, most companies do not use this method believing that it is not agile enough to meet customer demands.
2.1.2 Iterative and Incremental Development
The basic idea of iterative development is to address the weaknesses of the waterfall model. The goal is to take the project and separate it into pieces. After separating, the next step is to complete one piece at a time using a mini version of
7
the waterfall method. The customer can then have a better idea where the project is headed and it is also easier to track progress.
Figure 2-2. an iterative development model [2]
Waterfall development completes a project wide phase in a single step before moving on to the next phase. The final product is delivered all at once, and only at the very end of the life cycle. However, having part of the product be released is possible in an iterative approach.
Iterative development is quicker to expose weaknesses in the design document. If at any time there is difficulty in coding or testing a piece of the project, that piece should be redesigned. This is usually a sign that the design document has some problems and ignoring the problems will cause more problems later on.
2.1.3 Agile Development
Agile Development describes a methodology focused on feedback over design. The feedback can be from numerous sources including software testers and the customer. One variation of Agile Development is known as Extreme Programming (XP). In XP, the phases are carried out in extremely small, or continuous, steps compared to the older batch processes. The intentionally incomplete first pass through the steps might take a day or a week, compared to the months or years of each complete step in the waterfall model. First, the automated tests are written, to provide concrete goals for development. Next is
8
coding, which is complete when all the tests pass and the programmers can't think of any more tests that are needed. Design and architecture documents emerge out of refactoring, after coding. Design is done by the same people who do the coding. Only the last feature, merging design and code, is common to all the other agile processes. The incomplete but functional system is deployed or demonstrated for some subset of the users. Other variations of Agile Development include Rational Unified Process and Scrum.
2.2 Selected Model
The following items were taken into consideration when determining which lifecycle model to follow. First, most of the requirements were know at inception and the project showed very little risk of having the requirements changed by completion. The developer had little experience or expertise in writing scheduling type software. The developer will not be part of the code maintenance phase. The future of the GCA Labs after the developer leaves the GCA department is very unpredictable. The application had to integrate with an existing web application. This limited the number of development tools and programming languages available to developer.
Taking all items into consideration, the waterfall method was selected. The pros of choosing this model are the following: the waterfall method focuses on early design and keeping the documentation accurate, making changes easier for future developers; the implementation phase followed the design documentation which gave a structured class diagram to follow; test cases were created based on the use case diagram; and the GCA manager was able to see GUI prototypes before approving the GUI requirements document, ensuring the program‟s usability.
This model had some risks. One is the developer‟s lack of experience in writing a scheduling or calendar based application. Due to this lack of experience, it was probable that there would be initial design flaws. Another risk was a potential for
9
a significant delay in the project, had the requirements changed dramatically. This would have caused a high number of changes to the documentation. While no formal risk analysis was performed, each of these factors was taken into account by the developer when selecting the lifecycle model for use on this project.
10
3.
Requirements
3.1 Initial Requirements
The initial requirements were planned in meetings between the developer and the GCA manager, the biggest stakeholder of the project. Before beginning this project, the need for scheduling software for the consultants had already been discussed over three different head consultants. The first meeting with the GCA manager took place on December 8, 2008, the requirements were clearly stated and the documentation began. On July 15, 2009, the functional requirements documentation was complete and the work on the presentation layer began. The next meeting with the GCA manager was on November 4, 2009, this was for a presentation layer demonstration and to finalize the requirements and design documents. Several changes were made to the presentation layer and the project moved to the next step of the waterfall model.
There were a total of three meetings between the developer and the GCA manager before the coding phase began. During these meetings, a total of seventeen use cases were made.
12
Figure 3-1. Use Case Diagram
A use case diagram gives a graphical overview of the functionality of an application, as displayed in Figure 3-1. Each use case relationship is shown by starting at an actor on the left and following a line to a use case in the middle. Any line leading to the right from the use case shows any additional actors needed to complete the use case. The use case illustrates what the user can do with the application. Continuing from the use case to a user on the right illustrates what user, if any, the application needs to complete the use case. From the diagram the following use cases and requirements were prioritized: a lab schedule must be color coordinated, consultants can sign up for shifts, consultants can request shifts off, consultants can pick up another consultant‟s shift that has been requested off, managers can add and remove consultants, managers can setup semesters, and the system must send daily summaries of open shifts to any subscribing consultants.
3.2 Changes in requirements
Several small changes in requirements were made during the development of the project. A report generator was requested for the GCA manager to determine the number of shifts a consultant has requested off. Also requested was the ability for a manager to assign a consultant to a shift for one week rather than an entire semester. As predicted, there were no changes to the requirements that caused the project to cease progress and revert back to the design phase.
The budget constraints of the 2010 fiscal year for the university forced the elimination of the head consultant position before the completion of the project. This change moved the responsibilities to the GCA manager creating more tasks than he/she was able to maintain, creating a deadline on the project.
13
4.
Design
4.1 Design
The design was comprised of fourteen non-presentation classes. It was based on the standard three-tier layering of logic
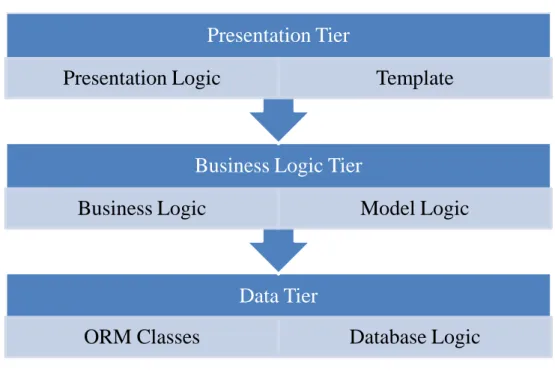
Figure 4-1. 3 Tier Design
A three tier design consists of a presentation tier, business logic tier, and a data tier. The presentation tier is responsible for user interaction. This involves having the correct screens appear based on logged in status, and taking the data from the business tier and displaying the information to the user. The presentation tier can be broken down into two main components: the presentation logic component, which generates the dynamic html; and the base template component. The business logic tier is responsible for data validation, data organization, and enforcing business rules and policies. The business tier can be broken down into two main components: business logic and model logic. The business logic is responsible for validating input from the presentation tier and the model logic layer retrieves the data from the data tier and formats it for the presentation tier.
Data Tier
ORM Classes
Database Logic
Business Logic Tier
Business Logic
Model Logic
Presentation Tier
14
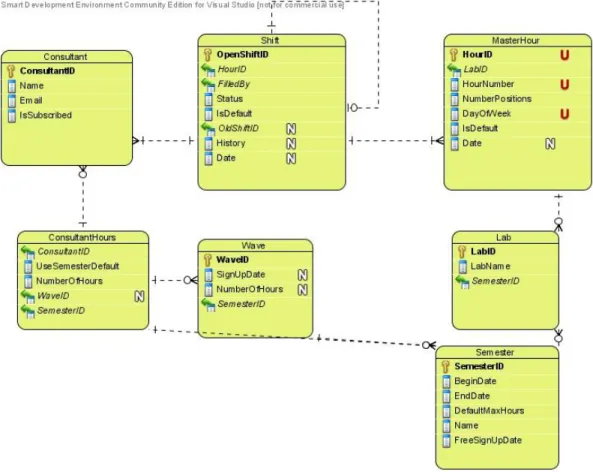
The data tier is responsible for the database transactions, such as sending and retrieving data. Figure 4-2 shows the original ER design. Each table has an equivalent class in the code.
Figure 4-2. Original ER diagram
The model logic sub-tier consists of two classes. This sub-tier saved a significant amount of work in writing the presentation logic. To receive information on a lab or consultant‟s schedule, the presentation logic was given an instance of the appropriate class in the model logic layer and retrieve the appropriate property. For example, the presentation layer needs to retrieve how many more consultants are needed for a given shift. This data became expensive to retrieve in both development time and computation, requiring four calls to the database for each shift. To retrieve this information the first step is having the
15
program determine the number of consultants required. This is done by determining if any special changes were made to the specified hour for that week, if not take the default number for the shift. The next step is to take the number of required consultants and subtract the number of consultants scheduled for that shift. Finally, take the result and add the number of consultants who requested off that shift and have not had his or her shift covered. This work was done, along with calculations for finding other relevant information about a shift, in the LabSchedule class for the presentation logic.
The two classes also increased the performance of the program by caching relevant information. For example, the page to view a lab‟s schedule views an entire week‟s worth of shifts in a single page. With twenty-four shifts a day, seven days a week, this would have required 672 database calls to display the number of open positions for all shifts in a week. However, the LabSchedule class requires five database calls to not only gather the data needed for one shift but all relevant data for an entire week. For this portion of the program, this introduces a theoretical speedup of over 125. This is only theoretical as data caching of the hard drive and memory affect the actual total speedup.
16
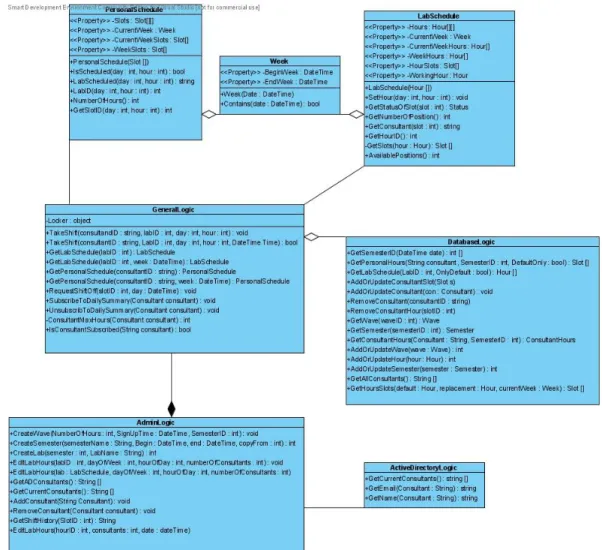
Figure 4-3 Original Class Diagram for the Business Tier and DatabaseLogic Class
The General Logic class is the main client class for the presentation tier, all data inputted into the business tier is put into this class or a class descending from it. The Admin Logic class descends from the General Logic adding functionality needed by the GCA Manager. The General and Admin Logic classes ensure atomic transactions preventing potential concurrency problems from multiple users using the application at the same time. The Personal and Lab Schedule are the presentation abstraction classes. The classes are described in detail in Table 4-1. This design results in a very robust business tier. The code library from the
17
business tier‟s only has public methods that are able to be safely called at any time. The business tier performs checks on any user entered data into public methods to confirm the operations are safe to execute. Figure 4-3 shows the original class diagram for the business tier including the one class from the data tier.
Developing a design that complied with the existing web application required the developer to gain intimate knowledge of the existing web application. After analyzing the existing application, the developer realized the requirement of, “only consultants and managers are able to view this application, only managers are able to view the semester configuration pages,” required the existing web application to be refactored. The existing web application was comprised of legacy code, which made it difficult to integrate into the new system.
Another setback in the design surfaced due to the nature of web applications being entirely user event driven. No program is running in the background, only code which is executed by the web server when a user requests a page. This web application needs to send out an email at midnight every day. This was not factored into the design document at the time of its creation, due to no known solution by the developer. However during the implementation phase, a solution was found.
Creating the database design presented a roadblock. The developer had no prior experience with a database design for a calendar-based application. One possible solution included creating rows in the database for every occurrence of a shift. This was determined to create a high risk for bugs, because editing a lab schedule would require taking the difference of two sets of shifts to edit the database. Another possibility included having separate tables for the default week for a semester and one for any edits for a week. This was originally thought to have many special conditions and boundary checks; however, the final solution was based on this idea.
18
An advantage of having chosen the waterfall life cycle was the ability to calculate a more accurate project timeframe once the requirements were gathered. After the use case diagram was finished, a cost estimation algorithm was run using Karner‟s method originally developed in 1993 [6]. The following formula resulted: a total of ten Unadjusted Actor Weights and 160 Unadjusted Use Case Weights results in a total of 170 Unadjusted UCP. The Technical Factor was given a rating of .93 and an Environmental Factor of 1.4. This resulted in an adjusted UCP of 221.34. Given the assumption of requiring 20 person hours per UCP, the cost estimation based on use cases came out to be 4426.8 hours. This cost estimation will be discussed in the conclusion.
4.2 Final Class Diagram
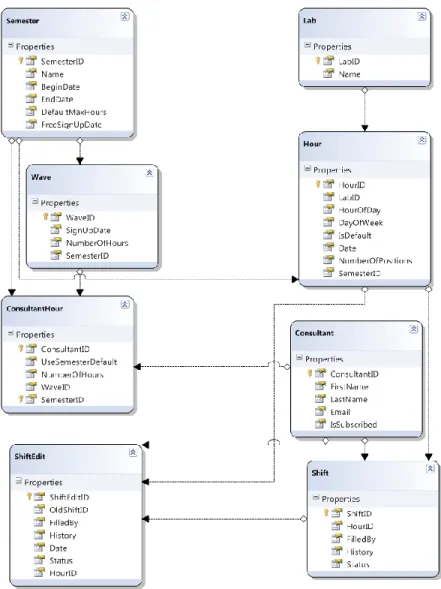
The only difference between the original and final class diagram was the addition of ShiftEdit class. This class was the result of an added table in the ER diagram. Figure 4-3 shows the final ER diagram.
19
Figure 4-4. Revised ER Diagram
4.3 Overall Description of the classes
The original intent of every class did not change throughout development, although some classes became more useful than originally predicted as the developer realized that they could be used to help write methods in other classes. The lab and personal schedule classes became some of the most used, despite
20
having originally been designed for the presentation layer to utilize. The classes described in the design document are summarized in Table 4.1.
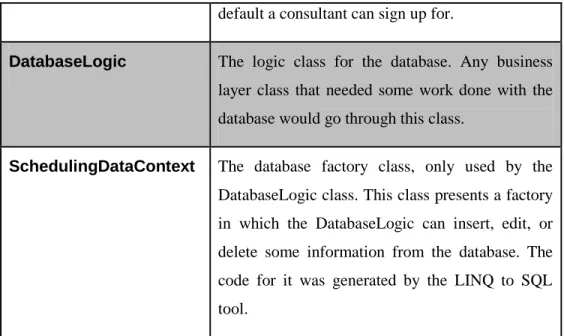
Class Name Description
GeneralLogic The core logic class. Any page that wanted information used this class to retrieve it. From outside the library the class can only be constructed by consultants. This class would check assertions and return any information the page needed.
AdminLogic This class extended from GeneralLogic. This class has more power than the GeneralLogic but only can be created by managers.
PersonalSchedule A class that made the information available at the business layer and turned it into clean presentable method calls convenient for the presentation layer. This class would have any information needed about an individual consultant‟s personal schedule.
LabSchedule A class that made the information available at the business layer and turned it into clean presentable method class convenient for the presentation layer. This class would have any information needed by the presentation layer about a given lab‟s schedule.
ConsultantHour This is an ORM class. The point of this class is to specify the many-to-many relationship between Consultants and Semesters. The class also does
21
keep track of few more items including the wave the consultant belongs to for that semester, whether or not the consultant is using the semester default for a maximum number of hours, and if not then what is the maximum.
Lab The ORM class for a Lab. Basically just a unique ID and a name.
Consultant The ORM class for a Consultant. States properties such as first name, last name, email address, and username.
Shift ORM class for a default shift. This is filled out when a consultant signs up for a shift for the entire semester.
ShiftEdit ORM class to make changes to a shift. This class helps specify a single shift where something may have changed, including a consultant requesting time off.
Wave ORM class for a wave. This specifies number of hours and when the group of consultants can sign up.
Hour ORM class for a given hour. This specifies how many consultants are needed at a given time for a lab.
Semester ORM class for a semester. Specifies begin and end dates, the semester‟s name, when all consultants can sign up, and how many hours by
22
default a consultant can sign up for.
DatabaseLogic The logic class for the database. Any business layer class that needed some work done with the database would go through this class.
SchedulingDataContext The database factory class, only used by the DatabaseLogic class. This class presents a factory in which the DatabaseLogic can insert, edit, or delete some information from the database. The code for it was generated by the LINQ to SQL tool.
23
5.
Implementation
5.1 Languages and tools used
The existing web application was written in ASP.NET. The .NET framework includes a virtual machine to run compiled intermediate code and collection of built in libraries. It installs into Microsoft‟s operating systems and is used to run interpreted programming languages developed by Microsoft. This limited the possible languages for the project to those supported by the .NET framework. The most commonly used of these languages, for web development, are Visual Basic and C#. C# was the selected language because it presented the fastest learning curve to the developer.
The tools used consisted of Language Integrated Query to SQL (LINQ to SQL), ADO.NET, ASP.NET, Microsoft Visual Studio, Visual Paradigm, and IIS web services. LINQ, or Language Integrated Query, to SQL is an ORM tool used to map a class to a table in the database and present a database factory for retrieving, editing, and inserting entities into the database. Using a SQL like language native to C#, all these actions can be performed by type safe code checked at compile time. ADO.NET is used to retrieve basic lists of items from a database and populate a list in the presentation layer. For example, populating a drop down list with all the consultants is done by providing the list with a SQL select statement to retrieve consultant names from the database. Then ADO.NET populates the list with the names of the consultants every time the page is displayed. When the user selects a consultant and submits the page, the program calls the list to determine which consultant was selected. Web services provide a class library-like interface that a program can call over the network. A program, running on a machine connected on the same network as the web server, can call a method on the web server as though it was calling any other method in itself, except the code is executed on the side of the web server. “Web services are
24
typically application programming interfaces (API) or web APIs that can be accessed over a network, such as the Internet, and executed on a remote system hosting the requested services.” [3]
Due to using LINQ to SQL, portability of databases is very limited. If the university wanted to change SQL servers there would have to be a LINQ to SQL driver for that database server. However, this was considered an unlikely scenario and put into the assumptions of the requirements.
5.2 Coding Phase
The design document was followed closely throughout implementation. The development phase only had a few problems, resulting in three weeks of setbacks. The most severe bug was found during coding due to a logic flaw in the design document. In reality a lab does not belong to a semester; semesters don‟t contain multiple labs, so having labs keep track of which semester they belong to seemed illogical. However, since this logic flaw wasn‟t developing any bugs at the time, it was decided that the cost of changing the flaw would be higher than continuing development with it. This later proved to be a mistake.
During coding the existing web application‟s authentication logic needed to be redesigned. The existing authentication system provided a subset of the built in ASP.NET functionality. The main feature provided by ASP.NET that caused the redesign is its ability to do automatic security filtering. ASP.NET looks at the roles allowed to view a certain page, what user was logged in, and determine if the user belonged to any of the roles allowed to visit the page. However, some the parts of the existing authentication were still needed. The existing web application mapped user‟s roles to the user‟s active directory groups. To determine the user‟s roles took discovering what groups he/she belonged to and map those groups to the roles. If one of those roles were allowed to view the web page the user is passed through. Unfortunately, the security checking was the responsibility of
25
each web page, whenever a user requested a page the code for the check would have to be executed by the page. This created the potential for security flaws as developers can forget to put in this security check after they‟re done developing the web page. After consulting with the GCA manager the developer refactored the existing web application to use ASP.NET‟s security filter. This took the authentication check out of the presentation logic and placed it into an XML file for the web server to use. During refactoring another issue was found in the legacy code. The code discovering which groups a user belonged to would not traverse up the group tree. For example, if a group named students consisted of several sub groups, grouping the students by the first character in their name, like sStudents, a user Steven belonging to sStudents would not be discovered as belonging to the group students. Fixing and refactoring these issues set development back two weeks. After the three tiers were integrated together only minor bugs were found.
Also during development a solution was found for emailing daily alerts. Since web applications are event driven it is difficult to email all consultants based on time of day. The first consideration of how to do this was to write a separate program that runs every day at midnight on the server using scheduled tasks. This was an undesirable solution as it would involve maintaining two different programs. The program would need its own copy of the database layer and whenever a bug was found in one copy, the other would have the same bug and need to be changed. Sharing a compiled library file was not possible as the compiled version of the code is in memory on the web server.
After more research was done, a more desirable solution for emailing daily alerts was found. This solution involved creating a separate program that only made a single method call to web services. This still requires a separate program; however, it didn‟t have a dependency on the database tier. The program consists of less than twenty lines of code. This program is scheduled using Windows Server 2008‟s process scheduling service and creates the event needed to initiate
26
sending out emails. The logic for sending out emails is within the web application, requiring only one copy of the business and data tiers.
After the coding phase was complete, the developer ran the COCOMO model to compare COCOMO cost estimation versus the use case cost estimation. The total lines of code came out to approximately six KLOC. Using the formula of man-months = a*KLOCb and inserting in Halstead‟s values, a=0.7 and b=1.5, resulted in the fewest number of hours at 1565.6 hours [4]. At the end of the coding cycle the total hours were at approximately 500. The total number of hours actually worked is difficult to predict due to testing by third parties.
5.3 Presentation Decisions
The goal of the web pages for the manager is to create a semester, edit the labs hours during the semester, edit the consultants, schedule when consultants can sign up for hours, and monitor all the labs and consultant‟s schedules. The website supports this functionality using a series of pages.
5.3.1 Editing a Semester
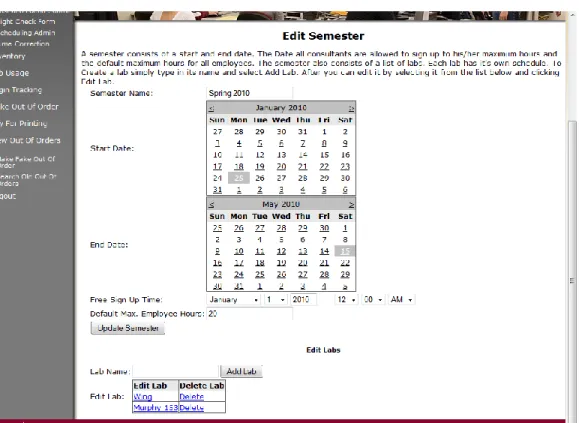
The edit semester screen (Figure 5-1) allows the manager to edit information about a semester. Here a manager can edit any of the lab‟s hours, assign a free sign up time, and assign the default maximum number of hours an employee can sign up for after this time. The create semester screen looks similar, having semester name, start date, and end date options.
27
Figure 5-1. Edit Semester Screen 5.3.2 Editing a Lab
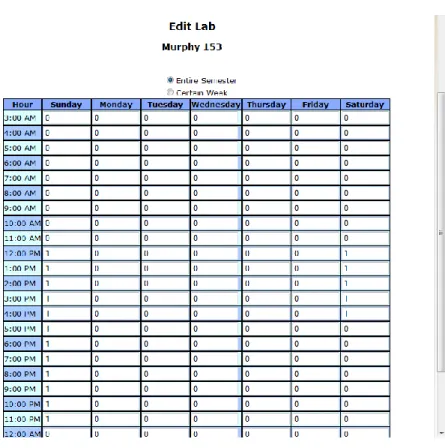
For a manager to input how many consultants are needed for a shift, the manager must go to the edit lab screen (Figure 5-2). Given any hour of the week the manager can specify how many consultants are needed for that shift on a default or specific week. For instance, the week of spring break requires fewer consultants, or during finals more are needed, so the manager would browse to these weeks and input in the change.
28
Figure 5-2. Edit Lab Screen 5.3.3 Editing Waves
By editing the waves of a semester the manager allows certain consultants to sign up before the other consultants. This also gives the manager power to allow consultants to only sign up for a certain number of hours, until all consultants get a chance to sign up. A wave consists of the number of hours allowed, the sign up time, and a collection of consultants in that wave. The wave sign up time must be before the free sign up time of the semester. On the edit wave screen (Figure 5-3); the GCA manager is able to configure the waves for a given semester.
29
Figure 5-3. Edit Wave Screen 5.3.4 Viewing a Lab Schedule
The GCA manager must be able to view the complete lab schedule. He/she does this by browsing to the same page as the consultant. Instead of being able to pick up shifts through the page, the manager can click on an existing shift and view its history. Figure 5-4 shows a screen shot of the lab schedule page when the GCA manager is logged in. Figure 5-5 shows a screen shot of when a lab consultant views the same page.
30
31
32
6.
Testing
The testing of the project took place in several phases. There was unit testing that occurred during development. As each unit was developed, integration testing was done. After all units were developed, final integration tests were done based on the use case diagram. Each use case was performed and after all were completed successfully the manager started testing it. Appendix B has the results of the tests.
After some early manager testing, an error did occur. The manager could not delete some existing semesters. The error came from an assertion from foreign and primary keys in the database. When deleting a semester was attempted, the shifts that belonged to that semester were not deleted, resulting in a foreign key conflict. After analyzing the design document it was determined that the root of the error occurred in the design phase from having semesters contain a collection of the labs. This was the same design error mentioned earlier.
After careful consideration of how to fix the bug, it was determined that the incorrect design decision leading to this bug could also have lead to some other, undiscovered bugs. Based on this hypothesis, the decision was made to redesign the layout of the ER diagram, rather than patching the bug. The redesign and analysis set the project back a day. It was possible to prove where the root of the bug was; therefore the project was put back into testing. This proved to be an advantage of the lifecycle model chosen. However, it is possible that an iterative development cycle would have discovered this bug sooner.
The final testing is done by the consultants. While the developer is still employed by the GCA department, any issues can be submitted or changes can be requested to the developer. This marks the end of the testing phase and the beginning of the maintenance phase.
33
7.
Status
7.1 Limitations
All of the requirements stated in the requirements document are completed to satisfaction.
7.2 Future Work
Part of the initial requirements consisted of the program being adaptable, as a high probability exists that this program will have to change to meet new requirements of the consultants or GCA manager. The program contains data capable of improving the existing parts of the web application as well as future additions. The program is believed to fulfill the requirement of being adaptable. Not being a measureable requirement though, this can‟t be proven.
Currently the application does not provide the ability for a manager to input that a lab is open but no consultants are needed. Developing this feature would provide more power and accuracy to other parts of the website.
One future goal of the project is to allow lab schedules to be put into the system. This will allow for better integration with other applications of the existing web application. Another web page could show when the labs are open to the general public. Another application could generate lab utilization reports that show the percentage of time a computer is used while the labs are open. This application could use the lab schedule to determine how many hours the labs were open. This is only possible because of the developer‟s decision to change the ER diagram so a lab was not contained in a semester.
34
8.
Conclusion
8.1 Things that worked well
Following the waterfall lifecycle was probably the best choice of the possible lifecycles. The project worked like a waterfall completing the entirety of one phase before moving onto the next. Only once did the project have to move backwards to fix issues from an earlier phase. The documentation exceeded what I would have expected to result from an Agile or Iterative development because they do not focus as much on a good design up front. Since they do not focus as much on a good design up front, I would not have decided to create a Lab or Personal Schedule class. These classes I believe considerably reduced the number of hours I spent on the Presentation Tier.
The programming language chosen worked well. The total code generated is approximately 6,000 lines of code. The developer could complete most tasks using very precise, easy to understand, code. The built in support for page templates and custom user controls resulted in all the pages having the same look.
8.2 Things that didn’t work well and I would do over
There were other parts of the database, some created before the project and some created after, that could contain more features by using the data out of this application. These include items like the out of order application. In order to fill out an out of order the user must select what lab they are in, the labs in the current out of order application need a reference to what building they are in, how many computers are in them, etc. Integrating this in with the labs from the GCA scheduling software would make the website as a whole seem more organized.
8.3 Cost estimation versus final results
The early cost estimation based on use cases resulted in over 4000 person hours with later estimations ranging over 1500 person hours. Since the project was
35
completed in approximately 500 person hours, these estimations are three to eight times the number of actual person hours required to complete the project. The developer hypothesizes the use case estimation was off for several reasons. The use case estimation does not account for the tools used in generating the Data Tier (the database actor). There have been many advances in tools used for generating database tables and generating code that communicates with the database since the development of this model in 1993. The developer only had to enter an ER diagram into the development tool, and then the tool generated the database tables and most of the data tier code. The resulting person hours needed per Use Case Point generated from a weighted factor that has a dependency on the database actor should have been lowered from twenty to five to account for the use of this tool. The complete code for the ORM classes and table generation of the database took less than a day. The developer also hypothesizes the use of ASP.NET over other common web development technologies could have also been a factor in the initial overestimate because ASP.NET presents a more object oriented interface to the presentation layer then other common web development technologies. This allows for setting and retrieving fields in the presentation layer to be the same as accessing properties in an instance of a class. The developer believes this interface reduced the person hours needed to develop the presentation layer.
For the COCOMO model, following the hypothesis used from the error in the Use Case Estimation, changing parameters „a‟ and „b‟ to a custom model suited for the environment and the size of the project would have generated a closer result. The original chosen model was Halstead‟s with the equation 0.7 KLOC1.5. Adjusting the values to 0.4 KLOC1.1 would have generated a closer result of 436 person hours. The reduction of 1.5 to 1.1 accounts for the development studio used. The modern development studios allow for quicker access to method and property names over earlier studios. The reduction from 0.7 to 0.4 accounts for the amount of code the tools automatically generated. The code generation
36
reduces testing time as well as development time as the tools have been previously tested for correctness.
37
9.
Bibliography
[1] http://en.wikipedia.org/wiki/Software_development_process, April 10, 2010.
[2] http://en.wikipedia.org/wiki/Iterative_development, April 10, 2010.
[3] Richardson, L., Ruby, S., & Heinemeier, D. Restful Web Services, Boston: Twayne Publishers, 2007.
[4] B. Boehm, Software Engineering Economics, Prentice Hall, 1981.
[5] B. Boehm et al., Software Cost Estimation with COCOMO II, Prentice Hall, 2000.
[6] Karner, G. “Metrics for Objectory”, Diploma thesis, University of Linkping, Sweden. No. LiTH-IDA-Ex-9344:21, December 1993.
38
10.
Appendix A: Design Diagrams
39
40
41
11.
Appendix B: Test Cases
Purpose of Test Create SemesterInput Name: Spring 2010 Begin: January 28, 2010 End: May 25, 2010
Free Sign Up Time: January 28, 2010 Default Maximum Hours: 20
Expected Output The semester should appear in the database and the ability to edit the semester‟s labs.
Actual Output The semester in the database. Labs available to be added or removed.
Result Pass
Purpose of Test Test Semester‟s Boundaries Input Name: Spring 2010
Begin: January 29, 2010 End: January 28, 2010 Begin: January 1, 2010 End: January 28, 2010 Begin: May 25, 2010 End: May 26, 2010
Free Sign Up Time: January 28, 2010 Default Maximum Hours: 20
Expected Output For each pair of inputs the following results. 1. Error: End date must be after end date 2. Error: Overlapping semesters
3. Error: Overlapping semesters
None of these attempts should appear in the database Actual Output The expected exceptions
42
Result Pass
Purpose of Test Create Lab
Input Lab Name: Murphy 153
Expected Output Murphy 153 appearing in a list to edit the hours for the semester.
Actual Output The Lab in the database with Murphy 153 appearing in the list.
Result Pass
Purpose of Test Edit Consultants needed for the Lab Input Lab Name: Murphy 153
Consultants Needed: 2 at Noon on Wednesday Consultants Needed: 2 at Noon on Thursday
Consultants Needed: 1 at Noon on Wednesday January 3rd Consultants Needed: 1 at Noon on Wednesday April 7th Expected Output For each input the following output was expected in
order
1. An Hour to appear for consultants to sign up 2. An Hour to appear for consultants to sign up 3. An Error saying hour out of semester
4. An Edit to an hour for April 7th
Actual Output After logging in as test.nate, the user was able to sign up for both times.
After logging in as test.drew, the user first checked on April 7th and was not able to sign up on Wednesday, however was able to sign up for the rest of the semester at that time
43
Result Pass
Purpose of Test Sign Up for a shift Input Lab Name: Murphy 153
Sign up at: Noon on Wednesday Sign up at: Noon on Thursday
Sign up at: Noon on Wednesday again
Different user sign up at: Noon on Wednesday
Expected Output For each input the following output was expected in order
1. The user to appear in the lab schedule as well as the lab to appear on the user‟s personal schedule on Wednesday
2. The user to appear in the lab schedule as well as the lab to appear on the user‟s personal schedule on Thursday
3. An error stating the scheduling conflict
4. The user to appear in the lab schedule as well as the lab to appear on the user‟s personal schedule on Wednesday
Actual Output After logging in as test.nate, the user was able to sign up for both times.
Attempting to sign up again on Wednesday resulted in an error.
After logging in as test.drew, the user was successfully able to do this
Result Pass
Purpose of Test Request shift off and have another consultant take it Input Lab Name: Murphy 153
Test.nate Request off: Noon on Wednesday April 14th Test.drew Pick up shift: Noon on Wednesday April 14th Test.nate Request off: Noon on Thursday April 15th Test.drew Pick up shift: noon on Thursday April 15th
44
Expected Output Test.nate to request off, although it will still show as test.nate working, the background color for the shift will change.
Test.drew logs in and sees the open shift on April 14th to take, however a scheduling conflict will occur because of already working then, then on April 15th be able to succeed and it will show test.drew working April 15th at noon
Actual Output After test.nate requesting both times off the background color changed.
After test.drew tried both times, the first resulted in a scheduling error the second succeeded. The Thursday shift‟s background color on the schedule appeared in the appropriate color.
Result Pass
Purpose of Test Subscribe to daily summary Input Test.nate clicks to subscribe
A shift requested off later in the semester (April 14th) Expected Output At midnight test.nate received an email
Actual Output An email was received
Result Pass
Purpose of Test For an manager to edit a users hours
Input Test.nate removed from working Thursdays
Expected Output Test.nate to no longer show up on the schedule on Thursdays.
45
Actual Output The schedule no longer showed test.nate. Test.drew still working on April 14th
![Figure 2-1. A diagram of the Waterfall method [1]](https://thumb-us.123doks.com/thumbv2/123dok_us/1604327.2717086/18.918.301.639.168.431/figure-diagram-waterfall-method.webp)
![Figure 2-2. an iterative development model [2]](https://thumb-us.123doks.com/thumbv2/123dok_us/1604327.2717086/19.918.267.675.233.440/figure-an-iterative-development-model.webp)