Tubuloglomerular Feedback and Single Nephron
Function
after
Converting Enzyme
Inhibition
in
the
Rat
DAVID W. PLOTH, JAMES RUDULPH, RONALD LAGRANGE,and L. GABRIEL NAVAR, Veterans
Administration
Medical
Centerand
Departmentof
Medicine,
Nephrology Research and
Training Center,and
Departmentof Physiology
and
Biophysics,
Universityof
Alabama Medical
Center, University Station,Birmingham, Alabama
35294
A B S T R A C T
Experiments were
done
innormal
ratsto assess
kidney, single
nephron, and tubuloglomerular
feedback responses
during
renin-angiotensin blockade
with
the
converting
enzyme
inhibitor (CEI)
SQ
20881(E.
R.Squibb
&
Sons, Princeton,
N.Y.)
(3
mg/kg,
per
h).
Converting
enzyme
inhibition
wasdocumented
by complete blockade of vascular
responses
toin-fusions of
angiotensin
I(600
ng/kg). Control plasma
renin activity
was12.5+2.7 ng angiotensin
I/ml
per h
(mean±SEM)
and
increased sevenfold
with
CEI(n
=7). There
were
parallel
increases
inglomerular
filtration
rate
from
1.08±0.05 to 1.26±0.05
ml/min
and
renal blood flow
from
6.7±0.4 to 7.5±0.5
ml/min.
During CEI
infusion
absolute
and
fractional
sodium
excretion
wereincreased 10-fold. Proximal tubule
and
peritubular capillary
pressures
were
unchanged.
Single nephron glomerular filtration
rate
(SNGFR)
was
measured
from both proximal and distal tubule
collections;
SNGFRbased only
ondistal
collections
was
significantly increased by
CEI.
Asignificant
dif-ference
wasobserved between
SNGFR
values
meas-ured
from proximal and distal tubule
sites
(6.0±1.6
nl/min) and this difference remained unchanged after
CEI
administration.
Slight decreases
infractional
absorption
were
suggested
atmicropuncture sites
be-yond the late proximal
tubule, whereas early distal
tubule
flow rate was
augmented by
CEI.
Tubuloglo-merular
feedback
activity was assessed by measuring
changes
inproximal tubule
stop-flow pressure (SFP)
or SNGFR in
response to
alterations
inorthograde
microperfusion
rate
from
late
proximal
tubule sites.
During
control
periods,
SFP was
decreased 11.2±0.4
This work was presented in part at the Fall American Physiological Society Meetings in Miami, Florida, 1977,
and at the VII International Congress of Nephrology in
Montreal, Canada, 1978.
Dr. Navar is the recipient ofa National Heart and Lung InstituteResearch Career Development Award.
Receivedfor publication 7 August 1978 and in revised
form27June1979.
mm
Hg
when the perfusion rate was increased to 40
nl/min;
during infusion of CEI, the same increase
inperfusion
rateresulted
ina SFPdecrement of 6.7+0.5
mm
Hg
(P< .001). When late
proximal tubule perfusion
rate was
increased from 0 to 30
nl/min,
SNGFR
was
decreased
by 15.0±+1.2 nl/min during control
con-ditions, and by
11.3+1.3nl/min
during
CEIinfusion.
Attenuation
of feedback
responsiveness
during
CEIwas
also observed
at
lower
perfusion
rates
with both
techniques. These results indicate
that
blockade
of
the renin-angiotensin system with CEI reduces the
activity
of the
tubuloglomerular feedback
mechanism
which
may
mediate the
observed renal vasodilation.
INTRODUCTION
Although
some
of the
systemic
vascular and renal
effects of
angiotensin
IIappear
clearly
defined
(1-3),
the intrarenal role of
renin
and
the
subsequent
genera-tion
of
angiotensin
II inthe regulation of glomerular
filtration and tubular
absorptive function
remains a
controversial
issue.Several
recentstudies
have
ex-amined the role of the
renin-angiotensin system
inthe
control
of autoregulation of kidney hemodynamics
(4-7),
and
although
conflicting,
these reports have
failed
to
establish
a
pivotal role for the
renin-angio-tensin
system
inthe mediation of
autoregulatory
ad-justments
inrenal vascular resistance (4, 6, 7).
The
possible
influence
of the renin-angiotensin system on
the
base-line
control setting
of
renal
hemodynamics has
received somewhat greater support (3, 8, 9). Other
reports
have
suggested that angiotensin might also be
one
important determinant of
renal tubular
absorptive
function (10-13).
The precise role of the renin-angiotensin system
inthe mediation of the distal tubule-glomerulus feedback
system
(tubuloglomerular feedback system) signals
also remains
unclear.
It wasinitially suggested by
Thurau and co-workers (14) that the renin-angiotensin
system could be primarily responsible for the
media-1325
J. Clin. Invest. ©TheAmerican SocietyforClinical Investigation, Inc. 0021-9738/79/11/1325/11 $1.00 Volume 64 November1979 1325-1335
tion
of signals from the macula
densa
cells
of the distal
nephron to the vascular elements responsible
for
the
altered
vascular
resistance responses. Support for this
concept
has been
equivocal;
some studies have
failed
to
confirm
the
essential role of the
renin-angiotensin
system in
the mediation
of feedback signals, whereas
others
have
demonstrated
that this system
mustparticipate, at
least
indirectly.
Apreliminary
report
by
Stowe et
al. (15) suggested that the tubuloglomerular
feedback mechanism
was
atleast
partially
inhibited
by
a
blockade
of
angiotensin II
orconverting enzyme.
The
purpose
of
these experiments was to examine
further the possible
role
of
the renin-angiotensin
system
insingle nephron and kidney function
ina
normal
rat
preparation.
Although
not
without
limita-tions, one way to achieve this objective was to evaluate
the
effect of
acute inhibition
of
converting enzyme
using the
competitive converting enzyme
inhibitor
(CEI)l
derived
from
Bothrops
jaracara venom,
SQ 20881 (E. R. Squibb & Sons, Princeton, N. J.).
Using
this
approach, the
possible
influence
of
intra-renal
generation
of
angiotensin II on kidney and single
nephron function might be determined.
In
these
experiments attention was
focused
on
docu-menting
the whole
kidney clearance and
hemody-namic
responses
after administration of
CEI as
related
to
simultaneously observed
responses
insingle nephron
filtration
rate,
absorptive
function, and
tubuloglomeru-lar feedback
activity.
Inaddition
to
conventional
clear-ance
and
micropuncture
techniques, changes
intubuloglomerular
feedback activity
wereassessed
by
three
different
techniques:
estimatesof
single nephron
glomerular filtration
rate
(SNGFR)
based
on
tubule
fluid
collections from paired distal and proximal
tu-bule
segments
of the
same
nephron, and by directly
observing
feedback-induced
changes
inproximal
tubule
stop
flow
pressure
orSNGFR
inresponse
toalterations
inlate
proximal tubule microperfusion
rate.
Single
nephron absorptive function
was
assessed
with
paired tubular
fluid collections
before
and
after
CEI
administration.
METHODS
Experiments were
performed
onSprague-Dawley
ratsweigh-ing between 210 and 260g. Animals were maintained ona completeratchow diet(Wayne Lab Blox,Allied Mills,Inc.,
IAbbreviations used in this paper: ATF, artificial tubular
fluid; BP,bloodpressure; CEI,converting enzyme
inhibitor;
FENa, fractional sodium excretion; GFR,
glomerular
filtra-tionrate;
Pin, plasma
inulinconcentration;PNa,
plasma
sodium concentration;RBF, renal bloodflow;
SNGFR,single nephron
GFR;SNGFRdiSt,
SNGFR estimatedfrom distal tubule fluidcollections;
SNGFRpO,ro
SNGFRestimated fromproximal
tubulefluid collections;
TF,n,
tubular fluid inulin concentration; Uin, urine inulin concentration; UNa, urine sodium concen-tration;V,
urine flowrate.Chicago, Ill.) containing 0.15 meq Na+/g, and allowed free
access to food and water. Anesthesia was induced with
pentobarbital sodium (Nembutal, 50 mg/kg i.p.; Abbott Laboratories, NorthChicago,Ill.),andmaintained with small doses given intravensouly. Animals were prepared for
micropuncture on athermostatically controlled, heated table surface. A tracheostomy was performed, and three small
polyethylene catheterswereinserted into one external jugular vein for administration of anesthetic and infusion of
solu-tions. Anarterial cannula was inserted intothe femoralartery. Arterial blood pressure was continuously measured with a
transducer (model P-23 Dc, Statham Medical Instruments, Hato Ray, Puerto Rico) and recorded on a Grass recorder
(model 5, Grass Instrument Co., Quincy, Mass.). The left
kidney was isolatedthrough a transverse, subcostal incision
andplacedinasmallplasticcup;theureter wascatheterized;
and the renal artery was isolated from adjacent structures. In 15 rats, an electromagnetic flow probe (modelEP 401.5,
Carolina Medical Electronics Inc., King, N. C., 1.5 mm
cir-cumference) was placed on the renal artery to allow direct and continuous measurement of renal blood flow. The flow-meter was calibrated in vitro with timed collection of whole
blood, and verified in vivo using the para-aminohippuoric acid extraction technique as reported by Arendshorst et al. (4). Mechanical zero flow was checked by momentarily occludingtherenal artery in every experiment.
The kidney surface was superfused with warm (38°C) isotonic saline from the tipofa quartz rod light conductor. An inulin solution (7.5
gIdl
in 150 mM NaCl, Polyfructosan,Laevosan Gesellshaft, Linz,Austria) was administered as a primingdose of1 mlfollowed byaninfusionat 20
tdl/min
(1.2 ml/h). Control period measurements were initiated 20 min later. Each control period consisted of two 30-min urine col-lections with femoral arterial blood samples obtained in heparinized tubes atthe midpoint of each urine collection. Micropunctureprotocolswereconductedsimultaneouslywith clearancecollectionperiods. Afterthecontrolperiod,a prim-ing doseof3 mg/kg ofCEI in 0.5ml of155 mM/literNaCl was given intravenously in 3 min. The priming dose wasfollowedbyaninfusion of3
mg/kg
perhCEIin155mM/liter NaCl given at 10 ,ul/min (0.6 ml/h) and the inulin solutionwaschangedto 15g/dlgiven at 10
,ul/min
(0.6ml/h).Anaddi-tional 20 min wereallottedtoachieveasteady-state condition, and the protocol as described for the control period was repeated. In additiontothe blood samplesfor polyfructosan determination taken during the clearance
periods,
femoralarterial blood samples (200 ul) were obtained from seven rats in each protocol at the end of the control period and 20min afteradministrationofCEIfor the determination of plasma renin activity.
In six animals, tubular fluid samples for the determina-tionofSNGFRwere collected frompaireddistal andproximal superficial nephron sites before and after administration of
CEI.Downstream tubularsegments wereidentified visually
with injections of small volumes (_5-10 nl) of artificial tubular fluid (ATF) stained with 0.25% fast green (Fast Green FCF, J. T. Baker Chemical Co., Phillipsburg, N. J.) into early proximal segments. The ATF solution contained 141 meq/liter sodium, 5 meq/liter potassium, 124 meq/liter
chloride, 26meq/liter bicarbonate, and4 meq/litercalcium. The stained solution was injected through a 4- to 6-,tm Diam pipette placed in a random proximal tubule allow-ing identification of downstream, late proximal, and early distal superficial tubule segments of that nephron. After identification of downstream loops, a superficialsegment of the earlydistal tubule ofthe same nephron was punctured
with an oil-filledpipette of6-to
8-,um
Diamtip,an oilblock of 5-6 Diam tubule wasinjected,
and tubular fluid was(luantitatively
collected for 5-10 min.Immediately
after the distal tubule fluidcollection, alate proximal segment of the same nephron was punctured, and a timed, quantitativecollection of 3- 4-min duration was obtained downstream from the identification pipette. The proximally placed iden-tification pipetteremainedinplace upstreamn during both col-lections. Detection of any extravasation of green-tinted ATF at the site of the proximal identification pipettedisqualified
thattubule pair, althoughdetectable leaks were infre(quent.
After completionofcollections, pipette tips were filled with a small amount of mineral oil to prevent evaporative losses.
Hydrostatic pressures in the kidney were measured in 14 animals with a servo-nulling micropressure device (model
900, W-P Instruments Inc., New Haven, Conn.).
Micro-pressure pipettes were filled with 1 M NaCl, slightly tinted with fastgreen. Pipette tip sizes were 4- to6-,um Diam, and tip resistances were 0.8-1.2 MQi. The reference side of the
micropressuire circutit consisted ofa KCl-agar bridge, from
the peritoneal cavity, to 3 M KCl in which a reference Ag:AgCl electrode wasimmersed. Micropressureswere
con-tinuously recorded ontheGrassrecorder. Calibrationchecks
of themicropressture system were obtained before andafter each experiment.
Microperfusionstudiesmeasuringstop-flowpressure(SFP) responses were done in 14 animals. Several proximal loops of thesamenephronwereidentified withaproximally placed
pipette containingtheATFsolution with 0.25%fastgreen.A
waxblock(16) was injectedintothetubuleatthe site ofthe
identification pipette with a Wells microdrive unit (Trent Wells, Inc., South Gate,Calif.). Themicropressure pipette was
then insertedupstreamfromthe waxblocktorecordproximal
tubule SFP. A 4- to 6-,um Diam perfusion pipette con-taining the ATF solution, driven by a nanoliter
microper-fusion pump (W. Klotz, Physiology Institut, Munich, W. Germany)mountedon amicromanipulator,wasinserted into a superficial loop ofthe same proximal tubule
downstreamn
from the wax block. The perfusion pump was calibrated in vivo and in vitro (17) with isotopic techniques; the design
of the device allowed a built-in voltage generator to serve as the perfusion rate monitor. The perfusion pump pipette was inserted with the pump at zero flow, a maneuver that
did not alter the continuously recorded proximal SFP. SFP wascontinuously recordedwhileperfusion rate was
in-creased. Whenperfusionrate wasaltered, proximal SFP was
recorded for a period of3-5 min, and then the pump rate waschangedto a new setting.The3-to 5-min delay was always
adequate for 15- to 30-sec pump lag time, the feedback
response time, and the achievement of a plateau SFP
re-cording. The actual feedback responses could occur within 15-20s as was observed when the perfusion pipette was inserted into some tubules with the pump already set at a high perfusion rate. The feedback perfusion protocol con-sisted ofSFPrecordingsatperfusionrates of 0, 5, 10, 15, 20, 30, and 40nl/min altered in random sequence in eachtubule.
Zero perfusion rate SFP was reassessed after every second
perfusion
rate change and recovery tothe initial SFP valuewas always +2 mm Hg. Each of the perfusion experiments
consisted ofmeasurement ofSFPat least once at each
per-fusion rate in two or moredifferent tubules in each period. In eight animals, the feedback responses were assessed in an initial control period and then reassessed after con-verting enzyme inhibition. In six additional animals the opposite sequence was used by administering CEI in an initial experimental period. Feedback responses were assessed and then the CEI infusion was terminated. After
allowing40minfor the decayof the enzyme inhibition, the responses of SFP to alterations in late proximal perfusion
rate were reevaluated. This reversal of the sequence of the
experimental protocol obviated possible system-atic, time-dependent artifacts in theSFP-feedbackperfuision responses. A separate series of experiments in six animals examined the effects of a similarfeedback-perfusion protocol on changes in SNGFR before andduring CEI infusion. In these studies the nephron was identified and blocked with Nwax as de-scribed for the SFP-perfusioin studies. However, instead of continuously measuringproximlal tubule SFP, mutltiple timed collections of tubular fluid were obtained allowing de-termination of SNGFR at late proximal tubule microperfuision rates of 0, 10, and 30nl/min. The responses of two or more differenttubules were evaluated during each period.
Tubular fluid samplevolulmes (nanoliters) were measuired in a precalibrated, constant-bore (quartz glass capillary wvith
a slide comparator (Gaertner Scientific Co., Chicago, Ill.). A
microfluorometric method(18) wasusedtodeterminetuibular
fluid inulin concentration
(TFin).
Urine samples wvere col-lectedunder oil in small tared containers, anduirinevolumes were determined gravimetrically. Femoral arterial blood samples (150 ,l) were collected in small polyethylene con-tainers containing heparin (5 U U. S. Pharmacopeia). Inulin concentration in plasma(Pin)
and urine(Uin)
wvas measuredwith asemimicroanthronie technique (19). Urine and plasma sodium concentrations (UNa and PNa) were determined by flame photometry. SNGFR, measured in nanoliters per
min-ute, was computed by multiplying tubular fluid to plasma inulin ratios
[(TF/P)in]
by volume flow rates (nanoliters per minute). Kidneyglomerular filtration rate (GFR)(measuiredin milliliters per minute) was similarly computed from(U/P)in
concentrations and urine flow rate (microliters per minute). The product of sodium concentration in urine (UNa) and urine flow rate (V) gavesodium excretion rate, and fractional sodium excretion (FENa, percentage) was calculated from
(U/P)Na 100divided by
(U/P)in.
Blood samples (200 ,l) were obtained for plasma renin activity in iced tubescontaining EDTA
(disodiu-m
edenate, 1 mg EDTA/ml of blood). The tubes were immediatelycen-trifuged anid the plasmiia was decanted and frozen. Renin activity was determined in
dtuplicate
with 3-h incubationtimes by radioimmunoassay
(Squibb
Kit, E. R. Squibb & Sons.). The technique uised was a microadaptation of themethod of Haberet al. (20). Generation of angiotensin I was
documented to be linear with time duiring the 3-h
inctuba-tion. Plasmarenin is reportedas nanograms of angiotensin I timesmillilitersplasmatimeshouirsof incubation.
Valuesfor each period for each animal were averaged,
anid
overall mean values were derived from mean values for each experiment. Observations from each period in each series
of experiments were analyzed with a paired t test. Sig-nificance was accepted as a Pvalueof <0.05.
RESULTS
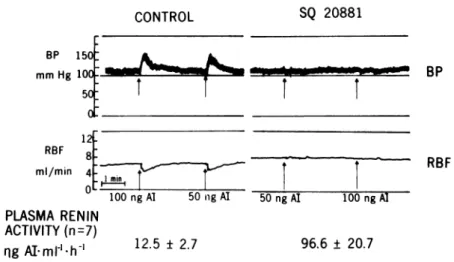
The
effectiveness of the converting enzyme
block-ade
given in adose of
3mg/kg
onthe
peripheral
andrenal vascular
receptors isshown
in Fig. 1.Before
CEI
infusion,
testdoses of
50and
100ngof
angiotensin Iin
volumes
of 100
,tl
of saline resulted
inmarked
transient rises
insystemic
blood pressure (BP) andsimultaneous
decreases
inrenal
blood flow (RBF).
After
CEIadministration, the vascular
effects of asmuch as 150 ng of angiotensin I in the same volume
did
notresult
inincreases inarterial
BPor
perceptible
decreases
in RBF.This pattern of
CEI blockade of theeffects of angiotensin
Iwas observed
inall animals
Tubuloglomerular Feedback and
Converting EnzymeInhibition
1327
12 RBF 8: ml/min
4[7
O .FPLASMA RENIN
ACTIVITY (n=7)
rig
Al1m['h
'
AIminl
100 ng Al 50 ingAI12.5
± 2.7t
I
50 ngAI 100 ng Al 96.6 ± 20.7FIGURE 1 Converting enzyme blockade. The chart recordings demonstrate systemic BP (mm
Hg,toppanel), andRBF(ml/min, bottom panel)responses totestinjections of50and100ngof
angiotensin I (Al) before (left) and after (right) administration of CEI. Plasma renin cetivity before (left, mean±SEM) and after (right) SQ 20881 are showni below thetracingpanels.
examined.
Infusion
ofangiotensin I indoses of
10, 50, and 100 ng/minfor
aslong
as 60 minduring the
ad-ministration
of
CEIfailed
toelicit
anyperceptible
change in RBF or arterial BP. In seven animals in whichduplicate samples
weremeastired
inboth
periods, plasma
reninactivity increased from 12.5+±2.7 to 96+21 ng angiotensin I/ml perhduring
CEI(P
<0.025).
Clearance data from 15 experiments in which CEI was administered after control
period
measurementsare shown in Fig. 2. GFR increased significantly from
1.08±0.05 to 1.26±0.05
ml/min.
Urineflow increased
from
acontrol value
of 4.8±0.9 to 7.4±1,ul/min.
Absolute
Na+excretionincreased 10-fold from
107±37to
1,235+318
neq/minduring
CEI. Because thein-crease in GFR was of much smaller
magnitude,
fractional
excretionof Na+ (FENa+) increased from
0.03±0.01 to 0.42±0.12%
(P
<0.005).
Potassiumex-cretion rate also increased
during
administrationofCEI from 997± 121to
1,451+
181 neq/min(P
<0.05).
The mean values reported for the CEI period are the
average
of
twoclearance periods,
and no consistent differences were observed from the firsttothe second clearanceperiod.
Hemodynamic data obtainedinthe same 15animals are shown in
Fig.
3. Arterial BP decreasedslightly
butsignificantly
from 127±2 to 122±3 mmHg (P
<0.05). RBF increased from 6.7±0.4to7.5±0.5ml/min (P<
0.05).
Similartothe clearancedata,
the increases in RBF after CEI were stablethroughout
both of theexperimental
clearanceperiods.
Hematocrit decreased from 49±1 to 46±1 vol %(P
<0.01).
Because of the decreases in arterial hematocrit as well as the sig-nificant increases in absolute RBF, renal plasma flowincreased from 3.6±0.2to4.1±0.3 ml/min
(P
<0.001).
Although
renal plasma flow wasinereased,
thesimul-taneous increase in GFRwas essentially proportional
resulting
inunchanged whole
kidney filtrationfraction
from
0.29+0.02 to 0.30±0.02. Proximal tubulefree-flow pressure was 14.0+0.4 mm Hg and was not
sig-nificantly altered by
CEI. Similarly, peritubtularcapillary
pressure was unchanged from 10.2±0.3 mm Hgbefore and
10.6±0.2 mm Hg after administration ofCEI.SNGFR data fromsixanimalsarepresentedinTable
I.
Paired collections from
proximal and distaltubvule
segments were
obtained from
14nephrons
inthe
con-trol period and from 17nephrons during
CEIinfusion.
1.0 FE* % 0.o
FENa
* * 150-qeq/min 1000 50C 1.4 1.2 mI/min 1.C-0.8Lm la _ ,ul/min 5 _aL
P< 0.05 CONTIROUL UNaV Cin * ----V
-rlna t;lI FIGURE 2 Clearance data. FENa,absolute sodiumexeretioni (UNaV), glomerular filtration rate(Cin),
and V are shown as meanvalues+-SEM,before and after CEIin 15animals. Theaveragekidney weight of12animalsinthisseries of
experi-ments was0.98±0.02g.*Significance ofP<0.05.
CONTROL
SQ 20881
BP 1501 i
i.--mmHg 100- - W
BP
RBF
%4-140 130-mmHg 120-110_ 0.33 0.31 _ 0.29 0.27 ml/min 8_ 6_ 5F vol% 4 40-*P< 0.05 GUNP IKUL BP CEI
FIGURE 3 Hemodynamicdata.BP,kidneyfiltration fraction
(FF), RBF, and arterial hematocrit (Hct)are shown as mean
values+±SEM beforeand after CEI in the same 15 animals as
Fig. 2.*Significance ofP<0.05.
During the
control
period,
there
was asignificant
dif-ference between
SNGFR asestimated from
proximal
tubule fluid collections
(SNGFRprox)
and SNGFR based
on
distal
tubule fluid
collections
(SNGFRdi,t).
Al-though
both average
SNGFRprox
and
SNGFRdiSt
in-creased
slightly
after CEI,
only
the
increase inSNGFRdiSt
achieved
statistical significance (P
<0.025).
Althotugh
the average
change
inSNGFRdist
(Table I)
was
small, the
consistency
of
the observed
increase inSNGFR, shown
inFig. 4,
allowed
the achievement of
statistical
significance.
Asshown
inTable I, the
dif-ference between
SNGFRvalues
measured
atproximal
and distal tubule
sites was6.0±+1.6
nl/min
during
the
control
period
and
wasunchanged
dturing
the CEI
in-fusion,
5.7+1.8
nl/min.
Mid-proximal
volume flow
ratesand proximal
(TF/P)i
ratios werealso
unaltered.
How-ever,
anincrease
inabsolute volume
delivery
tothe
early
distal
tubule
puncture
site
from
5.7+0.6 to7.9±+1.0
nl/min
was
observed. The
effects of
the
increases in volume flow rates at the early distal tubule
collection sites were partially offset by slight
de-creases in mean
(TF/P)i,,
thus explaining the
pro-portionally
smaller increment in SNGFR based on
collections
from distal tubules.
On the premise that SNGFRdiSt provides the more
representative estimate of SNGFR (17, 21), changes in
proximal absorption were
based on
SNGFRdi,t
and
proximal
(TF/P)in
data.
Absolute proximal absorption
was 8.6±+1.3
ml/min in the
control period and was not
changed during infusion of CEI; fractional absorption
was
also unchanged from 31+4% (Table II).
Although absolute volume delivery to the distal
puncture site was increased
after CEI infusion,
absolute volume absorption by the loop and proximal
tubule beyond the
puncture site was
unchanged after
CEI,
from
12.6±+1.2 to 12.8±+1.2
nl/min
(P
>0.10).
The
fraction of
the load
delivered
to
the late proximal
tubule and
loop
of
Henle that was
absorbed appeared
to
decrease from 69+3 to 61±3% but did not achieve
statistical
significance. The
tubular
fluid samples
ob-tained at the early distal micropuncture sites revealed
significantly
increased absolute volume
delivery, from
5.7±0.6 to
7.9±+1.0
nl/min
and an increased fraction
of the filtered volume from 0.19+0.02
to 0.27±0.03de-livered to those sites during
infuision
of CEI. The
frac-tion
of the
filtered volume
absorbed
upstream from
the
early, accessible distal
tubule
puncture site was
reduced from 0.81±0.02 to 0.73±0.03
althouigh
the
absolute
volume
absorbed was not
altered
by CEI.
These
absorptive alterations
appear to
be the
result
of
slight
increases
inthe rate
of
filtrate
formation
and
subtle alterations
in
proximal
tubule, loop of
Henle,
or
early
inaccessible distal
tubule
absorption rather
than
aspecific effect
on one
tubule segment.
In
14experiments,
the sensitivity
of the
tubuloglo-merular
feedback
mechanism was assessed by
eval-uating
the responses of SFP to changes in distal
nephron
perfusion
rate (Figs. 5
and 6,
Table III) from
TABLE I
Resultsof PairedMicropuncture Collectionsfrom ProximalandDistal
TutbuleSites in SixAni?nals
Control (14) CEI(17)
Proximal Distal Proximal Distal V,nlhmin 22.5+1.7 5.7±0.6 25.0±2.8 7.9±1.0*
(TF/P)j.
1.53+0.09 5.11±0.6 1.69+0.19 4.76+0.55SNGFR, ullmin 32.9±1.8 26.8±1.8 34.5±2.5 28.9±1.2*
ASNGFR, nllmint 6.0±1.6* 5.7±1.8*
Number of tubule pairsexamined ineach periodappear inparentheses.
*Significant pairedcomparisons(P <
0.05).
$ Paired difference in SNGFR measured at proximal nephron sites, distal
nephron sites.
44'
24
1 40 0 5 10 15 20
Perfusion Rate nl/min
CONTRIL CEI
FIGURE4 Paired SNGFR responses before and after CEI. SNGFR estimated from distal tubule fluid collections
(SNGFRdiSt,
nl/min)is shownfor eachofsixanimals.Controlobservations (0) were obtained before, and CEI observa-tions(0) wereobtainedduringconverting enzyme blockade.
late
proximal tubule microperfusion sites.
Fig.5
shows
the
results of eight experiments
inwhich the
con-trol observations
weremade before administration of
CEI, and Fig.
6shows
the results of
six experimentswhere
the
control observations
weremade after
dissipation of the CEI given
inthe initial period.
Be-TABLE II
Segmental Reabsorption Data: Puncture Site
Control CEI mean±SEM mean±SEM
SNGFRdi,t,
nllmin* 26.8±+1.8 28.9±1.2 Lateproximal Fractionalabsorption 0.31±0.04 0.29±0.06 Fractional delivery 0.69±0.04 0.71±0.06 Absoluteabsorption, nllmin 8.6±1.3 8.2±1.6 Absolutedelivery, nl/min 18.2±1.4 20.7±1.8Loop
Fractional absorption 0.69±0.03 0.61±0.03 Absoluteabsorption, nllmin 12.6±1.2 12.8±1.2
Earlydistal
Fractional absorption 0.81±0.02
0.73±0.03t
Fractional delivery 0.19+0.02 0.27+0.03t Absoluteabsorption, nllmin
21.1±+1.7
20.9±+1.0
Absolutedelivery, nllmin 5.7+0.6 7.9±1.0t
Data were computed from the sameobservations ofthe six animals referredto in TableI.
*
SNGFRdiSt,
SNGFRmeasuredatdistal micropuncturesites.t Paired changes from control period observations are
sig-nificant(P<0.05).
FIGURE5 Tubuloglomerular feedback responses. Proximal
tubule SFP isplotted as theaverage value for each animal,
aslate proximal perfusionratewasrandomly changedineight animals.Control observations(left)wereobtained before
ad-ministration of CEI (right).
cause
the
sequenceof
administration did
notaffect the
results, the data for all
14 experiments werepooled
and
areshown
inTable
III. Inthe control period,
changes
inlate proximal tubule perfusion
ratere-sulted
innonlinear decreases
in SFP; at maximumperfusion
rate,the decreases
in SFPaveraged
11.2±0.4 mm Hg.
Significant decreases
in SFP wereobserved with
incrementsinperfusion
ratefrom
0to5,
5
to10,
10 to15, and 15
to 20nl/min; further
in-creases in
perfusion
ratefrom
20 to 30, or 30 to 40nl/min did
notresult
inadditional decrements
inSFP.
The SFP
values
atzeroperfusion
rate were notdifferent from control during infusion of CEI but the
magnitude of
SFP responses todistal
perfusion
wassignificantly attenuated.
Duringadministration of CEI,
increases in
perfusion
rate tothe
maximum,40
nl/min,
Stop Flow Pressure mmHg 44r 36 SQ20881 42; 34 32[ 28 24 26 Control u 5 10 15 ZU 30 40 0 5 10 15Zu
PerfusionRate nI/min
FIGURE 6 Tubuloglomerular feedback responses. Proximal
tubule SFPis plotted as the average value for each animal
aslateproximalperfusionrate wasrandomly changedin six
animals.Control observations(right)wereobtainedafter
dis-sipation of CEI (left).
35+
3M+
StopFlow Pressure mmHg 42[ 38k-ControlSNCFIEist
25Il/mW
26 30 26 -I 11 30 40TABLE III
SFPFeedbackPerfusion Studies before and afterCEI
Paired
increment
Control (27) CEI(28) &*
nl/min P P 0 38.4±0.4 38.6±0.7t <0.001 <0.001 5 37.0±0.3 37.4±0.6 P> 0.10 <0.005 <0.001 10
33.3±1.0§
35.6±0.75 P>0.10 <0.001 <0.005 1528.5±0.4§
34.0±0.8§
P<0.001 <0.05 <0.05 2027.3±0.4§
32.8±0.7T P<0.001 >0.10 >0.10 3027.6±0.3§
32.5±0.75 P<0.001 >>0.05 >0.05 40 27.2±0.35 31.8±0.6 P<0.001 A%0-40 29±1 17±1 P<0.01Thetable showsSFP inmillimetersofmercury(mean±SEM)as late
proximal
perfusion
ratewas randomlychanged.ATFwasusedinallperfusions.
Number oftubules studiedin14ratsappear inparentheses.Ineight animals the controlmeasurements wereobtained before CEI,and in sixanimals the control measurements wereobtained after
allowing dissipation
ofCEI.*ThepairedincrementAsignificancesweretestedbycoInparingthe0to
xi
nl/minperfusion
rate-induced changes in SFPfrom controltothoseobserved with CEI.
t
P>0.10,paired
comparisonof SFPat zeroperfusion
ratefrom controltoCEIperiods.
§P<0.05,paired comparison ofSFP atgiven perfusionrate to SFP at zero perfusionrate.
decreased
SFPfrom
38.6+±0.7
to31.8+±0.6
mmHg. This
decrease
in SFPof
6.7+0.5
mmHg
wassignificantly
less
than the
11.2+0.4 mmHg
decrease
in SFPob-served
overthe
sameperfusion interval
inthe
con-trol
periods.
When comparisons are
expressed
asper-centage
change
in SFP asperfusion
rate
waschanged
from
0to
40nl/min,
SFP wasdecreased by
29±1% in
the control
period compared with
17±1%after
CEI
ad-ministration. The significant difference in magnitude
of
the
maximumfeedback-induced
responses in SFP
achieved before
and after
infusion of
CEI
indicates that
overall
tubuloglomerular feedback
responsiveness was
depressed.
However, the pattern
of
SFP
responses to
incremental changes in perfusion rate after
adminis-tration
of CEI
wasnot
greatly
different.
Significant
changes
inSFP
wereobserved
with
each
step
change
in
perfusion
rate except
the intervals
20-30
and
30-40
nl/min. Nevertheless, the actual changes
in SFP at
the
various
perfusion
rates were
significantly less during
CEI
infusion (Table III). The
SFP
responses
from
0
to
15nl/min
and
from
0nl/min
to all
higher perfusion
rates were
significantly
attenuated during CEI infusion.
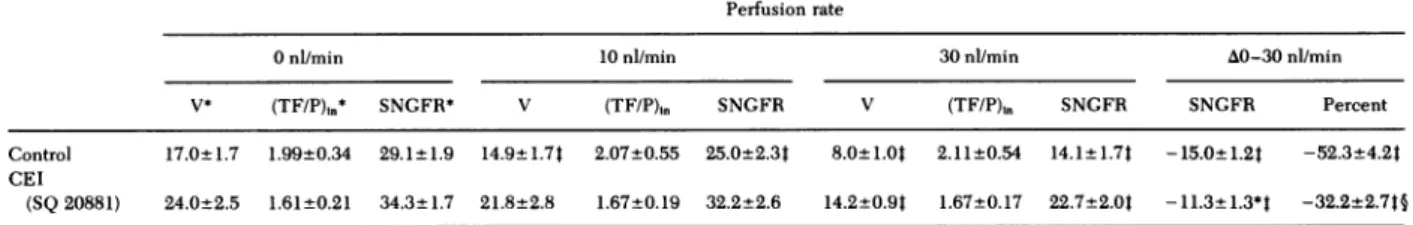
The
six
experiments assessing the changes in
SNGFR in
response to
alterations
in
late
proximal
tubule
microperfusion
rate
before
and during
in-fusion of
CEI are
summarized
inTable
IV.
During
control
conditions, proximal tubule volume
flow
and
SNGFR
both decreased slightly,
but
significantly,
when
perfusion
into
late
proximal
tubules was
in-creased
from
0to
10nl/min.
Incontrast,
the
TABLE IV
SNGFR-Feedback Perfusion Studies beforeand during Administration of CEI
Perfusion rate
0nl/min 10nl/min 30ni/min A0-30nl/min
V* (TF/P),n* SNGFR* V (TF/P),n SNGFR V (TF/P)in SNGFR SNGFR Percent
Control 17.0±1.7 1.99±0.34 29.1t1.9 14.9±1.74 2.07±0.55 25.0±2.34 8.0±1.0t 2.11±0.54 14.1±1.7t -15.0±1.2t -52.3±4.2t
CEI
(SQ 20881) 24.0±2.5 1.61±0.21 34.3±1.7 21.8±2.8 1.67±0.19 32.2±2.6 14.2±0.9t 1.67±0.17 22.7±2.0t -11.3+1.3*t -32.2±2.7t§
*The tablesummarizes changesinproximal tubule volume flow (V), tubular fluid/plasma inulinratios[(TF/P),,],and SNGFRduring control periods and during
infusion ofCEI (SQ 20881) in six animals.
IP<0.05,paired comparison ofVor SNGFR at given perfusion rate to0nl/min perfusionrateof thesameperiod.
§P<0.01, paired comparison ofchange in SNGFR or percentage changein SNGFR in response tochangeinperfusionratefrom0to30nl/min from controltoCEIperiods.
creases in
volume
delivery and
SNGFR
were not
significant over the same
perfusion interval during
CEI
infusion (Table
IV).
The
responses to increases
in
perfusion
rate
from 0 to 30 nl/min were
also of
greater
magnitude
during
control than
during
CEI
infusion;
SNGFR was
decreased by
15.0±1.2
and
11.3±1.3
nl/min,
respectively (P
<0.01). When the
changes
in SNGFR
areexpressed
aspercentage
change
from the
0
nl/min perfusion
rate
value, increases in
late proximal perfusion
rate
from
0 to 30 nl/min
re-sulted
in
decreases
in
SNGFR
of
52±4% during the
control period and
32±3% during
converting enzyme
blockade
(P
<0.001).
DISCUSSION
The
present
results provide further
data concerning
hemodynamic and tubular
responses
tothe
adminis-tration
of
CEI.
Specifically, these studies focus
onpos-sible alterations
intubuloglomerular
feedback
activity
occurring
asaconsequence
of the intrarenal inhibition
of
converting
enzyme.
Ininitial
observations,
wedocu-mented that
converting enzyme
inhibition
resulted
invirtually complete blockade of the vascular effects of
injected doses of
angiotensin
I.Presumably,
near
com-plete blockade of intrarenal formation of
angiotensin
IIalso
occurred, although this
aspect
of
converting
en-zyme
inhibition
is moredifficult
toestablish.
At
the whole
kidney level, administration of
CEIresulted
inmodest
but consistent increases
in RBFand
GFR.Because
approximately proportional changes
in
both
GFRand
RBF wereobserved,
filtration
frac-tion
was notaltered. The
hemodynamic changes
wereaccompanied by
adoubling
of
urineflow
and
anim-pressive
10-fold
increase insodium
excretion eventhough
arterial pressure decreased
slightly.
Becausethe micropuncture
measurementsof
proximal
tubular
and
peritubular capillary
pressure
failed
toindicate
significant changes,
itwould seem that the
hemody-namic
changes
were notof
sufficient magnitude
toaffect
the pressures
of
superficial nephron
structures.However,
measurements of SNGFR from both proximal
and distal tubule collection
sites
suggested small
increases in
SNGFR; specifically the increase in
SNGFRdiSt
was
statistically
significant although it was
proportionally less
than the increase in kidney GFR.
In
agreement
with
previous
studies
(17,21),
SNGFRP,OX
was
found
to
be consistently higher than
SNGFR&i,t
and this
difference
was
maintained during
CEI
ad-ministration. As
observed
in a
previous study
exam-ining the
effects
of plasma volume expansion (17),
the
maintenance
of the
SNGFR
difference based
on
paired collections from proximal and distal tubules
might
suggest an unaltered status of the
tubuloglo-merular feedback
mechanism, the putative system
re-sponsible for these differences.
However,
when the
maintenance
of the
SNGFRprOx-SNGFRdIst
difference
is
considered
in
the
context
of the
40% increase
of
distal tubule fluid delivery observed during
converting
enzyme
blockade,
itwould
seem
that
somealteration
in
the distal tubule feedback mechanism
must
have
occurred. Without
some
decrease
insensitivity
of the
feedback
system,
agreater
distal volume
delivery
should decrease
SNGFR as
measured from distal
tubule
sites
and
result
in
differences
inSNGFR
be-tween
the
twosites
of
greater
magnitude.
Infact,
asnoted
above,
SNGFRdist
was
actually increased.
The
distal
nephron microperfusion
experiments
demonstrated
that, under control conditions, small but
significant
changes
in SFPand
SNGFR
wereob-served
aslate
proximal perfusion
rate was
altered
inthe range
of
0 to 15nl/min.
These observations
ex-tend those
of
ourearlier
study (17) and, furthermore,
provide
an
explanation for
the
observed differences
inSNGFR
based
onproximal
and distal
tubule
fluid
col-lections.
Insome
previous reports (22),
asignificant
difference
in SFPand
SNGFRbetween
conditions of
zero
distal volume flow
rateand distal flow
rates inthe normal range
was notobserved
consistently.
Ithas
been
suggested, therefore,
that the
tubuloglo-merular feedback system
isresponsive
primarily
toin-creases in
flow rate
above the normal range. The
pres-ent
observations, however, do
support
the
concept
that
feedback
activity
isalso
responsive to
alterations
in
flow
rates
below
the normal
range as
suggested
by
the
data
of Muller-Suur et al. (23). It should also be noted
that
microperfusion
of the late proximal tubule with
artificial
solutions
at a given flow rate may not
provide
an
identical
stimulus to
the
feedback
receptor as
normal tubular
fluid.
Therefore,
it is
hazardous to
at-tempt precise
and
quantitative
extrapolations
from
the
SFP
and
SNGFR
feedback
responses to
the
SNGFR
data based
on
mid-proximal and
early distal tubule
fluid collections in
nonperfused
tubules.
For
the
present,
then,
only the qualitative
conclusion
can
be
made that
significant
decreases
in SFP
and SNGFR
do
occur
when
perfusion
rate is
increased to values
within
the
normal range.
The observations that the decrease
inproximal
tubule
SFP orSNGFR
atmaximal
perfusion
rate was
diminished
support the concept that
the
sensitivity
of
the
feedback mechanism
isattenuated
by
CEIad-ministration.
Increases
involume
delivery
rates in
the
range
of those
observed for normal conditions
(10-15
nl/min) resulted
inless
change
inSFP
and
SNGFRduring infusion of
CEI.Thus, the slight but significant
renal vasodilation
observed after administration of
CEIcan
be
explained
onthe basis
of
adecreased
sen-sitivity
of
the
feedback mechanism, allowing less
than
expected
vascular
resistancefor
the given
higher
distal
tubule volume
flow
rate.These results
complement earlier studies
reported
by Schnermann and co-workers (24) and
a recentreport
from
our
laboratory
(17),
demonstrating that
feedback-induced responses in
early proximal flow rate (24) or
proximal tubule
SFP
(17)
were
decreased
instates
of
acute or
chronic extracellular
fluid or
plasma
vol-ume
expansion.
The
attenuation
of feedback
activity
after plasma volume
expansion may
be the result of
reduced intrarenal
renin
activity or
circulating
angio-tensin
II.
Inthe present experiments
the
attenuation
oftubuloglomerular feedback
activity
would
seem tobe
singularly the result of the
CEI.
Because some
of
the
experiments were
conducted
inthe
reversesequence,
time-dependent decay of feedback
activity
wasobviated. The
mostlikely mechanism responsible for
this
depressed
statusof feedback
sensitivity
isintrarenal
inhibition of the formation of
angiotensin
II
or
perhaps reduced circulating levels of
angiotensin
II.
Inthis
context, the data support the conclusion
that converting enzyme
inthe
invivo
ratkidney
isinhibited with SQ 20881. This is at variance with a
recent
report that in in vitro preparations of renal
tissue
converting enzyme was not inhibited by SQ
20881
(25).
However, CEI is also known to potentiate
the
effects
of
bradykinin
and possibly other active
kinin species (26-28) and, therefore, the possibility
of
significant accumulation of such substances cannot
be excluded.
Although the role of possible kinin
ac-cumulation remains
disputed
(29, 30),
the
preliminary
report by Stowe et al. (15) wherein tubuloglomerular
feedback activity was equally attenuated in
protocols
using CEI as compared with those in which the
angiotensin
IIreceptor antagonist Saralasin
[Sar', Ile8]
angiotensin II, Norwich-Eaton
Pharmaceuticals,
Nor-wich, N. Y.) was
administered
(15),
would
support the
possibility
that
the primary
effect
resulted from
reduc-tion in
the renal action
of the
renin-angiotensin
system on
tubuloglomerular
feedback sensitivity.
Other, perhaps less likely,
alternative mechanisms
include alterations in
renal
nerve
tone,
circulating
catecholamines,
or some
nonspecific
vasodilator effect
of
CEI.
One
of the
principal
reasonsfor
conducting
these
experiments was to test the
hypothesized
role of the
renin-angiotensin system
inthe mediation of the
tubuloglomerular feedback
responses as
suggested
by
Thurau
(14).
The failure
to
demonstrate
complete
in-hibition
of the feedback
responses
with
CEI
would
seem to
indicate that mediation
of feedback signals
does
not
depend
singularly
on
the
integrity
of the
renin-angiotensin system. However, as
suggested
inthe
past, it is
possible
that the
demonstrably complete
vascular blockade is not an
adequate
index
of
the
integrity
of the local, intrarenal renin-angiotensin
system or
mediation
of
the
feedback
responses.
Never-theless, the demonstration of vascular blockade
seemsto be the
best
physiological
index
available.
Tothe
extent
that
complete local blockade
wasachieved,
the
present
results indicate that the
renin-angiotensin
cascade
isone
component
of the
system necessary
for
full expression
of tubuloglomerular feedback
activity.
It is
also possible that
angiotensin
could
modify
base-line vascular
resistance response
relationships
or
could
affect tubular absorptive function
atthe macula densa,
in
either case explaining
the attenuated
tubuloglo-merular feedback
responses to increases
indistal
delivery.
As
mentioned,
one
finding of considerable
interest
was
the
marked natriuresis
during CEI
infusion.
Re-cent
studies have
shown that low doses of
angiotensin
II may
be
antinatriuretic (13, 31), and it is
therefore
at-tractive to associate
the reduced
angiotensin II
gen-eration and
the
natriuresisobserved
inthese
experi-ments. It should be clearly noted, however, that only
a
small
fraction of the
increment in afiltered
load of
sodium
appeared
inthe urine
during
CEI
infusion,
documenting increased absolute tubular
absorp-tion
during conditions of
impaired
angiotensin II
generation.
Of
interest isthe
speculative
possibility
that the
absorptive alterations and the attenuated
tubuloglo-merular feedback
activitymight be
moredirectly
linked. Fractional absorptive function
wasdepressed
intubule
segmentsbefore
and possibly involving the
early distal tubule
puncture site.It
would
seemplausible that the depressed absorptive
capacitymight
also alter the
sensormechanism involved
in initia-tionof the feedback signal such
ashas been
dem-onstrated for
the
potentloop diuretics (32, 33).
ACKNOWLEDGMENTS
The authors thank Dr. Thomas E. Andreoli for reviewing
themanuscript and Ms.Becky Smith and Mrs. PamBurkart for their stenographic assistance. The authors acknowledge
Dr. Z. Horowitz and E. R. Squibb & Sons, Princeton, N. J.,
for thegenerous gift of SQ 20881.
Financial support for these studies was in part derived from NationalInstitutesof Health grant HLB 18426 and from aVeteran's Administration researchgrant.Intramuralsupport was provided by the University of Alabama Nephrology Research and Training Center and the Alabama Urological Research and RehabilitationCenter.
REFERENCES
1. Peters, G., and J. P. Bonjour. 1971. Renal effects of renin
and angiotensin. In The Kidney, Morphology,
Bio-chemistry, Physiology. C. Rouiller and A. F. Muller, editors. AcademicPress Inc., NewYork.4:81-154. 2. Navar, L. G., and H. G. Langford. 1973. Effects of
angiotensin on the renal circulation. In Handbook of Experimental Pharmacology. 0. Eichler, A. Farah, H.
Herken, andA. D.Welch,I. H.Page, and F. M. Bumpus,
editors.
Springer-Verlag,
Berlin.37:455-474.3. Thurston, H., and J. H. Laragh. 1975. Prior receptor occupancy as a determinant of the pressor activity of infusedangiotensin II intherat. Circ.Res. 36: 113-117. 4. Arendshorst, W. J., W. F. Finn, and C. W. Gottschalk.
1975.Autoregulation of bloodflow intheratkidney.Am. J.Physiol. 228(1): 127-133.
5. Kaloyanides,G.J., R. D. Bastron, and G. F. DiBona. 1974.
Impaired autoregulation ofblood flow and glomerular filtrationrate inthe isolated dog kidney depleted ofrenin. Circ. Res. 35: 400-412.
6. Belleau, L.J.,andL. E. Earley. 1967.Autoregulation of renal bloodflow in the presenceofangiotensininfusion.
Am.J.Physiol. 213: 1590-1595.
7. Potkay, S., andJ. Gilmore. 1973. Autoregulation of glo-merular filtrationratein renin
depleted dogs.
Proc. Soc. Exp.Biol. Med. 143: 508-513.8. Hollenberg,N.K., W. R.Chenitz,D. F.Adams,and G.H.
Williams. 1974. Reciprocal influence of salt intake on
adrenal glomerulosa and renal vascular responses to
angiotensinII innormal man.J.Clin.Invest.54:34-42.
9. Brunner,H. R., P. Chang,R. Wallach,J. E. Sealey, and J. H. Laragh. 1972. Angiotensin II vascular receptors: their avidity in relationship to sodium
balance,
the autonomic nervous system, and hypertension. J. Clin. Invest. 51: 58-67.10. Barraclough, M. A.,N. F.Jones, andC. D.Marsden. 1967. Effect of angiotensin onrenal functionintherat. Am.J.
Physiol. 212(5): 1153-1157.
11. Lowitz,H.D.,K.0. Stumpe, andB.Ochwadt.1969.
Micro-puncture study of the actionofangiotensin II ontubular
sodium and water reabsorption in the rat. Nephron. 6: 173-187.
12. Johnson, M. D., and R. L. Malvin. 1977. Stimulation
ofrenal sodium reabsorption byangiotensin II. Am. J.
Physiol. Renal Fluid Electrolyte Physiol. 1(4): F298-F306.
13. Harris, P. J., and J. A. Young. 1977. Dose-dependent stimulation and inhibition of proximal tubular sodium
re-absorption byangiotensin II in the rat kidney. Pflugers
Arch.Eur. J.Physiol. 367:295-297.
14. Thurau, K. 1974. Intrarenal action of angiotensin. In Angiotensin(Handbook of Experimental Pharmacology).
I. H.Page and F. M. Bumpus,editors. Springer-Verlag,
Berlin. 37: 475-489.
15. Stowe, N. T., J.Schnermann, andM.Hermle. 1979. Feed-back regulation of filtration rate during pharmacologic interference with the renin-angiotensin and adrenergic
systems in rats.KidneyInt. 15: 473-486.
16. Gutsche,H. U., R.Muller-Suur,U.Hegel,K.Hierholzer, and S. Luderitz. 1975. A new method for intratubular blockade in micropuncture experiments.
Pflugers
Arch.Eur.J.Physiol. 354: 197-202.
17. Ploth, D. W., J. Rudulph, C. E. Thomas, and L. G. Navar. 1978. Renal and tubuloglomerular feedback re-sponses toplasma expansion inthe rat. Am.
J.
Physiol. Renal Fluid Electrolyte Physiol.4(2): F156-F162. 18. Vurek, G., and S. Pegram. 1966. Fluorometric methodfor the determination ofnanogram quantities ofinulin.
Anal. Biochem. 16: 409-419.
19. Fuhr, J., J. Kaczmarczyk, and C. D. Kruttgen. 1970. Eine
einfachecolorimetrische MethodezurInulinbestimmung
furNieren-Clearance-Untersuchungenbei
Stoffwechsel-gesunder und Diabetikern. Klin. Wochenschr. 33: 729-730.
20. Haber, E., T. Koemer, L. B. Page, B. Kliman, and A.
Pernode. 1969. Application of a radioimmunoassay for
angiotensin I to the physiologic measurements of plasmareninactivity innormal human subjects.J. Clin. Endocrinol. Metab. 29: 1349-1359.
21. Ploth, D. W., J. Schnermann, H. Dahleim, M. Hermle,
and E. Schmidmeier. 1977. Autoregulation and tubulo-glomerular feedback in normotensive and hypertensive
rats.KidneyInt. 12:253-267.
22. Schnermann,J., E.Persson, and B. Agerup. 1973.
Tubulo-glomerular feedback: nonlinear relation between
glo-merular hydrostatic pressure and loop of Henle
per-fusion
rate.J.
Clin.Invest. 52:862-869.23. Muller-Suur,R., H-U. Gutsche, K. F. Samwer, W. Oelkers, and K. Hierholzer. 1975.Tubuloglomerular feedback in rat kidneys of different renin contents.
Pfliugers
Arch.Eur.J.Physiol. 359: 33-56.
24. Schnermann, J., M. Hermle, E. Schmidmeier, and H.
Dahleim. 1975. Impaired potency for feedback
regula-tion of glomerular filtration rate in DOCA escaped rats.
Pflugers
Arch. Eur. J. Phsyiol. 358:325-338.25. Baranowski,R.L., C.Westenfelder,andN. A.Kurtzman. 1979.Renal angiotensinIconverting enzyme differs from thatoflungandis notinhibitedby captoril (SQ 14225). Clin.Res. 27:494A.(Abstr.)
26. Engle, S. L., T. R. Schaeffer, B. I. Gold, and B. Rubin. 1972. Inhibition of pressor effects of angiotensin I and augmentation ofdepressor effects ofbradykinin by syn-theticpeptides.Proc.Soc.Exp. Biol. Med. 140:240-244.
27. Erdos, E. G. 1976. Conversion of angiotensinIto angio-tensin II.Am.J. Med. 60:749-759.
28. Erdos, E.G. 1976. Thekinins,a status report.Biochem. Pharmacol. 25: 1563-1569.
29. Jaeger, P., R. K. Ferguson, H. R. Brunner, E. J.Kirchertz, and H. Gavras. 1978. Mechanism of blood pressure
re-duction by teprotide (SQ 20881) in rats.Kidney Int. 13: 289-296.
30. Thurston, H.,andJ. D. Swales. 1978. Converting enzyme inhibitor andsaralasin infusionin rats.(Evidence foran
additional vasodepressorpropertyofconverting enzyme inhibitor.) Circ. Res. 42(5): 588-592.
31. Malvin, R. L., and A. J. Vander. 1967. Effects of
angio-tensin infusion on renal function in the unanesthetized rat. Am.
J.
Physiol. 213(5): 1205-1208.32. Bell, P. D., C. Thomas, R. H. Williams, and L. G. Navar. 1978. Filtration rate and stop flow pressure feed-back responses to nephron perfusionin the dog.Am.J. Physiol. Renal Fluid Electrolyte Physiol. 3(2):
F154-F165.
33. Wright,F.S., and J.Schnermann. 1974.Interferencewith
feedback control of glomerular filtration rate by furo-semide, triflocin, andcyanide. J. Clin. Invest. 53:
1695-1708.