Frantisˇek Brabec and Hanan Samet
University of Maryland
on the World Wide Web
Being able to visualize both spatial and nonspatial data is becoming increasingly important to today’s Internet users. Spatial data viewers and query tools can aid in visualization, but they should also let users access data instantly and with minimal effort. The authors explore new ways to allow visualization of data stored in a central server database on a simple client. They also consider usage scenarios in which transferring the whole database to the client for processing isn’t feasible due to the amount of data on the server, insufficient computing power on the client, and a slow link between the two.
S
cientists and researchers collect vast amounts of spatial data daily. Many collection methods, such as via satel-lite systems, produce data in raster for-mat. Researchers can often analyze such data directly, whereas at other times, they use it to produce the final data set in vec-tor format. Spatial data viewers and query tools are increasingly popular with end users, which necessitates methods that let these users access data for viewing and querying instantly and with minimal effort. At the University of Maryland, we’ve focused on providing remote access to vector-based spatial data, rather than raster-based spatial data.Traditionally, common spatial data-bases and Geographic Information Sys-tems (GISs), such as ESRI’s ArcInfo (www. esri.com/software/arcgis/arcinfo/index. html), have been designed as stand-alone products — the spatial database resides on the same computer or LAN from which
users visualize and query it. This hard-ware setup lets users instantaneously transfer large amounts of data between the spatial database and the visualization module. It’s perfectly feasible, therefore, for these two components to communi-cate via large-bandwidth protocols. Many applications exist, however, for which more distributed approaches are desirable. In these cases, the database is maintained in one location; users must work with it from possibly distant locations over a network (such as the Internet). These con-nections can be far slower and less reli-able than LANs. Thus, we must limit the data flow between the database (server) and the visualization unit (client) to get timely responses from the system. The challenge in running a GIS over the Inter-net comes from limited Inter-network band-width and higher delay. In some scenarios, the client component is fairly thin (run on a handheld platform, for
example) or runs in an environment with other-wise limited resources (such as a Java applet).
Numerous Web-based mapping service ven-dors, such as MapQuest (www.mapquest.com) and MapsOnUs (www.mapsonus.com), enable remote users, typically equipped with only standard Web browsers, to access their spatial database servers and retrieve information (in the form of maps). These services perform all calculations on the serv-er side and then transfserv-er the bitmaps that represent users’ query and command results. This solution requires minimal hardware and software resources from the client, but the resulting product has severe limitations in terms of available function-ality and response time (each user action results in the client receiving a new bitmap).
Our research explores new ways of allowing both spatial and nonspatial data visualization on a simple client when the data resides in a central serv-er database linked to the client by a possibly slow or unreliable connection. Our solution partitions the workload between the client and server in a way that creates an interactive experience for users, with minimal delay between their actions and the appro-priate responses. The design of our client, the SAND Internet Browser, works around potential bottle-necks to the information transfer such as limited network bandwidth or resources available on the client computer. To support multiple concurrent clients, we also consider servers’ resource limita-tions. Our solution is especially appropriate for usage scenarios in which transferring the whole database for processing on the client isn’t feasible.
Spatial Server Access
Some spatial database solutions, especially those intended for browsing and querying relatively small data sets, exist as stand-alone products with the database engine and the visualization unit bundled together. This allows users and their com-puters to be completely independent when running the application. The obvious drawbacks include limitations on the volume of data that can be pre-sented this way as well as complications resulting from having to update the locally stored data set. ArcView (www.esri.com/software/arcgis/arc view) — now part of the ArcGIS desktop suite — was one of the first, and remains the most popu-lar, representatives of the integrated solutions cat-egory. It provides extensive mapping, data use, and analysis along with simple editing and geoprocess-ing capabilities. Its design allows extensions,
implemented by both ESRI and third-party devel-opers. MapInfo Professional (www.cmcus.com/ Products/Vendors/MapInfo/mapinfopro.asp) is a business-mapping solution similar to ArcView that lets users perform data analysis and visualization. It supports extensive data import and export and lets users develop their own custom extensions.
The SAND Browser1provides a GUI to the Spa-tial and NonspaSpa-tial Database facilities developed at the University of Maryland.2–4It facilitates data visualization by letting users specify several search criteria:
• the scan order in which tuples are incremental-ly retrieved from SAND,
• a spatial selection (overlap and within con-straints), and
• an arbitrary selection predicate.
The browser supports selection and spatial join and semijoin queries whose results are returned
incre-mentally. This lets users get visual feedback quick-ly. Additionally, users often wish to receive results in some specific order — returning objects ordered by distance from another object or a set of objects is a typical query.
As described previously, many vendors employ a traditional approach to Web-based mapping based on sending a sequence of bitmaps to the client for viewing. Typical examples of such service providers include MapQuest and Switch-board/MapsOnUs, for street maps based on addresses, or TopoZone (www.topozone.com) for topographical maps. Their approach is simple: the server receives a location description (a street address, place name, and so on), queries its spatial database, retrieves a map, converts it into a bitmap image, and sends it back to the user (via his or her browser). The map retrieved from the spatial data-base might be in vector (MapQuest or MapsOnUs) or raster (TopoZone) format. In either case, it gets
The browser supports selection
and spatial join and semijoin
queries whose results are
returned incrementally.
rasterized or subsampled, respectively, before the server sends the data over the network to the user’s browser. Other raster-based mapping systems include TerraServer5 and NASA’s World Wind (http://worldwind.arc.nasa.gov), which, besides working with NASA’s own data, also uses data from TerraServer.
The Web-based mapping approach requires very little support from the client side — typically, just a Web-browser-equipped computer or network appliance. This solution’s drawback, however, is that it quickly reaches its usability limitations when users attempt more serious work. Such poor-ly supported operations include basic zooming in or out or panning, not to mention running queries. In particular, zooming or panning actions are very cumbersome, with performance bordering on unacceptable for many users because the response time depends on how much data the server must transfer every time the user requests a new view. Other operations, such as querying the database beyond displaying all objects within a certain rec-tangle, aren’t supported at all.
Google and Microsoft both recently presented enhanced raster-based designs (see http://maps. google.com and http://virtualearth.msn.com). Sim-ilar to MapQuest, Google’s map service is raster-based, but it doesn’t send a single image covering the whole viewable area every time an update is needed. Instead, it divides the viewable map into a grid of 128 128 small-image cells. When the user executes a panning operation, the service doesn’t need to download a new image represent-ing the whole viewable area — instead, it needs to download only those cells covering the area that just became visible; it reuses the rest by simply moving them on the screen. Oracle provides a sim-ilar rendering service called MapViewer (www. oracle.com/technology/products/mapviewer/index. html) for its Oracle Spatial product. MapViewer is a Java component that accepts spatial queries and generates resulting bitmaps that the client platform can view. Thus, from a user perspective, this approach resembles that of MapQuest and similar Web-based services.
Other systems rely on a custom client module that communicates with the spatial server via a proprietary protocol. Few such systems exist, how-ever, and most that do are in the research project stage rather than being proven commercial prod-ucts. Chee Yap, Kenneth Been, and Zilin Du,6for example, propose a responsive visualization
sys-tem that links a central database containing TIGER data from the US Census Bureau with a Java-based client (over a Java Database Connectivity [JDBC] interface). Their research focuses on fast viewing of static data (that is, window queries) rather than a more powerful tool supporting a larger class of spa-tial queries and operations. In other research, Michela Bertolotto and Max Egenhofer use similar techniques by employing geographic data general-ization to generate simplified representations of the vector data in order to facilitate fast viewing.
The Open Geospatial Consortium (OGC; www. opengeospatial.org) has been instrumental in developing and standardizing protocols for trans-porting and storing spatial data,8limiting the need for the proprietary protocols we just discussed. Although our application currently uses a propri-etary protocol for communication between the client and the server, our research hasn’t focused on the protocol itself, and we could easily replace it with another, including the OGC standard.
Client-Server Paradigm
The client-server computer network application par-adigm is one in which the client typically manages the user interface and connects to an application or database server to submit requests and receive responses. The type of application determines the nature of such responses. Servers are powerful com-puters or processes dedicated to managing resources or performing tasks. Clients are usually lower-end computers, workstations, or handheld devices. The amount of business logic handled on the client side can differ from design to design. In one approach, the client can communicate directly with the server application (a database, for example) and then process and visualize results on its own. A more common method introduces a middleman applica-tion on the server side that connects to the database and implements any necessary business logic. The client then simply visualizes already prepared text, images, or other output. We can generalize this approach to the application server by connecting an arbitrary number of databases and other applica-tions and then aggregating the results and preparing them for the client to visualize. We cooperated9with the OpenMap project (www.openmap.bbn.com) to developing this type of system.
The SAND Internet Browser:
User Experience
application that represents the client component of our client-server solution for facilitating remote access to spatial databases. Figure 1 shows the Inter-net Browser’s user interface, which is rooted in experiences gathered from using the original Tcl/Tk-based SAND Browser that we described in the previ-ous section. Although years of usage validated many concepts proposed in the traditional SAND Browser, some drawbacks emerged as well, such as limited support operations on multilayered maps.
We’ve investigated the SAND Browser’s prop-erties, and, using this experience, we designed a new user interface for it. We focused on creating a new interface for the SAND Internet Browser that provides visualization and query access to an arbitrarily large data set in typical
deploy-ment scenarios. Like the original, the SAND Internet Browser lets users visualize data con-tained in a SAND relation by specifying two types of controls: the scan order in which tuples are retrieved from SAND and an arbitrary selec-tion predicate.
A SAND Internet Browser window is divided into several panels stacked vertically:
• The command areacontains menus and buttons for several actions. “First” and “Next” retrieve the first/next tuple, satisfying the currently set scan order and predicate. “File” provides vari-ous basic operations, such as “Open” or “Close” (the current relation) or “Quit” (the browser). “Display” presents a menu of several activities Figure 1.The SAND Internet Browser’s user interface. In this sample user interaction, the current tuple’s contents are shown on the bottom. A dialog box popup window shows the spatial query specification for finding the neighbors of a given polygon qin increasing order of their distance from qwith an upper limit on that distance.
connected to the graphical display, such as clearing it or drawing spatial features. “Style” allows users to change the drawing attributes, such as the line or fill colors.
• The scan order panel has a button that triggers several popup dialog boxes and a message area that displays the currently selected scan order parameters. Each dialog box corresponds to the parameters that the Browser will use when scanning the relation with help from the cor-responding attribute’s index.
• The conditionspanel allows the user to specify a predicate that the Browser will use to evalu-ate the query. Unlike the original SAND Brows-er, the SAND Internet Browser uses an intuitive interface for building arbitrary conditions based on the current relation’s fields. In this way, the user is unaware of having to follow any specific syntax.
• The info panelindicates the current line and fill colors that will be used the next time a user chooses any displaying operation from the “Dis-play” menu. It also contains an active layer selec-tor where all queries are executed with respect to elements in the active layer. For instance, if the active layer is “rivers," any query such as “find all elements within a specified distance from a point" will return all matching rivers.
• The graphical displaypanel is the drawing area where spatial features are drawn (on inputs and outputs). At any given moment during the interaction, the current value of the relation’s spatial attribute is displayed in this area and highlighted with an orange rectangle. Most of the other user-interface components that hold a spatial-feature value draw on the graphical dis-play to support input. Users can also pan across and zoom in and out of the display. The zoom operations are available through a left and middle mouse click, respectively, whereas the right click finds the nearest object to the click’s location from the current relation and makes it the current tuple (that is, a “pick” operation in computer graphics parlance).
• The info lineshows various messages during the browser’s execution.
• The tuple display panel contains a series of labeled entry boxes, one for each attribute in the relation’s schema. The browser updates these to reflect the current tuple’s value. • The layer displaylists all the layers
corre-sponding to relations available for this
browser session. Clicking on the individual entries in this list toggles a display of the respective layers in the graphical display area on and off.
• The query historylists all queries the user has performed so far and their results. Users can assign them names and easily flip through them to visually compare multiple query results. Users can also utilize the history to return to an older query or prepopulate it in the query dialog box and then initiate a new one. Thus, it’s easy to form new queries that share some parameters with previous ones.
The following example demonstrates how to utilize the user interface to obtain a response to a specific query. Given a road map of Silver Spring, Maryland (single-layer data set), we want to find all the roads within distance d from polygon p
(hand-drawn to represent an area of interest, such as a flooded area and its immediate proximity) and return them in the order of distance from line l
(hand-drawn to represent, for instance, an emer-gency vehicle route):
1. Go to Filemenu and Open RelationSilver Spring.
2. Press Scan order, choose lineto open a dia-log box.
3. Enable Ranking by distance from, choose
line, and select the line lby drawing on the canvas.
4. Enable Restrict search to lines within, choose distance, and specify a line by draw-ing on the screen. The line’s length will define the distance used in this condition. Choose
polygon from the object list next to it and define polygon pby drawing it on the canvas. 5. Click OKto submit the query.
6. Click Firstand Nextto retrieve the first and all the other lines within distance d from p
ordered by the distance from l.
7. Alternatively, display the entire group at once by selecting Display group(uses the current
line color) or Display blended group
(changes the color for each returned line to indicate the order in which the Browser retrieved the lines).
The result will indicate the streets affected by the flood that are closest to areas the emergency vehi-cles can access.
Distributing Data and Processing
between Client and Server
The most common design for the client-server architecture makes individual tasks such as data management, image rendering, or query evalua-tion either the client or server’s responsibility. In the context of Web-based mapping, the server handles all the data management and query eval-uation, and the client only facilitates data visual-ization while maintaining connectivity. In this case, the client simply translates user input into queries and transmits them to the server. It can also receive data the server sends and visualize them. The client doesn’t have data storage or pro-cessing capabilities beyond these basic functions. This is how many of the popular Web-based map-ping services such as MapQuest or Switchboard’s MapsOnUs operate.
The advantage of this server-oriented approach is that most users can utilize it with the resources they already have — a networked machine with a Web browser (they don’t need to install or set up any additional hardware or software). However, this approach’s main disadvantage is that the client must communicate with the server every time the user requests even the simplest operation. This can slow down the user experience significantly if net-work throughput and latency are limiting factors or if the server is heavily loaded.
To improve on the server-oriented approach, the client can utilize some of its own main memory to store (cache) some data in the central database (see Figure 2). In some cases, this lets the client rely on its own data repository to handle some of the user’s requests, thereby cutting back on the network uti-lization and improving the system’s responsiveness. Which requests can be handled locally depends on the specific client implementation. A lightweight client such as the SAND Internet Browser will rely on the server for query processing more and imple-ment only operations such as “window query” local-ly. A heavier client might support local processing of more types of queries. In such cases, it would download data to be processed locally rather than upload queries and only download their results.
Naturally, the data stored on the client must be spatially indexed for fast processing. With this approach, users can no longer use the standard Web browser as a mere image viewer; they must load a custom code onto the client to facilitate the operations that the client will perform. The Java environment has emerged in past years as the
plat-form of choice for most types of lightweight, cross-platform applications.
This client-oriented approach’s basic concept calls for the client to fetch the requested data via fast memory-only operations whenever possible. This is usually more efficient than retrieving the same data over the network from a central server, but we must give special consideration to cases in which the environment is unusual in some way. For instance, small devices with low processing power might still be providing a more efficient service by acting as terminals and without attempting to perform any data-management operations themselves.
The SAND Internet Browser implements this approach. The SAND system performs operations that are primarily client-driven — that is, any oper-ation performed on either the client or the server is in response to user-generated input. To minimize the amount of data that the server must transfer to the client in response to each operation on the client side, we cache some data on the client in case the user requests another operation on data in the same area. We store the data in their original vector format rather than the resulting bitmaps so that the client can generate new views and process some types of queries locally without having to request additional data from the server.
SAND Internet Browser Design
The SAND Internet Browser stores the spatial data on the client using a PMR quadtree10spatial data structure. One PMR quadtree exists for each map layer. Given a particular data layer (such as a road
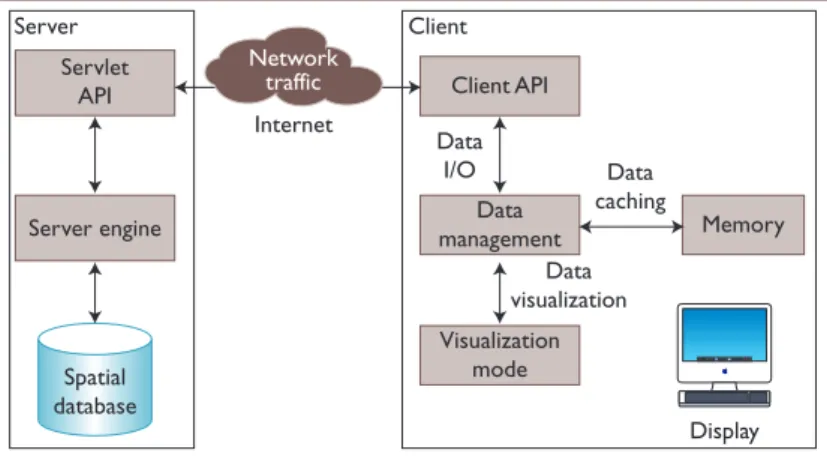
Figure 2. Thin-client scenario. The thin client communicates directly with the main spatial server and utilizes its (limited) memory capacity to cache some spatial data locally. This saves many data transfers because the client doesn’t need to ask the server for data after each screen update.
Data management Memory Visualization mode Client API Data I/O Data visualization Data caching Internet Display Servlet API Server engine Spatial database traffic
network), this structure divides the plane into quad-rants so that when an object is inserted into a cer-tain quadrant, if the quadrant already concer-tains more than a predefined threshold of other objects, then the quadrant is split into its four children once and only once, and the objects in the quadrant are reinserted into the children. Thus, objects are always stored in the PMR quadtree’s leaf nodes. To avoid overwhelming or crashing the client plat-form, we establish and maintain the maximum amount of data the client can cache. Given that the objects are specified as vectors, this bound is the number of vertices that make up the objects.
Besides recording the actual spatial objects, each PMR quadtree leaf node also contains a time stamp indicating when it was last accessed (dis-played). Together with the PMR quadtree contain-ing the spatial data, we also maintain pointers to all the PMR quadtree leaf nodes in a variant of a balanced binary search tree. The key for this tree is the time stamp stored in the PMR quadtree leaf nodes. This structure facilitates quick insertions and deletions and lets users locate the pointer rep-resenting the PMR quadtree node with the oldest time stamp. Thus, whenever we need to make more memory available for additional data, we use a least-recently-used caching policy to delete as many PMR quadtree leaf nodes linked from the top of the balanced binary search tree as necessary. The advantage of placing the PMR quadtree nodes in one balanced binary search tree is that we can delete nodes from different layers as needed rather than having to decide on a particular layer which nodes are to be replaced.
As users explore the database’s contents using a graphical viewer, they’re basically retrieving all the objects stored in the database that overlap the current viewing windows. Some data might already be available within the client, whereas other data-base contents have either not been retrieved yet or were retrieved earlier but dropped again. Instead of maintaining the available area’s exact definition, we store the information about availability within our spatial data structure’s individual nodes. Each node can be either white (no data is available for the area this node represents, and such a node is a leaf), gray (some data is available for the area this node represents, and further recursion is needed to get the exact answer), or black (the whole area under this node is available in the local cache). If a gray node is a leaf, then some data is stored, but not enough to cause another split. In such cases,
the node has a rectangle associated with it that specifies which part of the node is valid.
Retrieving the data in response to a query involves traversing an appropriate PMR quadtree. The system does this in two steps. First, it finds out what areas need to be loaded from the server and builds a collection of rectangles that represent these areas. Then, the system uses this collection to load all the data from the server that lies within the rec-tangles. Finally, for each rectangle loaded, it adjusts the corresponding PMR quadtree node’s status.
Our system relies on the client to keep track of what data it has available and to request only miss-ing data to draw the user-requested area. In this way, the server can be stateless — it doesn’t need to keep track of what data was sent to which client in order to send only the data the client hasn’t received. The client can perform its own memory management internally, drop data it no longer needs, and down-load targeted data from the server. Essentially, the client treats leaf blocks of its PMR quadtree as “pages” of memory for caching purposes.
Comparison with
Raster-Based Visualization
We conducted a detailed comparison11between the SAND Internet Browser’s performance, that of a traditional bitmap approach (such as MapQuest), and that of the latest generation of tile-based map-ping services, such as Google Maps and Microsoft Virtual Earth. Our evaluation used TIGER data sets from the US Census Bureau corresponding to street maps for states in the mid-Atlantic region. This includes all the roads and streets in Virginia, Mary-land, the District of Columbia, New Jersey, and Pennsylvania. The data set contains more than 7,500,000 entries, each of which corresponds to a single line segment, with one or more line segments representing each actual street in the map. The total size of the data stored in the format distributed by the US Census Bureau is more than 700 Mbytes.
For the traditional bitmap approach, in most deployment scenarios, network environments, and usage patterns, we found that users can expect to have a substantially better experience using the SAND Internet Browser.11For the tile-based servic-es, our browser’s performance and that of the tiled method were mostly comparable across different deployment types, network speeds, and usage sce-narios. The SAND Internet Browser’s advantage is that it caches data in vector format on the client, which allows for development of more
sophisticat-ed clients that can execute some operations locally. With the tile method, the client can access only those bitmap tiles that don’t provide data for such localized calculations. Thus we see that even though SAND might be slower in some scenarios, it often provides a preferable platform for developing smarter, more independent client applications.
O
ur work focused mainly on investigating and optimizing remote access to spatial databases. The results of our experiments let us suggest the best type of remote spatial data visualization tool for a given deployment scenario.11Although the SAND Internet Browser in its current implementa-tion works only with the SAND database manage-ment system, it could be expanded to interface with other DBMSs that support spatial data, such as Oracle or PostgreSQL.We can take future research in many directions. One interesting topic involves investigating meth-ods for caching frequently used data in the form of bitmap tiles instead of vectors. Although these tiles would be usable only in given views (in terms of zoom factor and layers displayed), they would also let users skip repeated rasterization steps. Such a system would, in effect, be a hybrid between the SAND Internet Browser as it is today and the tile approach Google Maps introduced.
Acknowledgments
The SAND Internet Browser is based on the SAND system and its predecessor, the QUILT system, developed over an extended time period with contributions from Houman Alborzi, Chuan-Heng Ang, Walid G. Aref, Thor Bestul, Pedja Bogdanovich, Frantisˇek Brabec, C. Ben Cranston, Claudio Esperança, Kikuo Fujimura, Gísli R. Hjaltason, Eric G. Hoel, Glenn Iwerks, Edwin Jacox, David Kuijt, Michael Lee, Frank L. Morgan, Randal C. Nelson, Hanan Samet, Jagan Sankaranarayanan, Clifford A. Shaffer, Ron Sivan, Aya Soffer, Egemen Tanin, and Robert E. Webber. We gratefully acknowledge US National Science Foun-dation support under grants EIA-00-91474 and CCF-0515241, as well as support from Microsoft Research and the University of Maryland General Research Board.
References
1. H. Samet et al., “Use of the SAND Spatial Browser for Dig-ital Government Applications,” Comm. ACM, vol. 46, no. 1, 2003, pp. 63–66.
2. C. Esperanca and H. Samet, “Spatial Database Program-ming using SAND,” Proc. 7th Int’l Symp. Spatial Data Handling, Int’l Geographical Union Commission on
Geo-graphic Information Systems, Assoc. for GeoGeo-graphical Information, 1996, pp. A29–A42
3. G.R. Hjaltason and H. Samet, “Distance Browsing in Spa-tial Databases,” ACM Trans. Database Systems, vol. 24, no. 2, 1999, pp. 265–318.
4. G.R. Hjaltason and H. Samet, “Speeding up Construction of PMR Quadtree-Based Spatial Indexes,” Very Large Data-bases J., vol. 11, no. 2, 2002, pp. 109–137.
5. T. Barclay, J. Gray, and D. Slutz, “Microsoft TerraServer: A Spatial Data Warehouse, Proc. ACM SIGMOD Conf., ACM Press, 2000, pp. 307–318.
6. C. Yap, K. Been, and Z. Du, “Responsive Thinwire Visualiza-tion: Application to Large Geographic Datasets,” Proc. 14th Ann. Symp., Electronic Imaging 2002, IS&T/SPIE, 2002. 7. M. Bertolotto and M.J. Egenhofer, “Progressive
Transmis-sion of Vector Map Data over the World Wide Web,” Geo-Informatica, vol. 5, no. 4, 2001, pp. 345–373.
8. Geography Markup Language (GML) 2.0, 2002; http:// portal.opengeospatial.org/files/index.php?artifact_id=4700. 9. C.B. Cranston et al., “Adding an Interoperable Server Inter-face to a Spatial Database: Implementation Experiences with OpenMap,” Proc. 2nd Int’l Conf. Interoperating Geo-graphic Information Systems (INTEROP 99), LNCS 1580, Springer-Verlag, 1999, pp. 115–128.
10. H. Samet, Foundations of Multidimensional and Metric Data Structures, Morgan-Kaufmann, 2006.
11. F. Brabec, Optimizing Client-Server Communication for Remote Spatial Database Access, PhD thesis, tech. report CS-TR-4822, Computer Science Dept., Univ. of Maryland, 2005.
Frantisˇek Brabecis a chief scientist for Roam Secure, where he is responsible for research and development of the compa-ny’s emergency alerting and resource management prod-uct lines. His research interests include visualization of spatial data structures, spatial databases, and thin-client oriented design for remote spatial database access. Brabec has a PhD in computer science from the University of Maryland. Contact him at [email protected]
Hanan Sametis a professor of computer science at the Univer-sity of Maryland. He’s also a member of the Computer Vision Laboratory, where he leads several research projects on image databases and the use of hierarchical data struc-tures for geographic information systems (GISs), spatial databases, computer graphics, and image processing. Samet has a PhD in computer science from Stanford University. He is the author of Foundations of Multidimensional and Metric Data Structures (Morgan-Kaufmann, 2006), The Design and Analysis of Spatial Data Structures, and Appli-cations of Spatial Data Structures: Computer Graphics, Image Processing and GIS (both Addison-Wesley, 1990). Contact him at [email protected].