i
Project No. 12-85 COPY NO. 1
Highway Bridge Fire Hazard Assessment
Draft
Guide Specification for Fire Damage Evaluation
in Steel Bridges
Prepared for the NCHRP Program
Transportation Research Board
of
The National Academies
SPECIAL NOTE: This report IS NOT an official publication of the National Cooperative Highway Research Program, Transportation Research Board, National Research Council, or The National Academies. The opinions and conclusions expressed or implied are those of the research agency that performed the research and are not necessarily those of the Transportation Research Board or its sponsoring agencies. This report has not been reviewed or accepted by the Transportation Research Board Executive Committee or the Governing Board of the National Research Council.
William Wright Brian Lattimer Michael Woodworth
Mohammad Nahid Elisa Sotelino
Virginia Polytechnic Institute and State University Blacksburg, VA
ii
CONTENTS
CONTENTS ... II LIST OF FIGURES... V LIST OF TABLES ... VII ACKNOWLEDGEMENT OF SPONSORSHIP ... VIII ABSTRACT ... IX LIST OF ACRONYMS ... XI
CHAPTER 1 RISK FACTORS FOR BRIDGE FIRE ... 1
REVIEW OF DATA SOURCES ... 2
Bridge Fire Case Reports ... 2
Vehicle Crash Statistics ... 3
RISK OF BRIDGE DAMAGE BY FIRE ... 4
SUMMARY ... 4
CHAPTER 2 STRUCTURAL RESPONSE DURING FIRE EVENTS ... 5
HIGH TEMPERATURE MATERIAL BEHAVIOR ... 6
Steel Properties... 6
Concrete Properties ... 12
PREDICTING BRIDGE RESPONSE AT HIGH TEMPERATURES ... 18
High Level Analysis - NCHRP 12-85 ... 19
Approximate Analysis ... 20
High Level Analysis Example - I-65 Birmingham Bridge Fire ... 20
PREDICTING TEMPERATURE FROM BRIDGE RESPONSE ... 22
EFFECT OF PARAMETERS ON BRIDGE RESPONSE ... 26
Fire Location ... 26
Fuel Source Size ... 27
Fire Duration ... 27
Effect of Vertical Clearance ... 27
Effect of End Boundary Conditions ... 28
CHAPTER 3 POST FIRE STRENGTH EVALUATION ... 29
POST-FIRE STEEL PROPERTIES ... 30
Carbon and Low Alloy Structural Steels ... 30
Heat Treated Steels ... 33
iii
Destructive Testing ... 38
POST-FIRE CONCRETE PROPERTIES ... 39
Post-Fire Material Properties ... 39
Estimation of Temperature ... 42
Non-Destructive Testing / Observation ... 45
Destructive Testing ... 46
SYSTEM STRENGTH EVALUATION ... 46
Load Rating Procedures ... 47
Composite Action ... 47
Member Distortion ... 48
Bearings & Expansion Joints ... 49
Connections ... 49
CHAPTER 4 POST FIRE SERVICEABILITY EVALUATION ... 51
STEEL MEMBERS ... 51
Fatigue and Fracture ... 51
Coatings ... 52
Bolted Connections ... 52
CONCRETE ELEMENTS ... 53
Effect on Corrosion Resistance ... 53
Deck Cracking Prediction ... 53
Deck Temperatures ... 55
Epoxy Coated Reinforcing Steel ... 56
CHAPTER 5 RECOMMENDED ACTIONS DURING FIRE EVENTS... 57
EVALUATION OF STRUCTURAL INTEGRITY ... 57
RECORDING DATA AND INFORMATION ... 58
SUPPRESSION ACTIONS BY EMERGENCY RESPONDERS ... 59
CHAPTER 6 FIRE PROTECTION STRATEGIES... 60
MINIMIZING VEHICLE CRASH RISK ... 60
PASSIVE PROTECTION ... 60
ACTIVE FIRE SUPPRESSION ... 61
CONTROL OPERATING SITUATION AROUND STRUCTURE ... 62
Combustible Materials ... 62
Drainage Control ... 62
v
LIST OF FIGURES
Figure 1 NY State database summary showing the cause of collapse. ... 2
Figure 2. Distributions of annual number of vehicle fires exposing bridges determined from three datasets. ... 4
Figure 3 Models to predict the thermal conductivity of steel compared to the experimental data developed in different test programs... 6
Figure 4 Specific heat of structural steel as a function of temperature ... 7
Figure 5 Thermal strain in steel under free expansion conditions. ... 7
Figure 6 Reduction in yield strength of structural steel at high temperature. ... 9
Figure 7 Reduction in elastic modulus of structural steel at high temperatures ... 10
Figure 8 Change in shape of the stress-strain curve for Grade 50 steel based on the Eurocode model... 11
Figure 9 Creep strain predicted by the Harmathy model at 550°C for three different applied stress levels. ... 12
Figure 10 Thermal conductivity models for concrete. ... 13
Figure 11 Variation in heat capacity of normal-strength concrete as predicted by different models and test data. ... 14
Figure 12 Thermal strain under free expansion conditions for concrete. ... 15
Figure 13 High temperature compressive strength of normal strength concrete. ... 16
Figure 14 High temperature compressive strength of high strength concrete. ... 16
Figure 15 Variation of elastic modulus for normal strength concretes. ... 17
Figure 16 ASCE temperature-dependent stress-strain models. ... 18
Figure 17. Fire fighters work to control the flames approximately 40 minutes after the beginning of the incident.(8) ... 21
Figure 18. View of damaged I-65 South bridge looking south from the North bound lanes of the interchange weave.(8) ... 21
Figure 19 Flame profile for the Case 8 Tanker fire. The flames do not extend to the outside face of the exterior girders (t = 1200 sec.) ... 24
Figure 20 Plan view of the flame spread underneath the bridge for the Case 8 Tanker fire (t = 1200 sec.) ... 24
Figure 21 Temperature versus time history for the girder flanges during tanker fire Case 8. ... 25
Figure 22 View underneath the bridge showing the temperature contours for tanker fire Case 8. (temperature in °K) ... 25
Figure 23 Deflection response and flange temperature of the most severely heated girder with a tanker fire at midspan centered transversely under a 120 ft simple span bridge. ... 32
Figure 25 Post fire compressive strength of normal strength concrete. ... 39
Figure 26 Post-fire tensile strength of concrete as a function of temperature. ... 40
Figure 27 Stress loss over time for strands heated to various temperatures after being pretensioned to 70% of the tensile strength (0.7 fpu). At temperatures above 300°C the strands failed. ... 41
Figure 28 Summary of residual strength test data reported by MacLean (2007). ... 42
Figure 29 Puyallup River Bridge ethanol fire. ... 45
vi
Figure 31. Loss of tensile stress carying capacity of conreinforced concrete elements as function of average tensile strain (22). ... 54 Figure 32 Concrete equivalent plastic tensile strain of the exposed side of a concrete deck
vii
LIST OF TABLES
Table 1 NCHRP 12-85 Benchmark Fire Simulations ... 23 Table 2 Concrete surface temperatures resulting from a bridge fire with gas temperatures around 1400°C. ... 43 Table 3. Approximate internal temperature observed in the middle third of concrete girder bridge span exposed to a tanker fire at Location A. ... 43 Table 4. Approximate maximum deck temperatures observed at mid span from simulated fire
viii
ACKNOWLEDGEMENT OF SPONSORSHIP
This work was sponsored by the American Association of State Highway and Transportation Officials, and was conducted in the National Cooperative Highway Research
Program, which is administered by the Transportation Research Board of the National Academies
DISCLAIMER
This is an uncorrected draft as submitted by the research agency. The opinions and conclusions expressed or implied in the report are those of the research agency. They are not necessarily those of the Transportation Research Board, the National Academies, or the program
ix
ABSTRACT
This Guide Specification is intended to assist engineers with evaluation of highway bridge structures following fire events. The work was developed as a partial deliverable under NCHRP Project 12-85. A separate research report published by the NCHRP for project 12-85 should be referred to for more detailed information. Overall, the project performed an in-depth evaluation of the problem of fire damage to highway bridges. The majority of bridges in the country consist of steel or concrete beams with a concrete deck. The primary cause of damaging fire events for these bridge types is vehicle crashes. Fires that fully involve the cargo of tanker and full heavy goods vehicle trucks are the subset of crash events that cause serious damage or bridge collapse. Smaller vehicles, such as busses, empty trucks, and cars are much less likely to cause bridge damage. Other damaging events, such as rail car fires, construction fires, and fires involving flammable materials underneath bridges have also occurred but these are less common than crash events. There are only two known fire events that have caused complete collapse of bridges in the U.S., both involved fully loaded tanker truck crashes.
This project looked at a probability based approach to assess risk but this proved to be elusive due to limitations of existing data. The probability of vehicle crashes is not random and there are many site specific issues that need to be considered. Site specific features are also responsible for non-crash related fire events. The overall operating situation must be considered for bridges on a case-by-case basis to evaluate risk. Overall, the probability of occurrence for damaging bridge fires is very low. There are no known cases where bridge failure during a fire event has caused human loss-of-life. The primary adverse consequence is loss of service of the bridge, either temporarily or permanently. This can be a substantial risk factor for bridges with high importance. It is difficult to compare bridge fire risk, that is based on specific conditions present at an individual bridge site, to earthquake, wind, and other hazards for which risk can be defined based on regional vulnerability.
The NCHRP 12-85 project performed a literature review on factors affecting bridge response during fire and collected a database of case study information to better understand fire risk. Relevant databases were studied to assess fire risk from fire department reports and vehicle crash statistics. There are many fire events that involve bridges each year but only a very small subset of events cause serious bridge damage. None of the existing data sets provided
information on isolating the small subset of damaging events from the overall number of events. The NCHRP 12-85 project performed a series of fire simulation studies on a "typical" grade separation structure to provide a better understanding of how fire causes bridge damage. A state-of-the-art modeling methodology was developed that coupled a fire dynamics model, a thermal analysis model, and a structural response model to provide a complete simulation of realistic fire events under a bridge. This methodology was benchmarked through analyzing fire tests available in the literature. It was further benchmarked by simulating the response of the I-65 Bridge fire that occurred in Birmingham, Alabama. This bridge was exposed to a large tanker truck fire that caused very large deflections and incapacitated the bridge for service. The model was used to perform a parametric study to look at the effects of vehicle type and size, fire location, and height of the bridge above the fire.
x
Following a fire event, engineers must immediately assess damage to determine if the bridge can be re-opened for service. Some types of damage are obvious, such as large deflections, bearing damage, collision damage, buckling of members, and other visually detectable degradation. There is also a possibility of hidden damage due to degradation of material properties. This Guide Specification provides information on how to use the parametric study results and other information in the literature to evaluate the post-fire strength and
serviceability of fire damaged bridges.
The Guide Specification is intended to be a reference for engineers performing a post-fire evaluation of bridge structures. Each bridge and fire event can be expected to have unique aspects that require unique evaluation. The Guide Specification is intended to provide a source of information that can be used to make rational engineering judgments. It is intended to be supplemented by the NCHRP 12-85 Research Report and Appendices that provides more detailed information. The following is a list of what is available in the 12-85 report:
1) A Microsoft Access database of case study information that was uncovered during the project. This allows searching for subsets of fire events based on the data fields and provides linked copies of reports and articles that may be available. 2) The "Highway Bridge Fire Hazard Assessment" Final report provides an
overview and conclusions from the study. The report contains seven appendices that provide detailed literature review information for reference.
3) Appendix A provides detailed results of the 14 fire simulation and thermal analysis models that were performed with different fire scenarios.
4) Appendix B provides detailed results for the 14 structural response simulations corresponding to the fire simulations in Appendix A.
Appendices A and B are intended to serve as benchmarks that an engineer can use for comparison to the fire event of concern. The simulations predict the fire size, provide the resulting temperatures of the bridge components, and provide the resulting structural response. Data is provided in this Guide Specification to assess the post-fire material properties if the temperature is known during the fire. The benchmark simulations provide a basis for predicting temperature and correlating the predicted results to physical observations of the structure and possible post-fire testing.
xi
LIST OF ACRONYMS
CVN Charpy Vee-Notch
DHS Department of Homeland Security DOT Department of Transportation
GES General Estimates System (NHTSA) EMS Emergency Medical Services
FARS Fatal Accident Reporting Service FDS Fire Dynamics Simulator
FEA Finite element analysis FEM Finite element model
FEMA Federal Emergency Management Agency FHWA Federal Highway Administration
FRP Fiber Reinforced Plastic HazMat Hazardous Materials
HGV Heavy Goods Vehicle (Semi-trailer with palletized cargo) HSC High Strength Concrete
NDE Non-destructive Evaluation
NFIRS National Fire Information Reporting System NFPA National Fire Protection Association
NHTSA National Highway Transportation Safety Administration NSC Normal Strength Concrete
NYDOT New York Department of Transportation PAR Police Action Report
PMHSA Pipeline and Hazardous Materials Safety Administration (U.S. DOT) U.S. DOT United States Department of Transportation
1
CHAPTER 1
RISK FACTORS FOR BRIDGE FIRE
This chapter provides an overview of the factors that define the fire risk for highway bridge structures. The most serious risk factor for causing serious bridge damage is crash events involving fuel tanker vehicles. Crash events and mechanical breakdown events involving other vehicle types can also cause bridge damage in some cases. However there is a lower potential for these vehicle types to become fully involved as fuel sources in the fire events. Non-vehicle related fire events, such as construction fires, trash fires, and wildfires have also involved bridge structures and caused damage in some cases. Overall, fire events that have sufficient magnitude to damage bridge structures are relatively rare. Most fire events will not exceed the threshold for bridge damage. That said, the consequences of a damaging bridge fire can be significant, both in the cost to repair and replace the bridge and the user-costs associated with roadway closure.
Quantifying risk for the general bridge population is difficult for several reasons. Most bridge structures are made from non-combustible materials, therefore fires are caused be external events in proximity to the bridge. Foremost is the fact that most fires involving bridges do not result in structural damage. This is the reason that tanker truck crash events present the most significant risk factor. Tanker vehicles carry large fuel sources that are vulnerable to spills and easy ignition during crash events. Once ignited, the fires tend to be quite large. Other vehicle types can also carry cargo and materials that can become a significant fuel source in fully developed fire events. However, it is generally more difficult to ignite these materials and there may be more time available for emergency responder intervention before the fuel potential is fully developed.
Another difficulty is that bridge fires are not random events. In most cases there are conditions present on specific bridges that increase fire risk. For non-vehicle sources, bridge location, site conditions, and site activities are contributing factors. Flammable materials present near a bridge elevate risk since they can be ignited by natural causes or arson. Location is a factor; any bridges located in areas where there is an elevated wildfire risk will also be more at risk. Bridge materials are also a factor. Wood structures are vulnerable to ignition from relatively small fire events while steel and concrete bridges require large external fire events to cause damage.
Vehicle crash events are also not totally random in occurrence. If everything was equal, we might expect that bridge fire events have the same probability of occurrence as vehicle fires anywhere on the roadway. However, many bridge fire events in the literature show that bridge features are a contributing cause of the crash event that causes the fire. Narrower shoulders, piers close to the roadway, and other factors are often present that increase the probability of crash events on or under the bridge. This risk is difficult to evaluate in a general sense because each bridge will have specific risk factors. Another variable is traffic, both the volume and vehicle composition.
This chapter summarizes some of the fire related statistics that were uncovered in the NCHRP 12-85 project. The available data provides insufficient information to develop a
2
meaningful risk evaluation procedure for the general population of bridges. Risk evaluation is largely a bridge-specific issue that can be related to the operating environment.
REVIEW OF DATA SOURCES
Bridge Fire Case Reports
The New York Department of Transportation has created a database documenting 1746 cases of bridge collapse that have occurred in the U.S. This data has been collected over many years through a combination of state surveys and reviews of information obtained from the media. The majority of collapses occurred from 1960 to the present. The data represented many bridge types, but most were fabricated from concrete, steel, and timber. The cause of failure was reported in all but one of the incidents as shown in Figure 1. In this database, collapse is defined as the bridge being incapacitated for service. Of the 1746 collapse events, only 50 were caused by fire. Of these, half were timber bridges in remote locations that were damaged by wildfires or arson. This leaves about 25 cases nationwide where fire has caused permanent loss of the bridge. There are many more cases where fires resulted in no damage or repairable damage.
Figure 1 NY State database summary showing the cause of collapse.
The NCHRP 12-85 database was able to uncover 118 significant fire events on bridges from a variety of sources. The fire events in the N.Y. State database are included and
supplemental information is provided when available. Many fire events, particularly those that have high significance, have published media and engineering reports available. However, most fire events with lesser severity were handled as engineering problems at the state level and the information is unpublished. A survey was sent to the 50 State transportation departments to attempt to gather information that might be available. Responses were collected from about half the states revealing about 60 events.
Number of Collapses 0 200 400 600 800 1000 1200 Collision Construction Deterioration Earthquake Fire Geotechnical Hydraulic Material: Concrete Material: Steel Miscellaneous Nature Overload
3
Only two events caused complete bridge collapse, the MacArthur Maze interchange in Oakland, California, and the Nine Mile Road Bridge over I-75 in Detroit, Michigan. Both were caused by tanker truck crash events underneath the bridge. There are many more cases where bridges were severely damaged and could not be returned to service. From an operational standpoint, a severely damaged bridge that cannot be reopened for service and requires
replacement is not much different than a complete collapse. No cases where uncovered where bridge collapse resulted in injury or loss of life. In most cases, persons near the fire, including many vehicle occupants involved in the crash events, were able to evacuate the area safely. This is a distinct difference between bridge fires and fires occurring in buildings and tunnel structures where structural performance has a more direct impact on human safety during the fire event.
Vehicle Crash Statistics
The National Highway Traffic Safety Administrations (NHTSA) Fatal Accident
Reporting Service Encyclopedia (FARS) maintains a database of fatal crash statistics spanning the years 1994 to 2008. On average, there are 36 crash events each year that involve fire, bridges, and fatalities. About half involve impact with parapets or bridge rails suggesting the crash events occurred on top of the bridge deck. The other half reports impacts with piers or abutments, presumably below the bridge. In general, fires occurring and contained on bridge decks cause far less superstructure damage compared to fires occurring underneath the bridge. However, there are many cases reported where large fuel spills occur on the deck, follow a rainwater drainage path, and cause substantial fires below the bridge. Over the 18 year period where data was collected, only 82 total crash events were reported that involved vehicles over 26,000 lb. gross vehicle weight. The majority of events involve passenger cars and smaller two-axle trucks.
The National Automotive Sampling System-General Estimates System (GES) is
maintained by the NHTSA and has been in operation since 1988. It is the primary resource used by various government agencies to gain information about non-fatal crash statistics. the database serves as the primary information source for the annual report, "Large Truck Crash Facts"
reported by the FHWA. The GES database estimates that there are about 82 events per year that involve collision with a bridge and fire. This number is based on extrapolation from about 50,000 reported events per year. This number exceeds the FARS number since the GES data includes crash events that do not involve fatalities.
In the United States, fire statistics fall under the authority of the National Fire Incident Reporting System (NFIRS), managed currently by the Department of Homeland Security (DHS) and its sub-agency the Federal Emergency Management Agency (FEMA). The National Fire Protection Association (NFPA), a professional organization, produces several annual summary reports based on the NFIRS data, however none are specific to bridges. The NFIRS data is assembled from incident reports submitted by participating fire departments around the U.S. An NFPA report based on the NFIRS data states that bridges and trestle fires occurred on average 320 times a year between 2003 and 2007.(1) Only about 15% of these cases involve vehicles; most involve trash fires, flammable superstructures, or natural wildfire type events.
4
RISK OF BRIDGE DAMAGE BY FIRE
Statistically, Figure 2 summarizes the number of vehicle fire events involving bridges occurring each year as predicted from each of the three databases.
Figure 2. Distributions of annual number of vehicle fires exposing bridges determined from three datasets.
It can be roughly estimated from the 50 bridge fire cases reported in the N.Y. State collapse database that about one bridge per year will be destroyed by fire. The 12-85 project database uncovered 118 bridge fire cases that were significant enough to be reported by State DOT's or in the media. The most significant cases in the N.Y. State database are included in the 12-85 database. It is clear that only a very small subset of vehicle crashes involving fire and bridges cause bridge damage. However, the databases do not contain sufficient information to quantify this number with any statistical validity. It can be generally estimated, however, that each state in the U.S. may experience several events each year that require bridge evaluation for possible structural damage.
SUMMARY
The risk of bridge fire is strongly related to the likelihood of vehicle accidents on or under the bridge. Various bridge features can be identified that affect the probability of accidents and highway safety. Structures beneath bridges that are close to the roadway, like piers and abutments , were involved in many crash events that occurred underneath the bridge. Crash events on the bridge deck involved more collisions with bridge rails or parapets. Smaller vehicles (cars and vans) were responsible for the majority of crash and fire events but they typically do not result in bridge damage. Fires involving larger vehicles can produce either severe or small fire events depending on the degree of involvement of their cargo. It was not possible to isolate the crash and fire events that cause bridge damage from those that do not cause damage from the available database information.
5
CHAPTER 2 STRUCTURAL RESPONSE DURING FIRE
EVENTS
This chapter provides a summary of information that can be used to predict the structural response of bridge structures involved in fire events. An emphasis is placed on "typical" steel and concrete girder-type bridges with concrete decks. The NCHRP 12-85 Research Report contains information in Appendix E about other bridge materials. Bridges built from timber, aluminum, or fiber reinforced plastic are not directly addressed by this guide. The structural response during a fire is determined by the high temperature material properties and the
temperature of the bridge members. The bridge system involves a complex interaction between components and substantial temperature gradients throughout the structure. The end boundary conditions of the fire-affected span, such as expansion joints and multi-span continuity, will also have an effect on structural response. The most accurate way to predict high temperature bridge response is to use refined analysis methods such as 3D non-linear finite element analysis (FEA). Behavior approximations are possible based on strain compatibility if the temperature
distribution is known. Any type of structural analysis requires knowledge of two things; the temperatures developed in the structure and high temperature material properties.
The NCHRP 12-85 Research Report contains the results of 14 advanced simulations of fire events underneath a bridge structure. The methodology involved a coupled, three-step procedure that simulates the fire event and heat transfer to the bridge, performs a thermal analysis to determine the material temperatures at all locations, and performs a non-linear structural analysis that is programmed with the high temperature material properties. This procedure involves advanced software and computer resources that typically exceed those available to bridge engineers. While they can serve as a model methodology for engineers if the tools are available, the most valuable use is to serve as benchmarks for evaluating structural temperature and response using simpler engineering analysis methods.
Knowing the high temperature structural response of bridges is useful for predicting behavior prior to fire events. The maximum deflection at high temperatures is determined by thermal expansion effects, reduced material strength, the reduced modulus of materials at high temperatures, and the effects of creep. When the structure cools after the fire event, a substantial amount of this deflection recovers. It is even possible in some cases to have some positive residual camber if localized yielding occurs during the fire. If the deflection recovers, the geometry of the bridge is still suitable for its intended traffic use. Any affect on load rating needs to be determined based on a survey of localized damage and post-fire material properties. Predicting the maximum high temperature deflection of structures is interesting, but the most important aspect is to predict the presence of permanent deformation after the fire. Although not practical in most cases, a rigorous fire engineering analysis could be performed in the design process to predict the ability of a bridge to remain serviceable following fire events.
The most important engineering problem is to evaluate the post-fire strength and serviceability of the bridge structure. Any permanent deflections will be obvious and their impact can be assessed without the need for high temperature modeling. However, high
6
temperature modeling can be useful to develop a better understanding of material temperatures during the fire. There is substantial information available in the literature that can be used to predict the post-fire material properties based on the temperature reached during the fire event. Fire simulation modeling provides a benchmark for predicting the material temperatures that occurred during the fire. The results from the 14 fire simulations that are provided in
Appendices A and B of the Research Report are intended to be used for this purpose in the following chapters. This chapter provides an understanding of the high temperature modeling process.
HIGH TEMPERATURE MATERIAL BEHAVIOR
Steel Properties
The properties of structural steel change significantly at high temperatures. The two primary sources for high temperature steel properties are the ASCE (2) and the Eurocode (3). Property data available in the literature has been recently collected by Kodur, et.al. (4) and is compared with the ASCE and Eurocode prediction models in the following sections. The purpose of including data is to provide a sense of the variability and bias provided by the ASCE and Eurocode predictions. More details are provided in the Research Report.
Thermal Properties
The thermal conductivity of steel decreases with increasing temperature as shown in Figure 3. Thermal conductivity in steel is less variable with temperature than the thermal conductivity of concrete.
Figure 3 Models to predict the thermal conductivity of steel compared to the experimental data developed in different test programs.
Temperature (οC) 0 200 400 600 800 1000 The rm a l C onduc ti v it y ( W /m ο C ) 0 10 20 30 40 50 60 Test Data ASCE Eurocode
7
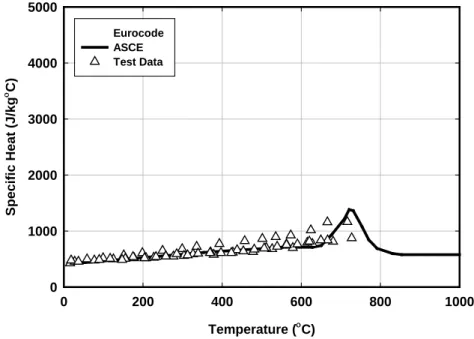
The specific heat capacity of steel increases with increasing temperature as shown in Figure 4. Both the ASCE and Eurocode predictions are equivalent at temperatures below 700°C. However, there is a large divergence between the models between 700°C and 800°C when the crystalline structure of steel breaks down.
Figure 4 Specific heat of structural steel as a function of temperature
Figure 5 Thermal strain in steel under free expansion conditions.
Temperature (οC) 0 200 400 600 800 1000 S p eci fi c H eat ( J/ kg ο C ) 0 1000 2000 3000 4000 5000 Eurocode ASCE Test Data
8
Thermal expansion may be the most important thermal property for structural response prediction at high temperatures. Large thermal strains and strain incompatibilities between different parts of the structure are a primary cause of global deflection and localized damage. The coefficient of expansion of steel increases at elevated temperatures. This amplifies the rate of thermal strain as a function of temperature as shown in Figure 5. Both the ASCE and
Eurocode models are in agreement up to about 750°C but they diverge at higher temperatures. It is more common to express thermal strain effects as a coefficient of expansion for engineering purposes. The ASCE model indicates that the coefficient of expansion (α) varies as a function of temperature:
(
)
-6For T <1000 : α = 0.004T+12 ×10 in/in/ C
-6
For T ≥1000 : α = ×16 10 in/in/ C
where T is the temperature in °C. At 1000 °C the coefficient of expansion is about 33% higher than at room temperature.
The amount of expansion that occurs at high temperatures is dependent of how the material is constrained. Free expansion occurs when the material has no restricting boundary conditions and no stress is developed. If free expansion is constrained due to boundary
conditions or surrounding cooler material stress develops in the material instead of strain. The general expression for thermo-elasticity in one dimension is:
T E
σ
ε = + ∆α
where E is the elastic modulus, α is the thermal coefficient of expansion, σ is stress, and ε is strain. If a member is constrained to prevent expansion, the strain will be zero and the change in temperature will create stress. Members in a bridge system will be subject to constraint from the surrounding members they are attached to. This constraint creates stress that can cause
distortion, buckling, or crushing of concrete.
Mechanical Properties
The yield strength of steel is greatly reduced as steel is heated in a fire. Some data collected by Kodur is shown in Figure 6 along with the predictive models from the ASCE and the Eurocode. The y-axis shows the yield strength at high temperature normalized by the yield strength at room temperature. There is a wide scatter in the data that has been reported by different researchers for different steel grades.
9
Figure 6 Reduction in yield strength of structural steel at high temperature.
The ASCE model provides lower predictions of yield strength and serves as a lower bound to the data. The Eurocode model forms somewhat of an upper bound. However, the Eurocode also considers the elastic proportional limit in their model for predicting high
temperature behavior. The Eurocode yield strength curve seems to provide a non-conservative prediction compared to most of the experimental data but when it is combined with the stress-strain constitutive relationship the resulting yield strength is similar to the ASCE model. The ASCE curve should be used for general engineering calculations of structural behavior. The more elaborate Eurocode approach is more suitable for programming into non-linear finite element solutions at high temperatures.
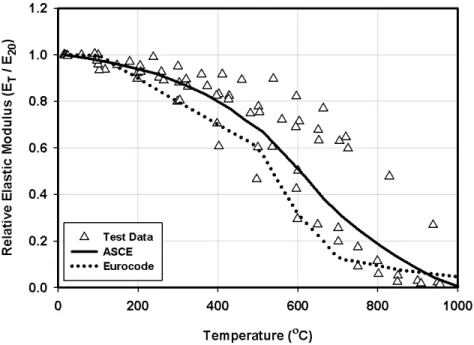
The elastic modulus of structural steel decreases with temperature similar to the yield stress. Figure 7 shows the data collected by Kodur compared to the ASCE and Eurocode prediction models. There is a wide variation in some of the data reported by different researchers due to differences in steel grade and experimental techniques. The ASCE and Eurocode models differ since they were developed considering different data sets. The ASCE model provides slightly stiffer material response compared to the Eurocode.
10
Figure 7 Reduction in elastic modulus of structural steel at high temperatures
In addition to changes in yield stress and modulus, the shape of the stress-strain curve changes significantly at high temperatures. This can have a significant effect on the results of material non-linear models used to predict structural deformation at high temperatures. The ASCE and Eurocode both have procedures for calculating stress strain curves at high
temperatures. As an example, Figure 8 shows the assumed stress-strain curve for Grade 50 steel as predicted by the Eurocode. The use of a proportionality limit by the Eurocode creates a softer transition from elastic to plastic behavior as temperatures rise. This transitional plasticity is a result of the influence of creep effects on the test data used to create the model.
. At room temperature, the behavior is close to elastic-perfectly plastic. At higher temperatures up to 400°C there is a large drop in the proportional limit and the curve becomes rounded. The steel can still reach the room temperature yield strength but at a much higher strain. The value taken for yield strength is dependent on how it is defined, the 0.2% offset method predicts a much lower yield strength at 400°C. This is the reason for the differences between ASCE and the Eurocode shown in Figure 6 where the ASCE model is closer to the 0.2% offset definition. As the temperature is increased to 600°C, the yield strength is reduced to less than half the room temperature yield strength.
11
Figure 8 Change in shape of the stress-strain curve for Grade 50 steel based on the Eurocode model.
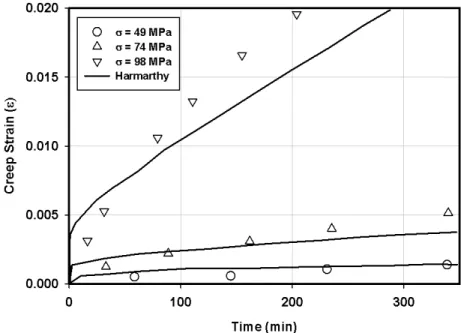
Creep of steel under sustained loading becomes a factor when the steel is heated. The influence of creep becomes more pronounced at temperatures greater that 400°C. As previously mentioned, it becomes difficult to separate creep effects from the stress-strain curve behavior. The ASCE recommends that designers include the effect of high temperature creep but do not recommend a model. For example, Figure 9 shows the creep strain predicted by Harmathy (5) for three different stress levels at 550°C for grade 36 steel. At higher stress levels the material fails due to the reduced yield strength.
Creep can be responsible for an appreciable portion of the permanent deflection observed in bridge structures after fire. Most primary bridge members are under stress due to dead load and any live loads on the bridge during the fire event. If the bridge is heated to a constant temperature and held at that temperature, deflection can slowly increase, possibly resulting in eventual collapse if the duration is long. The NCHRP 12-85 modeling results show that creep has a relatively minor effect on deflection for the typical vehicle fire events lasting around one hour. The effect of creep is more significant for longer duration events.
12
Figure 9 Creep strain predicted by the Harmathy model at 550°C for three different applied stress levels.
Concrete Properties
Similar to steel, the properties of concrete change significantly at high temperatures. However, concrete properties are much more variable depending on the material composition, moisture content, and other material differences. The two primary sources for concrete property prediction models are the ASCE (2) and the Eurocode (3). Knaack (6) assembled property data from 14 studies and the assembled data is shown in the following plots for comparison. The purpose of including data is to provide a sense of the variability and bias provided by the ASCE and Eurocode predictions.
Thermal Properties
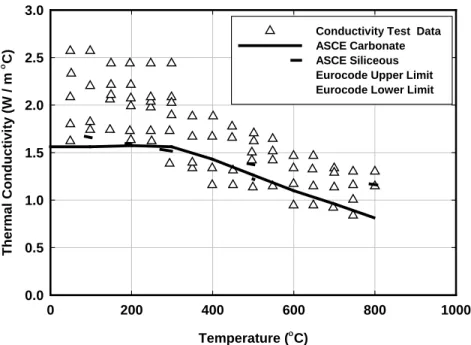
The thermal conductivity of concrete varies with it constitutive materials as shown in Figure 10. Moisture content and chemical processes also affect thermal conductivity and the variation with temperature. The ASCE presents two bilinear models, one for siliceous
aggregates and another for carbonate aggregates. The Eurocode provides parabolic curves that represent the upper and lower bounds of the data. The thermal conductivity of steel is about 30 times greater than concrete. Therefore, concrete tends to heat up internally much slower than steel when exposed to the same surface temperatures. This effect is very beneficial to prevent or delay strength loss in concrete beams and bridge decks.
13
Figure 10 Thermal conductivity models for concrete.
The specific heat of concrete has been presented in terms of heat capacity in Figure 11. Heat capacity, which is the product of specific heat and density, is similar to specific heat but it is based on volume rather than mass. Unlike thermal conductivity, the heat capacity of concrete does not vary much with temperature. One unique exception to this rule exists between 600ºC and 800ºC where excess calcium carbonate introduced by carbonate aggregate undergoes a endothermic reaction with other compounds in the cement, thereby absorbing a large amount of energy. Currently the ASCE model accounts for this effect while the Eurocode does not.
Temperature (οC) 0 200 400 600 800 1000 The rm a l C onduc ti v it y ( W / m ο C ) 0.0 0.5 1.0 1.5 2.0 2.5 3.0
Conductivity Test Data ASCE Carbonate ASCE Siliceous Eurocode Upper Limit Eurocode Lower Limit
14
Figure 11 Variation in heat capacity of normal-strength concrete as predicted by different models and test data.
Thermal expansion of the concrete must be considered to accurately model the behavior of restrained concrete elements. It also affects the internal compatibility between concrete and the reinforcing steel. If temperature-induced strain is prevented due to constraint, then a temperature change will cause stresses in the concrete. The rate of expansion is temperature dependent. Eurocode provides models for both siliceous and carbonate based concretes while ASCE does not differentiate based on aggregate type. Both Eurocode models predict more thermal expansion compared with the ASCE model as shown in Figure 12.
Temperature (οC) 0 200 400 600 800 1000 H eat C ap aci ty ( M J / m 3 ο C ) 0 2 4 6 8 10 12 14 16 18 20
Heat Capacity Data ASCE Carbonate ASCE Siliceous Eurocode
15
Figure 12 Thermal strain under free expansion conditions for concrete.
Mechanical Properties
The strength of concrete cylinder tests at elevated temperature is the most widely tested and reported property in the literature. In general, there is a slow degradation in compressive strength up to 400ºC followed by a more pronounced reduction at higher temperatures.
Variations in concrete composition have a large influence this relationship. Figure 13 shows the data scatter for normal strength concretes collected by Knaack (6). Normal strength concrete is defined as having a room temperature compressive strength of 6,000 psi or below.
Figure 14 shows the data scatter for high strength concrete strength at elevated
temperatures. In addition to the ASCE and Eurocode models, an additional model by Phan and Carino is shown. (7) All models show an initial strength drop at around 100°C, relatively constant strength to about 400°C, followed by increased strength loss at higher temperatures. The models predict higher strength losses for high strength concretes compared to normal strength concretes because the denser cement matrix results in increased pore pressure and micro-cracking. Temperature (οC) 0 200 400 600 800 1000 S tra in OF The rm a l E x pa ns ion (ε) 0.000 0.002 0.004 0.006 0.008 0.010 0.012 0.014 0.016 ASCE Eurocode Siliceous Eurocode Carbonate
16
Figure 13 High temperature compressive strength of normal strength concrete.
Figure 14 High temperature compressive strength of high strength concrete.
Temperature (οC) 0 200 400 600 800 1000 R el at iv e C o m p ressi v e S tr en g th (f ' c T / f ' c 2 0 ) 0.0 0.2 0.4 0.6 0.8 1.0 1.2
Compressive Test Data ASCE Eurocode Carbonate Eurocode Siliceous Temperature (οC) 0 200 400 600 800 1000 R el at iv e C o m p ressi v e S tr en g th (f ' c T / f ' c 2 0 ) 0.0 0.2 0.4 0.6 0.8 1.0 1.2
Compressive Test Data Phan and Carino Eurocode Class 2 Eurocode Class3
17
Less data exists in the literature for the high temperature modulus of elasticity for concrete. Measurement of modulus is very sensitive to testing procedures and different
procedures are used by different researchers. This complicates the comparison of results. Both static and dynamic tests have been performed to determine modulus. The static modulus can be measured as the initial tangential modulus or as a secant modulus. Dynamic tests were reported using ultrasonic pulse or resonance frequency testing methods. In addition to ASCE and ACI 216, Knaack and Kurama (6) present a mathematical model for elastic modulus as a function of temperature as shown in Figure 15.
Figure 15 Variation of elastic modulus for normal strength concretes.
The stress-strain relationship is the most important constitutive relationship for non-linear analysis of concrete. Popular design models such as Whitney’s stress block do not scale well with temperature. The aforementioned changes in compressive strength and modulus of elasticity alter the shape of the stress-strain relationship. Additionally the ultimate crush strain is increased with temperature while the strain at peak stress decreases. This change in stress strain behavior predicted by the ASCE model is shown in Figure 16. The Eurocode has a different model but the two codes show the same trends. Neither code makes a distinction between normal and high strength concretes.
Temperature (οC) 0 200 400 600 800 R el at iv e E last ic M o d u lu s (E T / E2 0 ) 0.0 0.5 1.0 1.5 2.0 Test Data ASCE ACI 216 Knaack NSC
18
Figure 16 ASCE temperature-dependent stress-strain models.
PREDICTING BRIDGE RESPONSE AT HIGH TEMPERATURES
The preceding sections show that all aspects material behavior change as a function of temperature. Real fires do not heat structures uniformly, they heat localized areas more than others. As a result, different regions of the structure will have substantially different properties at any given point in time. This makes accurate prediction of high temperature structural
response a very difficult problem for linear-elastic structural analysis. Accurate modeling results depend on knowing the temperature and temperature gradients present in the structure. The temperature can be expected to continuously change as a function of time and location. They also depend on having a model that can program in the material properties as a function of temperature. Creep is another complicating factor that affects deflections as a function of time. Overall, a very sophisticated modeling methodology is required to understand this problem.
The modeling methodology developed and utilized in NCHRP 12-85 utilized the Eurocode models for the high temperature material properties of both steel and concrete. The Harmathy creep model was also implemented to capture this added effect. The heat flux from the fire to the bridge was determined by simulating the fire event underneath the bridge using the fire dynamics simulation (FDS) software. A thermal analysis was then performed where the structure was exposed to the FDS heat flux and the thermal properties of the materials defined the heat transfer and resulting material temperatures. The resulting temperatures therefore vary with both time and location in the structure. In a final step, the material temperatures that vary with time were input into a structural model that predicted the bridge response based on the high temperature material properties. This coupled simulation methodology was validated and shown to provide a reasonable prediction of both temperature and response for this type of structural
Strain (ε) 0.00 0.02 0.04 0.06 0.08 R el at iv e C o m p ressi v e S tr ess (f ' c T / f ' c 2 0 ) 0.0 0.2 0.4 0.6 0.8 1.0 1.2 20 οC 200 οC 400 οC 600 οC 760 οC
19
simulation. However, the combination of models takes weeks to run on a high speed computer cluster. Therefore, this methodology is more suited for a research environment or for specialized engineering problems that require advanced solutions.
Alternatively as an approximation, engineers can apply a plastic-mechanism type approach to structural evaluation. Plastic analysis involves establishing a collapse mechanism when multiple plastic hinges form in the structure. Plastic hinges are assumed to occur at locations of high moment as indicated by the elastic moment diagrams. The hinges must form a mechanism to define the plastic collapse load. The biggest problem that must be overcome with this approach is that most fires do not heat the girders in a bridge uniformly. It is typical that some girders located directly over the fire will be at higher temperature compared to those further away from the center. The cooler girders retain their strength and stiffness longer and can accept load shedding from the hotter girders. To account for this effect, the plastic hinge capacity can be defined as a function of temperature and a mechanism analysis can be performed to estimate structural response. The accuracy of such an analysis depends on the accuracy of the temperature distribution assumed in the structure.
High Level Analysis - NCHRP 12-85 Fire Heating Simulation
The NCHRP 12-85 study utilized a coupled simulation modeling methodology that provides realistic simulations of bridge fires. The fire events were simulated using the Fire Dynamics Simulation (FDS) software developed by the NIST. The FDS simulation generates a fire at a given location defined by the footprint size and fuel source. The bridge geometry must be programmed in the FDS simulation since geometry has a significant effect on how flames develop. This complex interaction determines the heat flux that is transferred to the bridge. Surfaces that are sheltered from the flames will have lower heat flux compared to those that have more direct exposure. The spaces between girders underneath a bridge have a large effect on the flame spread and therefore the heat flux.
A simpler method of heating is to expose a structural model to temperature profiles generated from standard fire curves. Such curves present the temperature as a function of time based on information developed in fire tests involving building fires. This approach is
commonly used to evaluate the fire rating of components and systems in buildings. Standard temperature versus time curves have been developed for this purpose. These, however, have only limited relevance for prediction of fire response in bridges. Bridge fires are open-air type fires that will differ greatly compared to internal fires in closed building rooms.
The simplest method is to subject the bridge to a constant temperature that may represent an idealized situation where a bridge is placed in a furnace. This approach may be useful for approximate analysis methods designed to set worst-case bounds on structural response. However, one cannot expect to use this approach to obtain accurate deflection predictions.
Thermal Analysis Simulation
The specific heat capacity and thermal conductivity of bridge members have a large effect on member temperature. In real situations, heat from the fire generates a heat flux on the
20
surface of the members. Some of this heat is being conducted and radiated away from the members to cooler areas of the structure. It is the balance between the two that determines the member temperature. High level finite element codes are capable of accurately modeling this interaction.
Structural Response
Assuming the temperature present in the bridge members is established through fire simulation and thermal analysis procedures, the final challenge is to determine the response of the structure under these temperatures. High level finite element codes allow non-linear material properties to be programmed as a function of temperature. They also allow programming in the expected creep behavior expected for materials under stress at high temperatures.
A major factor that affects the response of bridge systems is the differential expansion that occurs between members of different materials at different temperatures. Looking at the axial expansion of a single beam at constant temperature, the end boundary conditions will have a large effect on deflection response and the stress that develops in the beam when it is heated. Following the principal of thermo-elasticity, free expansion boundary conditions will result in strain but no stress. Conversely, fixed end boundary conditions will result in stress but no strain. The actual end boundary conditions present in a typical bridge can be expected to lie between these two bounds and the behavior can be expected to become nonlinear once the design expansion capacity of the bridge is exceeded. The stresses developed by restraining axial expansion can be large and exceed the capacity of materials. The stress developed from end restraint can overcome tensile stresses and introduce buckling in steel members and induce cracking in concrete members.
The effects of differential expansion become more complicated when the members are considered within the structural system. Temperature gradients and different coefficients of expansion between materials can develop internal constraint conditions that will affect stresses and strains in the members. This will then affect buckling behavior, cracking behavior, and forces on connections.
Approximate Analysis
Approximate analysis methods can be useful to establish bounds on behavior. As was previously mentioned, plastic mechanism analysis can be employed to determine the temperature that might be expected to cause a collapse mechanism to develop in a structure. Mechanism analysis methods can be implemented on different levels of increasing complexity: 1) model a hinge mechanism in single members from the structure; 2) model multiple members in a 2D grillage system; or 3) use a full 3D finite element analysis. Plastic hinge capacities can be estimated based on knowledge of the material properties at high temperatures.
High Level Analysis Example - I-65 Birmingham Bridge Fire
The NCHRP 12-85 project performed high level simulations of a major tanker truck fire that occurred under a bridge carrying I-65 in Birmingham Alabama. The event occurred in Birmingham, Alabama at 10:15 am on January 5, 2002 when the driver of a fuel tanker truck swerved to avoid a merging car while traveling on the I-59 ramp as it converges with I-65 South. The gasoline tanker truck collided with the pier of the I-65 overpass at the I-20, I-59 and I-65
21
junction complex. The fire event consumed 9,900 gallons of diesel fuel and lasted
approximately 45 minutes. As seen in Figure 17, the fire was located near the pier of the bridge and offset such that a portion of the footprint of the fire was under the bridge structure and a portion was uncovered. In part due to the non-uniform exposure, there was only a partial collapse of the bridge as shown in Figure 18.
Figure 17. Fire fighters work to control the flames approximately 40 minutes after the beginning of the incident.(8)
Figure 18. View of damaged I-65 South bridge looking south from the North bound lanes of the interchange weave.(8)
22
The damaged bridge consisted of three simply supported spans (83 - 121 - 85 ft) carrying two traffic lanes. The cross section consists of seven 54” deep (1370 mm) plate girders with a composite 6.5” (165 mm) concrete deck. An off ramp on the departure side of the bridge meant that departure side was slightly wider than the approach side. The overall width increased to 54 ft (16 m) from 41 ft (12 m) at the narrower end. The widening meant the girders fanned out to support the non-uniform deck width. The piers and abutments are aligned on a 33 degree skew, and the bridge has a standard 16 ft vertical clearance over the roadway below.
The NCHRP 12-85 research report shows that the high level modeling methodology was able to reasonably predict the large deformation observed in this bridge. The modeling also provided a reasonable approximation of the timeline. Large deflections do not occur
immediately, it takes many minutes for deformation to develop. The bridge materials heat slowly under the fire exposure and the mechanical properties decrease proportionally. Eventually the materials do not have sufficient strength to support the gravity loads on the bridge. For cases, such as the I-65 bridge, where the bridge does not completely collapse, there is a substantial recovery of vertical deflection when the structure cools after the fire.
PREDICTING TEMPERATURE FROM BRIDGE RESPONSE
The NCHRP 12-85 study developed 14 fire simulations on a typical simple span, multi-girder bridge. These simulations were based on the model that was validated by providing reasonable predictions of the I-65 Birmingham fire event. The detailed results from these simulations are available in Appendices A and B of the NCHRP 12-85 Research Report. These models were used in the research project to determine what fire events are likely to damage bridge structures. They also serve as a set of benchmarks that can be used to estimate material temperatures to assist the post-fire evaluation of structures. Engineers faced with post fire evaluation will typically know the fuel source (type of vehicle), the fire location with respect to the bridge, the approximate fire duration, and the physical damage that has occurred in the structure. Knowing these facts, the fire event can be compared to one or more benchmark events in the 12-85 report. The 12-85 research report and it's appendices contain information about the bridge response and more importantly, the peak material temperature that occurred during the fire. Four different trucks were used for the simulations, in order of increasing fire size:
• Bus This vehicle represents a large passenger bus.
• Half -Heavy- Goods Vehicle (1/2HGV) This is a box-type semi-trailer truck that is half full of palletized flammable cargo.
• Full-Heavy-Goods Vehicle (HGV) This is a full box-type semi trailer truck that is full of flammable cargo.
23
The fires were placed in four different locations underneath the bridge:
• Location A was centered at mid-span, both longitudinally and transversely. • Location B was centered at mid-span longitudinally, but was transversely offset
to be outside of an exterior girder.
• Location C was transversely centered under the bridge but longitudinally offset close to the pier at the end of the span.
• I-65 Birmingham This location was offset both transversely and
longitudinally from the center of the bridge to correspond with the observed location of the actual fire event.
Three different vertical clearances were studied above the roadway below where the base of the fire was located, 16 ft, 24 ft, and 32 ft. The parametric study test matrix is shown in Table 1.
Table 1 NCHRP 12-85 Benchmark Fire Simulations
Case No. Vehicle Type Fire Location Beam Material Vertical Clearance (ft) Maximum Heat Release Rate (MW) Event Duration Heating Phase (seconds) Cooling Phase (seconds) 1 Bus A Steel 16 40 5000 3600 2 B Steel 16 3 C Steel 16 4 HGV A Steel 16 210 2500 6100 5 Half HGV A Steel 16 105 2500 6100 6 B Steel 16 7 C Steel 16 8 Tanker A Steel 16 295 3000 5600 9 B Steel 16 10 C Steel 16
11 Tanker I-65 Steel 16
2650 5950 12 Tanker A Steel 24 13 A Concrete 16 14 A Steel 32
24
For each benchmark case, information is available concerning the fire event.
Visualizations are provided of the fire and how it spreads underneath the structure and affects the girders. There is also information about the duration of the fire event. Photographs and
knowledge of the fire under investigation can be compared the benchmarks to select the best match. As an example, Figure 19 and Figure 20 show the flame pattern for the Case 8 fire event.
Figure 19 Flame profile for the Case 8 Tanker fire. The flames do not extend to the outside face of the exterior girders (t = 1200 sec.)
Figure 20 Plan view of the flame spread underneath the bridge for the Case 8 Tanker fire (t = 1200 sec.)
For the benchmark that best matches the fire event, information is provided on the temperatures reached by the bridge girders and deck. As an example, Figure 21 shows the temperature versus time history of the bottom flanges for all seven girders at mid-span. Figure 22 shows the 3D temperature profile of the bridge girders. Consistent with the high flange temperature in all seven girders, Case 8 experienced very large deflection approaching collapse. Looking at the flange temperatures in Figure 21, The ASCE strength curve in Figure 6 would
25
predict that the middle five girders have lost almost all of their flexural capacity and the two exterior girders would have lost almost 80% of their capacity. A simple mechanism analysis would also predict collapse, although this ignores the strength of the parapet rail and the end boundary conditions.
Figure 21 Temperature versus time history for the girder flanges during tanker fire Case 8.
Figure 22 View underneath the bridge showing the temperature contours for tanker fire Case 8. (temperature in °K) time(sec) 0 1000 2000 3000 4000 5000 6000 7000 T em p er a tu re (K ) 0 200 400 600 800 1000 1200 1400 1600 Girder 1 Girder 2 Girder 3 Girder 4 Girder 5 Girder 6 Girder 7
26
EFFECT OF PARAMETERS ON BRIDGE RESPONSE
Fire Location
The location of the fire has a significant effect on the deflection response of the bridge. Since the strength and stiffness of the members is proportional to their temperature and the fire location determines how the different members are heated, the fire location directly determines the distribution of weakened members in the structure.
For bridges without structural members above the deck level, fires contained on bridge decks do not cause any significant heating of the bridge members below the deck. Most of the heat is directed upward and the deck concrete has relatively low thermal conductivity. This protects the underlying members from heat. It is important to recognize that fires involving fuel spills may also extend underneath the bridge. Liquid fuel will follow the normal drainage path for rain water and can cause significant fire underneath the bridge. These cases should not be considered to be deck fires.
Bridges with support structure above deck level, such as through trusses and cable supported structures, may have structural damage from fires confined to the roadway deck. These bridge types were not studies under the NCHRP 12-85 project. Any structural member that is exposed to direct flames for more than a few minutes may be vulnerable to fire damage. Guidance developed from girder temperature in the 14 case studies may be useful to estimate temperatures versus time for truss members exposed to flames. Cables are not directly covered by this Guide but some information is available in the NCHRP 12-85 Research Report.
Fires located in the center of the bridge, both longitudinally and transversely (Location A), caused the largest vertical deflection. As shown in Figure 22, the maximum heating occurs at the point where the girders have maximum moment due to loading. The exterior girders receive less heating since the fire does not wrap around the exterior face of the girders. There is a general reluctance for flames to spread transversely across the bridge due to the projection of the girders. It is much easier for flames to spread longitudinally. The center location causes strength reduction in most of the interior girders and the two exterior girders will carry most of the load in the latter fire stages. The bridge width and number of girders will have a substantial effect on transverse fire spread. Wider bridges will have even less heating on the exterior girders and more redundant load paths to support the weakened girders.
Offsetting the fire location transversely at mid-span (Location B) causes lower bridge deflection compared to the center location. The exterior girder under the offset fire gets higher heating but those on the opposite side receive less. Overall, this results in a stiffer structural system. Likewise, offsetting the fire longitudinally toward the pier or abutment results in lower deflection. The fire impacts the girders at locations where the bending moment is lower. The impacts of shear deformation are much lower than bending deformation. Many fires in the case study database have occurred in the offset locations. This helps explain why many bridges remain serviceable after relatively large fire events.
27
Fuel Source Size
The Bus and 1/2-HGV fires did not cause any permanent bridge deflection for any of the three fire locations. The tanker truck fire caused large permanent deflections at all three fire locations with complete collapse occurring when the tanker truck was at Location A. The HGV caused about 4 in. permanent deflection with the fire at Location A. For this "typical" girder type structure, it can be concluded that fully involved tanker fires are likely to cause permanent deflection for many fire locations. Fully developed HGV fires may cause some permanent deflection depending on conditions. Busses and 1/2-HGV fires are not likely to cause permanent deflection. This information should not be considered absolute since there are many variables involved in a given fire event. However, this serves as a guideline to isolate the fire events with the highest potential to cause bridge collapse and/or loss of service.
Fire Duration
The fire duration is heavily dependent on the fire size. Smaller fires have shorter duration and longer cooling time since the temperature difference between the heated elements and the ambient temperature is low. In the Tanker fires the bridge elements heat up faster, remain at an elevated temperature longer, and cool rapidly due to the larger bridge-ambient temperature difference. Discounting bearing and substructure damage, there are two effects that determine vertical deflection of the superstructure, high temperature plastic deformation and long term creep. The former is relatively insensitive to fire duration once thermal equilibrium is reached during the fire event. Under a sustained fire event of constant magnitude, thermal equilibrium will be reached where the material temperatures become relatively constant. Steel members will reach thermal equilibrium much faster that concrete members due to the
differences in thermal properties between the two materials. Creep, on the other hand, is highly influenced by fire duration. Members that are at thermal equilibrium will continue to slowly deform if they are under sustained stress. In redundant structural systems, creep deformation may be limited by load shedding effects to other structural members. Fire duration is a primary factor affecting creep deformation but the structural system effects also need to be considered.
The duration of fuel tanker fires is dependent on the leakage rate of fuel. Slower leaks may produce longer burning fire events with lower intensity. Likewise, the duration and intensity may vary for other types of vehicle fires. As an example of the effect of fire duration, the trash fire under the I-78 Bridge in Newark, NJ, burned for about 24 hours and caused about 9 in. of permanent deflection of the structure. This deflection can be attributed to creep and a shorter duration fire of the same intensity may not have caused any permanent deflection.
Effect of Vertical Clearance
Although it may seem somewhat obvious, the vertical clearance of the bridge over the fire has an effect on the likelihood of damage and deflection. The Tanker fire simulations were performed at Location A under bridges with three vertical clearances (16, 24, and 32 ft.). Increasing vertical clearance above 16 ft. changed the response from total collapse to permanent deformation. However, the difference between permanent deflection at 24 ft versus 32 ft was not significant. In all three cases, the flame height still had flames impinging on the bridge girders. However, the area underneath the bridge where flame impingement occurred was smaller at the higher clearance levels. Therefore there was less spread of heating, both transversely and