Statistics Paper Series
The Bank for the Accounts
of Companies Harmonized
(BACH) database
No 11 / September 2015
BACH Working GroupContents
Abstract 2
Executive summary 3
1 Introduction 5
2 The BACH database 7
2.1 The contents of the database 7
2.2 The main potentialities and limitations of the database 12
Box 1 Variable samples and sliding samples 13
Box 2 Variable samples versus sliding samples; a real example for
French trade SMEs 15
2.3 Data providers, samples, sources and accounting practices 16
3 Recent developments and their future impact on BACH 23
3.1 Revision of the European Union accounting directives 23
Box 3 Transposition of the new Accounting Directive 25
3.2 Implementation of ESA 2010 – The case of holding companies 26
4 Case study: the manufacturing sector 28
4.1 The sector and its representativity in BACH 28
4.2 The Importance and structure of the sector 29
4.3 An assessment of the economic and financial situation of the sector 31
Annex 1 Overview of the information available in the BACH database 36
Annex 2 National deviations 42
Annex 3 National sampling methods and metadata on data collection 45
Annex 4 Task force for holding companies and head offices: recommendations 50
Annex 5 The ECCBSO 52
Annex 6 BACH’s history and the BACH WG 54
Abstract
The Bank for the Accounts of Companies Harmonized (BACH) is a free-of-charge database containing the aggregated accounting data of non-financial incorporated enterprises for, so far, 11 European countries. While the individual accounts feeding the database were originally prepared in line with national accounting standards consistent with European Accounting Directives, they have been harmonised with a view to preserving, to the greatest extent possible, the cross-country comparability of the resulting data.
This article presents the methodology underpinning BACH, including the content of the database. It describes the characteristics of national samples and outlines the harmonisation process. BACH is a unique tool for analysing and comparing the financial structure and performance of firms across European countries. A simple case study is also presented in support.
Keywords: European non-financial corporations, statistics, accounting standards, annual individual accounts
Executive summary
The Bank for the Accounts of Companies Harmonized (BACH) database is a very powerful and unique tool for evaluating the economic and financial performance of European non-financial corporations. The information it provides is relevant to several groups of users and purposes, including researchers, national central banks and other institutions (for macroeconomic analysis and to support decision making), companies (as a benchmark) and also to credit and financial institutions (in credit risk analysis). The importance of the BACH database is well recognised by the European Banking Authority (EBA, 2012): “The BACH database is the most reliable source of available data containing balance sheet and profit and loss data for European companies.”
BACH is a free-of-charge database containing the aggregated accounting data of non-financial incorporated enterprises for, so far, 11 European countries (Austria, Belgium, Czech Republic, France, Germany, Italy, the Netherlands, Poland, Portugal, Slovakia and Spain). Four more European countries will join the BACH database in the coming years (Denmark, Luxembourg, Romania and Turkey). The BACH database facilitates the evaluation of the economic and financial
performance of European non-financial corporations, based on the Nomenclature of
Economic Activities (NACE1 Revision 2), and using detailed and harmonised
aggregated data to make cross-country comparisons. The underlying data cover the period from 2000 onwards2, providing a large level of detail by business sector (17 NACE sections and about 80 NACE divisions) and size class (based on net turnover, allowing the user to select small, medium and large firms) at country level. Data are available in variable and sliding samples.
International accounting harmonisation is not an easy task – the main concern in defining BACH indicators is the minimisation of the differences in accounting practices among countries. For that purpose, an extensive stock-taking exercise covering each national database/accounting item was conducted. In this sense, the BACH database currently represents a significant data harmonisation effort both within and across countries, with a view to minimising differences in accounting practices among countries, minimising gaps/breaks in time series/limitations of national samples, providing complete accounting statements, and fulfilling user needs, while adjusting to the requirements of modern analysis.
BACH data are based on accounting figures, in accordance with national accounting standards, and include a set of indicators related to the balance sheet (22), the income statement (41), the notes on investment behaviour (3) as well as economic
1
NACE is a common statistical classification of economic activities in the European Community. Regulation (EC) No 1893/2006 of the European Parliament and of the Council of 20 December 2006 establishes the statistical classification of economic activities NACE Revision 2, and amends Council Regulation (EEC) No 3037/90 as well as certain EC regulations on specific statistical domains. 2 For some countries, data start in a different year (after 2000).
and financial ratios (29), which have previously been subjected to several tests, in each country and across countries, in order to guarantee the quality of the underlying data.
1
Introduction
The non-financial corporation (NFC) sector3 is the backbone of the European
economy. According to Eurostat, the NFC sector provides by far the biggest share of nominal gross value added in the euro area. In 2013, 58% of nominal gross value added came from the NFC sector, 22% from households, 5% from financial
corporations and 15% from the general government sector 4.
This article aims to describe the particularities and contents of the Bank for the Accounts of Companies Harmonized (BACH) database, noting the main advantages and potentialities of BACH. Reference is made to the national data providers,
samples, sources and accounting practices (Chapter 2):
• The national institutions that provide BACH data collect the data for different
uses (statistics, banking supervision and credit rating). This partially explains differences in coverage rates as well as variations in the level of detail of national samples;
• Some countries have administrative databases that cover the entire population
of non-financial corporations (NFCs). For other countries, subsets of the total population are available, in which large companies are generally
overrepresented. In either case, trends and cross-country comparability are generally reliable;
• Since one of the uses of the data available is cross-country comparison, while
the BACH database was being built the harmonisation of concepts was always a concern. Although the different national accounting standards are based on a single European Accounting Directives package, there is a broad spectrum of national specificities that hamper cross-borders comparability. Substantial harmonisation efforts have been undertaken in recent years; the consistency and robustness of the indicators with regard to national accounting practices have been taken into consideration;
• The database includes a rich set of indicators for the income statement, the
balance sheet, investment behaviour and economic and financial ratios. For all these variables it is possible, by country, to combine both enterprise size and the economic activity sector for a time span larger than a decade;
3 The NFC sector represents one of the economy’s institutional sectors. The institutional sectorisation of economic agents is carried out in accordance with the 2010 European System of National and Regional Accounts (ESA 2010), approved by Council Regulation (EU) No 549/2013 of 21 May 2013. ESA 2010 is a harmonised reference concerning the compilation methodology and deadline release of the national accounts of European Union countries. According to this regulation, sole proprietorships are included in the household institutional sector. See also BACH Userguide, chapter 3.2 – Database contents.
4 Eurostat. Contributions of each institutional sector to macroeconomic developments. See http://ec.europa.eu/eurostat/web/sector-accounts/data/annual-data.
• Together with the database, complementary BACH products and services are available free of charge, allowing the user to gain detailed knowledge of European companies. These currently include “Outlook” booklets and “Yearly Get Insights”.
Chapter 3 explores progress made in some areas that could have potential future impact on BACH aggregates, focusing on the recent revision of the European accounting framework:
• Directive 2012/6/EU of 14 March 2012 on micro-entities offers European Union
Member States the option of creating a specific regulation for these enterprises. Member States are allowed to exempt their micro-undertakings from different obligations, allowing them, for example, to publish a very simplified balance sheet and income statement;
• Similarly, the new Accounting Directive 2013/34/EU of 29 June 2013 diminishes
the administrative burden on small-sized enterprises, at a cost of demanding less accounting information, particularly for smaller companies.
It is worth noting that this chapter also refers to the implementation of the new European System of National and Regional Accounts (ESA 2010).
Chapter 4 provides a summary of a simple case study in the European
manufacturing sector. This is intended to serve as a “use-standard” for a BACH-based analysis and as a reference guide for the user since it highlights some important features of the database. The chapter is not intended to restrict the user’s analysis - there are several other options based on BACH data. The chapter highlights are:
• A BACH database user guide (“Userguide“) is available. This covers the
methodology underpinning the data following a user-friendly approach. It supports the process of observing variables to obtain the extra information needed to compare data;
• For each indicator, the weighted mean, the median as well as dispersion
measures (first and third quartile) are made available, enabling the user to better understand the underlying distribution of the indicator;
• Additionally, absolute values are also available, allowing users to construct their
own indicators, such as the average of a group of countries or sectors;
• Depending on the analysis and on the coverage rate available, in some cases it
2
The BACH database
2.1
The contents of the database
The BACH database is a very powerful and unique tool for evaluating the economic and financial performance of European non-financial corporations, providing sufficient detailed and harmonised aggregated data to make cross-border comparisons.
The information provided is relevant to several users and purposes, including researchers, national central banks and other institutions (for macroeconomic analysis and for supporting decision making), companies, and also to credit and financial institutions (in credit risk analysis). In the words of the European Banking Authority (EBA, 2012) in the Assessment of SME proposal for CRD IV/ CRR: “The BACH database is the most reliable source of available data containing balance sheet and profit and loss data for European companies.”
BACH is a free-of-charge database containing aggregated accounting data from non-financial incorporated enterprises, from, so far, 11 European countries (Austria, Belgium, Czech Republic, France, Germany, Italy, the Netherlands, Poland, Portugal, Slovakia and Spain). Four more European countries will soon be ready to join the BACH database in the coming years (Denmark, Luxembourg, Romania and Turkey). The BACH database is hosted by Banque de France
(http://www.bach.banque-france.fr/?lang=en).
Under the auspices of the European Committee of Central Balance Sheet Data
Offices (ECCBSO)5, the BACH Working Group (WG)6 is responsible for maintaining
and developing the BACH database.
The BACH database allows the economic and financial performance of European non-financial corporations to be evaluated, based on the Nomenclature of Economic Activities (NACE Revision 2), using detailed and harmonised aggregated data to make cross-country comparisons. The underlying data come from the
non-consolidated accounting statements of incorporated enterprises in several European countries, aggregated in each country by business sector and enterprise size. The data cover the period from 2000 onwards7, providing a high level of detail by business sector (17 NACE sections and about 80 NACE divisions) and size class (based on net turnover, allowing the user to select small, medium and large firms) at country level, available in variable and sliding samples.
5
The ECCBSO is an informal body whose members consist of experts either from Central Balance Sheet Data Offices (CBSOs) belonging or associated with the national central banks (NCB) or from national statistical institutes (NSI) of the European Union. More details on the ECCBSO may be found in Annex 5: The ECCBSO.
6 Annex 6 presents information on history of BACH and the BACH WG, including its current composition. 7 For some countries, data start in a different year (after 2000).
The coverage rates in terms of number of firms, net turnover and number of employees are disclosed for each combination (financial year/enterprise size class/business sector/sample), depending on the availability of these data in each country. All indicators are stated in terms of weighted means8 and quartiles (the median as well as the first and third quartiles, which indicate the underlying data distribution). Some absolute values are also provided, which includes the “total assets”, “net turnover”, “gross value added”, “number of firms” and “employees”. Additionally, the “number of firms” used for the quartile calculation is also disclosed. BACH data are based on accounting figures, following national accounting
standards, and include a set of indicators for business analysis relating to the balance sheet (22), the income statement (41), the notes on investment behaviour (3) and economic and financial ratios (29), that have previously been subjected to several tests, in each country and across countries, in order to guarantee quality underlying the data.
The balance sheet indicators are expressed in terms of “total assets”, while the income statement and the indicators for the notes are expressed in terms of “net turnover”. The possibility of determining the values of balance sheet ratios, income statement ratios and items of the notes expressed in weighted means should be considered, once the absolute values for “total assets” and “net turnover” have been obtained.
Furthermore, these indicators are based on a common template, having been harmonised to increase plausible cross-country comparability among BACH aggregates, and also widened because the same classification is used for the size class and business sector (see Annex 1: Overview of the information available in the BACH database).
While building the BACH samples, some countries (e.g. Germany) exclude unlimited liability companies since their inclusion would weaken the comparability of their BACH data with other countries to a significant extent. However, for most countries which include companies with unlimited liability, the proportion of these companies is insignificant (in most cases below 1%).
For other countries (e.g. Portugal) the BACH samples cover the NFC institutional sector, as defined in ESA 2010. Several legal forms for companies coexist in BACH, given that this is not taken into account in the definition (for example, partnerships can exist in BACH). Nevertheless, more than 98% of the companies in the BACH database are limited liability companies. Sole proprietorships are excluded from all national samples.
The following paragraphs present a detailed summary of the database contents:
8
Time span – Data start in 20009. Data for a new year are normally first added to the database in the fourth quarter of the following reference year.
Countries – Austria, Belgium, Czech Republic, France, Germany, Italy, the Netherlands, Poland, Portugal, Slovakia and Spain. Four more European countries will be ready to join the BACH database (Denmark, Luxembourg, Romania and Turkey) in the coming years.
Size class – Classification of enterprises by size is based on the Recommendation
of the European Commission, 6 May 2003 (2003/361/EC); as concerns turnover10,
two major enterprise size classes are considered:
• Large companies (BACH code 2) – turnover higher than EUR 50 million;
• Small and Medium Enterprises (SMEs) (BACH code 1) – turnover lower than
EUR 50 million. SMEs are also split into two details, identified as follows:
• BACH code 1a – Small companies (turnover lower than EUR 10 million);
• BACH code 1b – Medium-sized companies (turnover between EUR 10
million and EUR 50 million).
• In the BACH database it is also possible to obtain information with no
classification for size class, allowing the user to construct several types of total for a specific selected combination.
Variable and sliding samples - Two types of data selection are made available: a variable sample and a sliding sample. For a given year (“year n”), the variable sample includes all enterprises present in the database in that year (using the code “0”), while the sliding sample includes all enterprises that are present in two consecutive years. In this case the sliding sample uses the code "1" to identify the current year ("year n") and the code "-1" to identify the previous year ("year n-1"). For instance, the sliding sample for 2009 includes enterprises present in both 2009 ("year n") and 2008 ("year n-1"), the current and previous years respectively, which allows the same subset of enterprises to be compared over two consecutive years. For 2010 it includes both 2010 ("year n") and 2009 ("year n-1") and so on.
These two samples can produce different results, depending on the real business demography and the contents of the database (see Annex 3), particularly for national samples based on subsets of corporations with a bias in terms of coverage of the population.
Box 1: Variable samples and sliding samples explains these two concepts and Box 2: Variable samples versus sliding samples; a real example for the French Trade
9 For some countries data start in a different year (after 2000).
10 In the definition of enterprise size class, the European Commission takes three variables into account: turnover, number of employees and total assets. The different types of relationships between enterprises are also considered. However, due to limited access to the number of employees and total assets variables, as well as the lack of information about groups of corporations, the enterprise size class in BACH only considers turnover thresholds.
SMEs presents a numerical example. It is important to bear in mind that, for some countries, the variable sample corresponds to the second year of the sliding sample.
Business sector – business sector is based on the Nomenclature of Economic Activities (NACE Revision 2), which includes 17 NACE sections and about 80 NACE divisions.
In general, all sections and divisions of NACE Revision 2 relating to the NFC institutional sector are available in BACH, which completely excludes sections O – Public administration and defence; compulsory social security, T – Activities of households as employers; undifferentiated goods and services-producing activities of households for own use and U – Activities of extraterritorial organisations and bodies. It is worth highlighting the treatment of holding companies and head offices of the NFC sector in BACH:
(i) In the case of NACE K – Financial and insurance activities, data are only
provided for the group NACE K642 – Activities of holding companies (in this case, no details for the section and division of NACE Revision 2 are provided). (ii) For NACE M – Professional, scientific and technical activities, data are also
provided for the groups NACE M701 – Activities of head offices and NACE M702 – Management consultancy services.
(iii) Data is provided for the NFC total excluding holding companies and head offices: BACH code Z0 – Total NACE without K642; BACH code Zc – Total NACE without K642 and M701.
(iv) For holding companies and head offices (NACE K642 – Activities of holding companies; NACE M701 – Activities of head offices), a limited number of ratios is provided – in particular, those involving turnover are not made available.
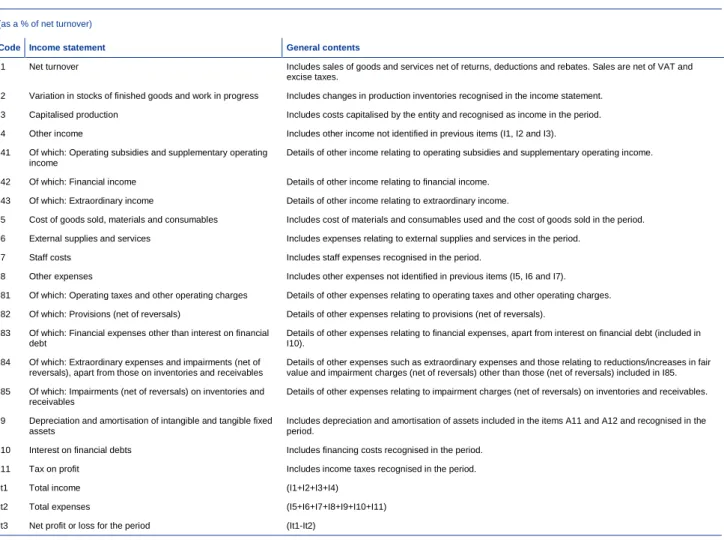
Outputs and statistical measures – 95 indicators are provided, covering balance sheet items (41), income statement items (22), items from the notes (3) and economic and financial ratios (29). BACH data offer a variety of outputs for each combination of financial year/enterprise size class/business sector/sample (variable or sliding):
• Coverage rate: a measure, for a certain indicator value, of the ratio between the enterprises of the sample and the population of non-financial corporations. In other words, the coverage rate indicates the weight of the enterprises of the sample in terms of the population. Coverage rate is calculated in terms of the number of firms, net turnover and number of employees and is disclosed for each combination (financial year/enterprise size class/business sector/sample), depending on the availability of these data for each country;
(b) Total assets, net turnover and the gross value added: reported in thousands of euro.
The possibility of deriving the values of balance sheet ratios, income statement ratios and items of the notes expressed as weighted means should be
considered, once the absolute values for total assets and turnover have been obtained.
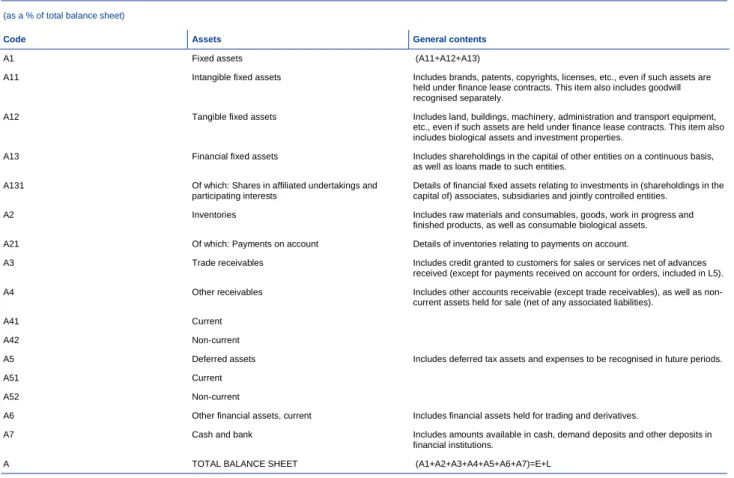
• Balance sheet items (41 indicators): based on a harmonised template and expressed as percentage of total assets;
• Income statement items (22 indicators) and items from the notes (three indicators): based on a harmonised template and expressed as percentage of net turnover;
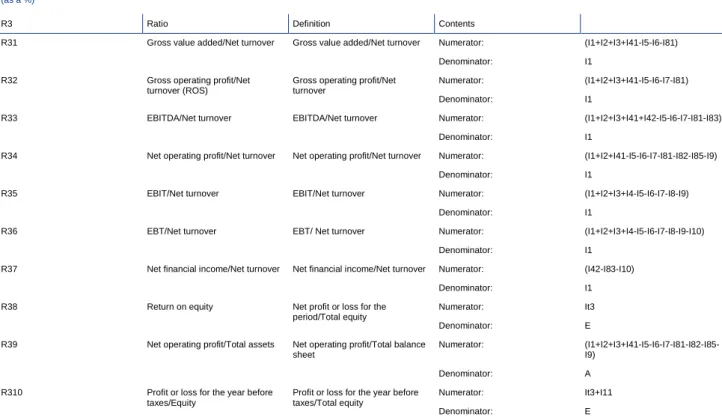
• Economic and financial ratios (29 indicators): separately presented as “Financial structure ratios” (6 indicators), “Financial and debt service ratios” (7 indicators), “Profitability ratios” (10 indicators), “Activity and technical ratios” (2 indicators) and “Working capital ratios” (4 indicators).
• Statistical measures: the following statistical measures are available:
(a) Weighted mean11 (WM);
(b) Quartiles12 (Q1, Q2, Q3);
(c) The number of firms: the number of corporations considered in the calculation of the quartiles is also given for all items.
Uniform templates – The BACH database is based on harmonised templates for; (i) the income statement (Annex 1, Table A1.1), (ii) the balance sheet (Annex 1, Tables A1.2 and A1.3), (iii) economic and financial ratios (six financial structure ratios, seven financial and debt service ratios, ten profitability ratios, two activity and technical ratios and four working capital ratios) (See Annex 1, Tables A1.4, A1.5, A1.6, A1.7 and A1.8) and (iv) three notes (See Annex 1, Table A1.9).
The BACH database is complemented by several documents that can be downloaded from the website.
Calendar - It should be stressed that BACH data are released in accordance with a predefined calendar (Chart 1, Section 2.3.2).
11 Weighted mean is the ratio between the sum of the individual values underlying the concept (numerator) and the sum of the individual values (denominator), taking into account in both cases the sample values in each combination (financial year/enterprise size class/business sector/sample). 12 For each individual ratio, the individual figures for a certain sample are sorted in ascending order. This
sample is then divided into four quarters:
First quartile (Q1): 25% of the enterprises have a ratio below this quartile and 75% have a ratio above; Second quartile or median (Q2): the second quartile is the middle value that cuts the individual observations in half; and,
Userguide - This describes the main contents and characteristics of the BACH database, in particular (i) database contents, (ii) national samples, (iii) methodology and warnings and (iv) release calendar and contacts.
BACH Publications - The following additional products are also currently provided to users:
(a) Outlook booklets: joint studies analysing the relative performance of the European companies making use of the information available in BACH. Three booklets have already been issued:
(i) Outlook #1 (BACH, 2013): “SMEs in European countries”; (ii) Outlook #2 (BACH, 2014): “Financial structure and profitability of
European companies”;
(iii) Outlook #3 (BACH, 2015): “Deleveraging and its effects on the asset
side”13.
(b) Yearly Get Insights: a yearly portfolio of selected economic and financial indicators providing a quick overview of the recent situation of European companies. Additionally, “Get Insights” explores developments in the European business environment and includes specific topics concerning companies.
2.2
The main potentialities and limitations of the database
BACH’s potentialities may be summarised as follows:
Potentiality #1: Increasing knowledge of non-financial corporations
BACH is a free-of-charge database that gathers economic and financial information, allowing users to increase their knowledge of European non-financial corporations and to compare their performances across countries.
Potentiality #2: Harmonised database
BACH data are based on a common template for the most important accounting items available in order to increase, as much as possible, cross-country
comparability.
Potentiality #3: Data richness
The BACH database gives access to a high level of detail, a wide scope and a high degree of disaggregation of all economic and financial information (See 2.1, describing the features and contents of the BACH Database).
Potentiality #4: BACH Userguide
BACH’s user-friendly Userguide can be downloaded from the BACH website. It was designed to provide users with access, as much as possible, to the data available.
The guide includes: (1) database contents; (2) national samples; (3) methodology and warnings; and (4) release calendar and contacts.
Potentiality #5: Other BACH free services
Joint analysis (the “Outlook series”) and yearly portfolios of selected indicators (Get Insights). These provide the vision of the BACH WG on the European NFC sector based on BACH data, as well as a portfolio of didactic tools.
Finally, when using BACH it should be remembered that data come from different CBSOs in differing environments. Countries therefore rely on diverse subsets (which, as a consequence, have differing coverage rates) and varying detail of information.
In this context, some general warnings should be taken into account:
General warning #1: Heterogeneous samples
National data samples are not completely harmonised, in particular due to differences in the exhaustiveness and representativeness of the relevant NFC population.
Major caution should be exercised regarding national samples based on subsets of corporations. In these countries, the composition of a sample may change every year and the compilation of time series can raise problems from an analyst’s point of view. The year-on-year trend does not necessarily reflect economic phenomena, but may instead be a consequence of a change in the composition of the sample – “sample composition bias”. On the other hand, some company segments may not be that well represented in the samples, as in the case of micro-enterprises.
General warning #2: State of play of data update
BACH data providers normally release information for the same year in two stages: (i) data are usually first provided during the fourth quarter of the following year, albeit
with less coverage - provisional data and (ii) a second release normally takes place
during the first half of the year following that, when more definite data are provided -
final data.
General warning #3: National deviations from the BACH concepts
National data are not completely aligned with the concepts in the BACH templates. In particular, differences in national accounting practices cannot be completely eliminated.
Box 1
Variable samples and sliding samples
As already mentioned, the BACH database provides, for each country and business
sector/enterprise size class, two types of dataset using either a variable sample or a sliding sample. The main difference between the two consists of the following: a sliding sample is based on data from a subgroup of enterprises from the annual database for two consecutive years, while the variable sample does not include this restriction.
The data selection for a sliding sample is always based on the enterprise classification of “year n”. This means that new corporations (formed during “year n”) are not represented or, if applicable, the
corporations that were first covered by the surveys launched in this “year n” are ignored in the statistics. Either condition could lead to an overestimation or an underestimation of the variables. It should be borne in mind that the statistics produced for the same corporations in two consecutive years (“year n” and “year n-1”) reflect, first and foremost, the structures of the samples.
The following scheme explains the difference between the two types of samples available in the BACH database:
Chart A
A sliding sample includes the same set of firms over two consecutive years (“year n” and “year n-1”). Thus, from the example above, for a given country/sector/enterprise size, three records are available just for the year 2009:
(i) “Sample 0”: the variable sample for 2009 includes all the companies whose annual accounts are available in 2009 (750 units);
(ii) “Sample 1”: the sliding sample for 2008-2009 contains the companies whose annual accounts are available in both 2008 and 2009 (500 units);
(iii) “Sample -1”: the sliding sample for 2009-2010 contains the companies whose annual accounts are available in both 2009 and 2010 (600 units).
Source: BACH Userguide (2015)
Year Sample Number of
companies Turnover (M€) 2008 S L ID IN G -1 500 80 2009 1 500 78 2009 V AR IAB L E 0 750 95 2009 S L ID IN G -1 600 83 2010 1 600 86 600 companies 500 companies 750 companies 2009 2009 2009 2008 2010
Box 2
Variable samples versus sliding samples; a real example for French trade SMEs
This box seeks to describe the importance of the two samples available in the BACH database: sliding and variable samples. For that purpose a selected analysis is used for the ratio “interest on financial debt over EBITDA” (Earnings before interest, tax, depreciation and amortisation) - French SMEs (trade sector) from 2000 to 2012.
Both datasets, variable samples and sliding samples, reflect a decreasing trend for this ratio in the period from 2000 to 2012 (Chart A).
Chart A
Trade sector interest on financial debt over EBITDA | French SMEs (2000-2012)
Source: Bank for the Accounts of Companies Harmonized (April 2015), http://www.bach.banque-france.fr/?lang=en.
Notes: (1) Enterprise size 1 – SMEs, sample 0 – Variable samples and sample -1 and 1 – Sliding samples and 1/R22 – Interest on financial debt over EBITDA.
However, analysis focused on the specific years 2001 and 2007 may produce opposite results, with variable samples showing a decrease, sliding samples showing an increase.
The truth is that both conclusions are complementary; their justification relies on differing sample composition:
(a) Variable sample: incorporates the demography of the sample. This means that a change in the variable under analysis may be due to firms’ exits or entries into the market or into the sample. When the BACH sample coincides with the population, the demography reflected in the variable sample corresponds to the natural movement of firms in one economy. However, when the BACH sample is a subset of the population, the demography is much more that of the BACH sample than that of the population. Thus, in the case of the French SMEs shown in Chart A, the “artificial” change based on variable samples is merely because a company has entered/left the sample. In general, samples based on a subset of the NFC population are more affected by these “artificial” changes.
(b) Sliding sample: considers the same set of companies in a pair of two consecutive years. Hence, when the BACH sample is a subset of the NFC population, two-year trends are
represented more accurately. However, if the BACH sample coincides with the NFC population,
14 16 18 20 22 24 2000 2001 2002 2003 2004 2005 2006 2007 2008 2009 2010 2011 2012 Variable sample Sliding sample
the demography dynamics of the NFC are not captured. For economic trend analysis for two consecutive years and cross-country comparability, sliding samples could be more appropriate. In this sense, the two samples available – variable and sliding – should be seen as important
complements for different analysis.
2.3
Data providers, samples, sources and accounting
practices
The underlying data in BACH comes from different national data providers, almost all belonging to central banks. National samples and accounting practices have specific features that bear consideration. These issues are presented as follow:
2.3.1. Data providers; 2.3.2. Samples and sources; 2.3.3. Accounting practices.
2.3.1
National data providers
The main source of diversity in BACH comes from the institutional context of CBSOs, which is very closely related to the nature and purpose of their activities (Table 1). Although the overwhelming majority of CBSOs work for NCBs, their missions are dissimilar. In seven countries the main purpose of data collection is the production of statistics, although in one case (Slovakia) risk assessment is another aim. In
Belgium, for example, the CBSO plays the role of commercial register in the collection of annual accounts. The major concern of the remaining CBSOs is the scrutiny of the business cycle, risk assessment of bank portfolios and/or supervisory obligations.
Depending on the purpose and the specific situation of each CBSO, different methods of collecting information from companies are in place. As a consequence, different coverage/scope/detail is available in BACH national samples.
Table 1
Main features of national data providers
Country Institution Department Main objective of data collection
Austria National Central Bank Statistics Risk assessment, rating Belgium National Central Bank Microeconomic info. Publication of microdata Czech Rep. National Central Bank Monetary & Statistics Statistics
France National Central Bank Corporate Risk assessment, rating
Germany National Central Bank Statistics Statistics
Italy14 Private company - Risk assessment, rating
Netherlands National Statistical Institute Statistics Statistics
Poland National Central Bank Statistics Statistics
Portugal National Central Bank Statistics Statistics
Slovakia National Central Bank Statistics Statistics, risk assessment
Spain National Central Bank Statistics Statistics
Note: National Statistical Institutes for future data providers (Denmark, Luxembourg, Romania and Turkey).
CBSOs’ frameworks may account for more diversity in BACH in the near future, as it is expected that national statistical institutes (NSI) will compile data for BACH (in the case of Denmark, Luxembourg, Romania and Turkey). NSIs are typically related to the statistical function, although in a different institutional context.
2.3.2
National samples and sources
National data samples in BACH differ in terms of: (i) representativeness of the NFC population, (ii) provisional/final data and (iii) breaks in time series.
Generally speaking there are two types of national database. Administrative databases (Belgium and Portugal, since 2006) cover the entire population of NFCs, while the remainder is based on a subset of the population. Accordingly, Belgium and Portugal (since 2006) have very high NFC coverage rates in BACH. In accordance with the law, these two countries have full access to the financial statements of the entire population of non-financial corporations.
Data providers from the other remaining countries collect NFC information from a subset of the population. In these cases large firms are often overrepresented. Furthermore, data availability in different countries depends on the state of transposition of the European Union Accounting Directive concerning the official publication of the annual accounts of limited liability companies.
Table 2 shows that countries other than Belgium and Portugal present lower coverage rates in terms of number of companies in 2012, compared with that for turnover/number of employees covered. For instance, while covering 28% of companies, the coverage rate for French samples in 2012 rises to 81% in terms of turnover.
14 The private company referred to in Table 1, Cerved Group Spa, develops statistical models for Italian banks. Together with Banca d’Italia, this company offers data for Italian companies to the BACH database.
Table 2
National samples
Country Coverage rate – number of enterprises Coverage rate – turnover (T) or number of employees (E) Provisional figures (2013) Final figures (2012) Provisional figures (2013) Final figures (2012)
Austria 14.1% 45.4% - -
Belgium* 99.6% 99.0% 99.7% (E) 99.4% (E)
Czech Rep* 9.8% 10.2% - -
France 26.9% 28.4% 81.5% (T) 81.3% (T)
Germany N/A 8.6% N/A 69.9% (T)
Italy* 6.4% 7.4% 75.4% (T) 76.5% (T)
Netherlands 69.0% 69.0% N/A N/A
Poland* 3.0% 3.0% 56.0% (E) 56.0% (E)
Portugal 94.1% 95.8% 96.5% (T) 97.7% (T)
Slovakia N/A 63.7% N/A 80% (T)
Spain 12.3% 37.1% 34.8% (E) 62.1% (E)
* For these countries 2013 data are final figures.
Notes: (1) Coverage rates for Poland are approximated since this country does not have coverage rates available by business sector. Note that in Poland data is exhaustive in the case of companies with more than nine employees that deliver full balance sheet statements. (2) Coverage rate figures are not provided in a single format (turnover or number of employees) because only part of this information is available in the different countries.
Note that almost all countries provide data in two different stages. In the first phase, data are released as leading indicators, but with a provisional character. At a later stage, the data is updated to be more definitive/final. More details on the release calendar for the BACH data are available in Chart 1.
Chart 1
BACH data release calendar (data of reference date December n)
Source: BACH Userguide (2015).
In general, provisional data have lower coverage when compared with final data (the difference can be substantial). For instance, in the case of Austria, according to the last update, 2012 final data have a coverage rate of 45% in terms of number of corporations, which compares with 14% for the 2013 provisional data.
SK PT PL AT NL IT FR ES DE CZ BE provisional final De c n De c n +1 De c n +2 Ju n n +1 Ju n n +2 Ju n n +3
Table 3
Structure of the samples (structure of the populations in brackets) (%, 2012/2013)
Country Manufacturing Electricity, gas Construction Trade Transport
Austria (C) 2013 8 (16) 1 (2) 11 (16) 23 (23) 4 (4)
Belgium (E) 2013* 24 (24) 1 (1) 10 (10) 21 (22) 10 (10)
Czech Rep. (C) 2013* 25 (N/A) 3 (N/A) 7 (N/A) 16 (N/A) 3 (N/A)
France (E) 2013 24 (21) 2 (1) 9 (9) 22 (21) 9 (9)
Germany (T) 2012 41 (38) 18 (12) 2 (3) 22 (26) 4 (4)
Italy (T) 2013* 39 (36) 9 (8) 3 (5) 30 (30) 5 (5)
Netherlands (T) 2013 7 (7) 0 (0) 9 (8) 23 (20) 3 (3)
Poland (C) 2013* 27 (N/A) 1 (N/A) 10 (13) 30 (28) 6 (8)
Portugal (T) 2013 26 (26) 6 (6) 6 (6) 37 (37) 6 (6)
Slovakia (T) 2012 33 (N/A) 4 (N/A) 6 (N/A) 30 (N/A) 5 (N/A)
Spain (E) 2012 19 (19) 1 (0) 8 (9) 23 (23) 7 (6)
* For these countries 2013 data are final figures.
Notes: (1) C – weight of the sector in terms of the number of corporations, E – weight of the sector in terms of the number of employees, T – weight of the sector in terms of turnover, N/A – information not available. (2) Additional detail on other business sectors may be found in the BACH Userguide – National samples chapter (only in the Excel version).
Despite differing underlying samples, the sectoral composition of national samples included in BACH is, to some extent, in line with the structure of the population of NFCs in these countries (Table 3). For example, in Spain almost half the number of employees of the non-financial sector in 2012 was concentrated in the manufacturing and trade sectors, 19% and 23% respectively. For the same country, and for the same year, the composition of the BACH sample by business sector reflects the population of Spanish companies, where the manufacturing and trade sample sectors were also the most important business sectors.
Table 4
Main features of underlying national databases
Country Data source Breaks and biases in sample time span
Austria Multiple sources No break in time series. Overrepresentation of holding companies, head offices and real estate firms
Belgium Administrative data Almost full coverage of all corporate sizes and business sectors. No break or bias in time series (since 2000)
Czech Rep. Statistical survey & Administrative data
No break or bias in time series (since 2005)
France Administrative data & Tax returns
No break in time series. Very high coverage rate for firms with annual turnover of more than EUR 750,000
Germany Multiple sources No break in time series. Sample bias towards large companies Italy Multiple sources No break in time series. Bias towards large companies
Netherlands Administrative data Statistics Netherlands will deliver only non-consolidated data for the period 2008-2011. Non-consolidated in this sense means that individual tax payers only report for themselves (1:1) or that individual tax payers report for themselves and one other company (1:2). The basis for the BACH data is the database of the tax authorities (corporation tax)
Poland Statistical survey Sample includes only companies with more than nine employees and that deliver full balance sheet statements. The sample covers about 70% of enterprises in this segment. Data according to NACE Rev.2 have been available since 2005
Portugal Administrative data A statistical survey used for collecting data before 2006. For that period, there was a bias towards large companies
Slovakia Administrative data No break in time series. Sample bias due to changes in class structures between years Spain Multiple sources Minor breaks due to changes to the Spanish GAAP (2008)
Notes: (1) NACE is the Statistical Classification of the Economic Activities in the European Union enforced by law in all Member States. For more information on this topic, consult the Eurostat Manual available at
http://epp.eurostat.ec.europa.eu/cache/ITY_OFFPUB/KS-RA-07-015/EN/KS-RA-07-015-EN.PDF. (2) GAAP is the acronym for Generally Accepted Accounting Principles, referring to the national financial accounting system.
It should be emphasised that data sources and methods of collecting data may change over time. In addition, changes to accounting nomenclature and business sector classification may be made occasionally. These factors may cause some breaks and/or biases in time series. Table 4 shows the situation in BACH concerning
data source and breaks and biases over time15.
Finally, it should be stressed there are specificities in national practices regarding sampling methods used for statistical outputs. Annex 3: National Sampling Methods provides more information on the specific practices adopted for each country.
2.3.3
National accounting practices
The BACH database is the result of a substantial effort of data harmonisation both within and across countries with a view to:
(a) Minimising differences in accounting practices among countries and gaps/breaks in time series/limitations of national samples;
(b) Providing complete accounting statements;
(c) Meeting user needs while adjusting to the requirements of modern analysis.
Table 5
National accounting specificities
Country Accounting standards
IFRS compliance
Austria National GAAP Legislation on GAAP has considerably restricted the implementation of IFRS in individual financial statements in recent years
Belgium National GAAP No IFRS compliance. Possible but limited in the future Czech Rep. National GAAP No IFRS compliance. Possible but limited in the future
France National GAAP Progressive endorsement of IFRS through a selective approach. National rules evolved in 2005 with the partial adoption of the following rules: IAS 2, IAS 8, IAS11, IAS 16, IAS 23, IAS 34, IAS 36, IAS 37 and IAS 38
Germany National GAAP There are distinct differences between Germany GAAP and IFRS. The reform of the German Commercial Code in 2010 (BilMoG) only partially reduced the differences
Italy National GAAP & IFRS
IFRS for listed companies
Netherlands National GAAP & IFRS
At the moment not compulsory. However, listed companies need to apply IFRS
Poland National GAAP There are significant differences between Polish statements and IFRS items Portugal National GAAP The most recent GAAP (data since 2009) are very close to IFRS Slovakia National GAAP
& IFRS
The most recent national GAAP are very close to IRFS
Spain National GAAP From 2000-2007 close to IFRS. Since 2008 in line with IFRS Note: IAS is the acronym for International Accounting Standard, created by the predecessor of the IASB.
As can be seen in Table 5, national BACH data are compiled according to the Generally Accepted Accounting Principles (GAAP) in force in each country. Although national GAAPs have the Fourth Council Directive (Directive 78/660/EEC of 25 July
concern for cross-country comparability in BACH. These non-convergent specificities are caused by differing cultural and economic backgrounds and non-aligned tax systems.
Following the globalisation of business there has been a gradual and slow process of
adjustment to the International Financial Reporting Standards16 (IFRS). However,
convergence is not yet complete and, in some countries, might not happen in the foreseeable future.
The definition of each individual item (the variables), inspired by the IFRS, has provided a benchmark for evaluating the degree of comparability among countries reporting to BACH. It has helped BACH data providers to seek common definitions and limit deviations. Final templates obtained at the end of this exercise reflect: (a) a reduction in differences among country specificities, improving comparability; (b) a minimisation of gaps/breaks in time series and limitations at national sample
level.
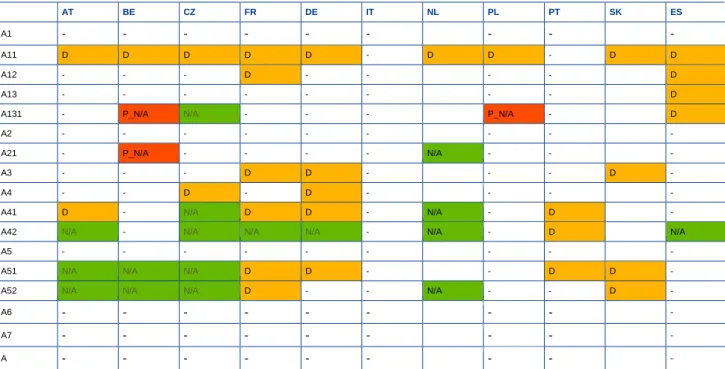
Despite these efforts, some national deviations remain in the BACH database and have been identified and documented. Deviations are presented by
country/accounting item. For this purpose, a deviation arises when national data are not completely aligned with the “first best” definition (Annex 2: National Deviations provides additional details). At this level, four types of alert are made available for each country/variable:
1. Code “I”: national content has some important specificity/practice;
2. Code “D”: national content departs from the predefined BACH “first best”
definition;
3. Code “N/A”: national content is not available;
4. Code “P_N/A”: national content is only partially available.
When creating harmonised templates, attention was also paid to the level of detail required to ensure that major accounting items of information were not incomplete. BACH therefore provides a complete picture of the balance sheet and the income statement.
Based on the items defined for the balance sheet and for the income statement, the last stage of the process of harmonisation was the creation of a set of standard economic and financial ratios. These indicators are intended to help users improve their analysis of the performance of European companies. In this regard, BACH ratios follow, as much as possible, current trends from the viewpoint of business analysts and researchers.
16 IFRS refers to international accounting rules developed by the International Accounting Standards Board (IASB). For additional information on this topic consult the IFRS Foundation website available at http://www.ifrs.org/.
Finally, it should be noted that the BACH Userguide (only the Excel version) also provides transition tables for the national templates used in the data collection process and the BACH harmonised templates.
3
Recent developments and their future
impact on BACH
This section focuses on the revision of the European Union Accounting Directive, which will most probably impact BACH. Moreover, the European System of National and Regional Accounts (ESA2010) has been implemented in most EU countries, implying that some countries will revise their BACH data. The implementation of ESA 2010 implies a change in the classification of the institutional sector, affecting holding companies.
3.1
Revision of the European Union accounting directives
On 26 June 2013, the European Parliament and the Council adopted “Directive
2013/34/EU on the annual financial statements, consolidated financial statements and related reports of certain types of undertakings”17. Box 3: Transposition of the new Accounting Directive sums up the national transposition of this Directive into national legislation of countries belonging to BACH.
Accordingly, Member States must transpose Directive 2013/34/EU into their national laws and regulations by 20 July 2015. Member States may act to ensure that the new provisions are first applied to financial years beginning on 1 January 2016 or during the calendar year 2016.
On the basis of Article 3 of Directive 2013/34/EU, Member States will define a new classification by size (Table 6), taking into account undertakings that on their balance sheet dates do not exceed the limits of at least two of the following three criteria (in the case of small undertakings the figures may be extended up to the maximum shown in brackets).
Table 6
New size classification according to Directive 2013/34/EU
Size Classification
Balance sheet total (in thousand euro)
Net turnover (in thousand euro)
Average number of employees during the financial year Micro-undertakings 350 700 10 Small undertakings 4 000 (6 000) 8 000 (12 000) 50 Medium-sized undertakings 20 000 40 000 250
Large undertakings Undertakings which on their balance sheet dates exceed at least two of the three criteria defined for medium-sized undertakings
17 This new Accounting Directive amends Directive 2006/43/EC on statutory audits of annual accounts and consolidated accounts; repeals Directive 78/660/EEC, the so-called “Fourth Council Directive on the annual accounts of certain types of companies” and Directive 83/349/EEC, the so-called “Seven Council Directive on consolidated accounts”; and faithfully incorporates the provisions of Directive 2012/6/EU on accounting requirements for micro-entities.
For its current definition, classification by size is based on Recommendation 2003/361/EC, which takes three variables into account (similarly to Directive 2013/34/UE): turnover, number of employees and total assets. However, as for the previous definition, due to limited access to the number of employees and total assets variables, the enterprise size class in BACH only considers turnover thresholds. The following classification by size is applied in accordance with Recommendation 2003/361/EC:
• SMEs, if turnover is lower than EUR 50 million (which compares to EUR 40
million in the new Directive18). SMEs are also split into two categories, identified as follows:
• Small companies, if turnover is lower than EUR 10 million (which
compares to EUR 8 million (or EUR 12 million) in the new Directive);
• Medium-size companies, if turnover is between EUR 10 million and EUR
50 million (which compares to figures between EUR 8 million (or EUR 12 million) and EUR 40 million in the new Directive).
• Large companies, if turnover is higher than EUR 50 million (which compares to
companies with turnover higher than EUR 40 million in the new Directive). It is important to note that, under this classification, the Directive only intends to propose the financial information obligation that Member States are required to meet (or are exempted from) – the information is not for statistical purposes.
The main objective of Directive 2013/34/EU is to reduce the administrative burden on small companies and to meet the needs of users and those who prepare annual accounts. The “Think Small First” approach of this Directive should “enable companies to prepare profit and loss accounts, balance sheets and notes that are more proportionate to their size and to the information needs of the users of their financial statements”.
The number of companies benefiting from these simplifications should grow since more companies will be classified in the small category for accounting purposes than is currently the case, thanks to the increase of the turnover and balance sheet thresholds used to define small companies, and to the obligation to apply the size criteria on an individual, rather than consolidated, basis, when companies are part of a group. In the case of Belgium, for instance, nearly 60% of non-financial companies currently considered large will be considered small in the framework of the new Directive.
The new Directive also aims, to a certain extent, to improve the quality and the comparability of the information disclosed. However, the new Accounting Directive offers national legislators many different options for widening the scope for differences among European countries, specifically for small companies.
When comparing the provisions of the new Accounting Directive with those of the Fourth and Seventh Directives, the major changes concern the requirements regarding the statutory accounts of small companies.
Very limited changes are imposed, as such, by the Directive:
(a) Items of exceptional size or incidence must be disclosed in the notes instead of in the profit and loss account;
(b) Member States may not require, in the notes for the small undertakings, more than that which is compulsory or permitted.
The major changes will probably stem from the way different Member States will
transpose the Directive into their national laws and regulations and will use the different options offered by the Directive, particularly:
(a) The creation or otherwise of a micro-undertakings category;
(b) The application or otherwise of the different possible simplifications and exemptions proposed for micro-undertakings (a drastically reduced balance sheet and profit and loss account, exemption from drawing up notes, filing only the balance sheet instead of publishing the financial statements, …);
(c) The application or otherwise of the different possible simplifications and exemptions for small companies: drawing up an abridged balance sheet and profit and loss account, exemption from preparing a management report, exemption from publishing the profit and loss account and management report, the requirement of additional optional information in the notes (e.g. information on the fixed assets, transactions with related parties).
The creation of specific national regulations for micro-companies could possibly give rise to:
(a) A major loss of financial information for a huge number of companies, essential for micro and macroeconomic analysis and for statistical purposes;
(b) A distortion of competition among micro-undertakings of different countries operating in international markets.
In conclusion, the scope for differences among European countries, including those participating in BACH, will continue to be a challenge, given the wide range of possibilities available.
Box 3
Transposition of the new Accounting Directive
In terms of national transposition, as far as the BACH WG is aware, only Germany and France have partially or fully transposed this Directive. In Germany, nearly all the exemptions have been applied and the balance sheet and income statement have been simplified almost to the minimum required. In France, micro-companies are exempt from the obligation to complete the notes and may choose
not to publish their annual accounts, their data only being accessible by public administrations. These new provisions are to be applied for the first time to annual accounts closing on 31 December 2013 and filled from April 2014 onwards.
Portugal has, to some extent, already transposed the Directive through the implementation of specific legislation for micro-entities in 2010. This national legislation uses thresholds other than those recommended by the Directive (EUR 500,000 for the turnover and balance sheet total and five FTEs for the number of employees) and introduces a more abridged balance sheet and income statement compared with that for other NFCs. Austria has not transposed the Directive, but
accounting and disclosure rules have already been simplified for small and medium-sized enterprises in a number of areas.
In Poland a project is under discussion, focusing mainly on the simplification of the balance sheet and income statement and a wide usage of the proposed exemptions.
No transposition or project to do so has been reported for the other participating countries. Some of these, in particular Belgium, Denmark and Luxembourg, have decided that they will take a position on this issue when preparing the transposition of the new Accounting Directive.
3.2
Implementation of ESA 2010 – The case of holding
companies
By October 2014, ESA 2010 had been implemented in EU member countries. One of the significant changes introduced by ESA 2010 that will most probably impact the BACH database is that relating to the composition of the institutional sector of NFCs. Basically, some entities such as holding companies and special purpose entities (SPEs) will be reclassified into the financial sector (S.127. Captive financial
institutions). As an example, ESA 2010 emphasises the distinction between holding companies, that do not undertake any management activities and should therefore be classified as financial corporations (S.12), and head offices. The latter exercise managerial control over their subsidiaries and should be allocated to the dominant NFC sector of their subsidiaries.
Up to now, only corporations belonging to the NFC institutional sector have been covered in the BACH database. The new sectorisation of holding companies in ESA 2010 may have implications and consequences for BACH because these
corporations no longer belong to the NFC institutional sector. However, the main BACH aggregates affected can already be identified, namely: NACE codes K642 – Activities of holding companies, M701 – Activities of head offices and BACH aggregates Z0 – Total NACE including M701, but excluding K642.
Although holding companies are identified separately in the BACH database, for any possible future adjustment the degree of that impact will not be uniform among
will largely depend on the criteria adopted by each country. The BACH WG has been following the issue relating to the reclassification of HCs and HOs and, on the basis of questionnaires sent to BACH members, it can be concluded that, in terms of number of enterprises, according to the results for the BACH sample, the most affected countries could potentially be FR, PT and CZ. In terms of total assets, the most affected countries could be FR, PT, CZ, PL and ES. For the other countries, the impact of the reclassification is likely to be small.
4
Case study: the manufacturing sector
This chapter presents a simple case study of a BACH sector-based analysis. For this purpose, the manufacturing sector was chosen. The analysis does not pretend to be exhaustive; it intends, instead, to serve two simultaneous objectives:
(i) To illustrate how rich the database is;
(ii) To identify the main challenges arising in country comparability, while presenting appropriate solutions to mitigate these.
The European comparison is made for the year 2013, with the exception of Slovakia (final figures for 2012), and is based on data extracted, in April 2015, from the BACH database. According to the release calendar of the BACH Userguide, not all
countries had reported final data for 2013. In this sense, data for some countries may be of a preliminary nature.
Note #1: BACH preliminary data
It is important to consult the release calendar in the BACH Userguide to ascertain the degree of completion of national data. Preliminary data normally have lower coverage rates.
The comparison was conducted for the 11 European economies with available data in the BACH database: Austria, Belgium, Czech Republic, France, Germany, Italy, the Netherlands, Poland, Portugal, Slovakia and Spain.
4.1
The sector and its representativity in BACH
The BACH database provides aggregated data at the level of 17 NACE sections and about 80 NACE divisions. There are, therefore, data for 24 divisions for the
manufacturing sector.
For 2012/2013, the manufacturing sector is relatively well covered by the different country samples in BACH, with coverage rates of above 50%, either in terms of
turnover or number of employees (Table 7), except for Spain.19 These levels of
representativeness allow the global trend of the manufacturing sector to be captured, although some national samples are biased towards large companies. For instance, the provisional data indicate that in Germany 9% of manufacturing sector companies represent 62% of the corresponding turnover.
Table 7
National samples of the manufacturing sector (2012/2013*)
Country Coverage No. NFCs (C)
Coverage
Turnover (T)/No. employees (E)
Weight of the sector in the sample
Weight of the sector in the population
Austria (2013) 27% - 8% (C) 16% (C)
Belgium (2013)* 100% 100% (E) 24% (E) 24% (E)
Czech Rep. (2013)* 18% - 25% (C) N/A
France (2013) 47% 87% (E) 24% (E) 21% (E)
Germany (2013) 9% 62% (T) 41% (T) 38% (T) Italy (2013)* 14% 82% (T) 39% (T) 36% (T) Netherlands (2013) 69% - 9% (C) 9% (C) Poland (2013)* - - - - Portugal (2013) 94% 97% (T) 26% (T) 26% (T) Slovakia (2012) 66% - 33% (T) N/A
Spain (2013) 18% 33% (E) 19% (E) 19% (E)
* For these countries 2013 relates to final figures.
Source: Bank for the Accounts of Companies Harmonized (April 2015), http://www.bach.banque-france.fr/?lang=en. Notes: (1) Information for business sector section C, enterprise size 0 – All sizes and sample 0 – variable samples. (2) With the exception of Poland, in every data extraction all items are accompanied by coverage rate measurements. (3) The Excel version of the BACH Userguide (Chapter 2 – National Samples) gathers information for both the structures of the NFC population and NFC sample by country and business sector/enterprise size.
Note #2: International comparisons
There is a diversity of national specificities in BACH samples, the most important being the coverage of the NFC population. Although cross-country comparisons for global aggregates are appropriate, some caution is required for specific segments of corporations. Micro-enterprises, for example, are better captured in full coverage national samples than in partial coverage national samples.
As previously mentioned, the BACH database has one important distinctive feature: the structure of national samples is, to some extent, in line with the structure of the population of NFCs in each country. For instance, in France, in 2013, the
manufacturing sector in BACH represents 24% of the number of employees of the total BACH sample, while in the NFC population the weight of this sector is 21%.
4.2
The Importance and structure of the sector
The manufacturing sector constitutes one of the most important sectors in the European economy. In the BACH sample (BACH average), this sector accounts for 34% of NFC turnover (Chart 2).
Chart 2
Non-financial corporations’ turnover by business sector – BACH average (2012/2013 in percentage)*
Source: Bank for the Accounts of Companies Harmonized (April 2015), http://www.bach.banque-france.fr/?lang=en.
* For Belgium, Czech Republic, Italy and Poland, data relate to final figures for 2013. For the remaining countries, data relate to provisional figures, except for Slovakia (final figures for 2012).
Notes: (1) Enterprise size 0 – All sizes and sample 0 – Variable samples. (2) Sample structures obtained from the absolute values. (3) For the purpose of this article, NACE Revision 2 sections were aggregated as follows: Agriculture and fisheries (NACE A), Mining and quarrying (NACE B), Manufacturing (NACE C), Electricity and water (NACE D and E), Construction (NACE F), Trade (NACE G) and Other services (NACE H, I, J, L, Mc, N, P, Q, R, S). (4) The BACH average comprises the weighted mean for the European countries available in the BACH database.
The analysis above makes implicit - BACH average20 - the possibility to build additional aggregates from BACH data. The aggregate above corresponds to the ratio between the net turnover (absolute values) obtained for each business sector, identified in terms of sections of NACE (numerator) and the sum of the net turnover (absolute values) for all business sectors selected (denominator), taking into account in both cases the combination chosen (financial year/enterprise size class/sample). The results were made available for all BACH countries. For the purpose of this aggregate, the absolute value of turnover was used. Nevertheless, using a similar methodology, new variables can be also built.
Note #3: New aggregates/new variables
The provision of absolute values allows complementary standardised analysis in BACH, through building new indicators by combining made-available indicators in a different way.
0.0 5.0 10.0 15.0 20.0 25.0 30.0 35.0
Agriculture and fisheries Mining and quarrying Construction Electricity and water Other services Trade Manufacturing
When disaggregated by business sector (Chart 3), NACE 29 – Manufacture of motor vehicles, trailers and semi-trailers accounts for the highest share of
European manufacturing sector gross value added (18%), followed by NACE 10 – Manufacture of food products (11%).
More than half (56%) of the European manufacturing sector gross value added is concentrated in six (out of 24) sectors of economic activity.
The above analysis is similar to the previous analysis which used the net turnover for each business sector, identified in terms of sections of NACE. However, the data in Chart 3 take gross value added into
consideration as well as each of the divisions specifically relating to the manufacturing sector (one section of NACE).
Note #4: Granular data
Information in BACH is provided with a reasonably significant level of detail in terms of business sectors and enterprise size classes. This level of detail allows several analyses to be conducted.
4.3
An assessment of the economic and financial situation of
the sector
When the performance of the manufacturing sector was compared across European countries, it was revealed that Netherlands and Belgium performed best, on average,
in 2012/2013* at the level of EBITDA (Earnings before interest, tax, depreciation
and amortisation) on net turnover (14% and 10% respectively, Chart 4). According to the same indicator, the French manufacturing sector generated less revenue per euro of turnover (7%).
The above analysis is based on the weighted mean of EBITDA divided by net turnover. However, an analysis of the different quartiles of the underlying distribution
provides a more complete picture. For example, Chart 4 shows that the high
Chart 3
Manufacturing sector gross value added (Total countries, BACH average (2012/2013)*)
By business sector
* For Belgium, Czech Republic, Italy and Poland, data relate to final figures for 2013. For the remaining countries, data relate to provisional figures, except for Slovakia (final figures for 2012).
Source: Bank for the Accounts of Companies Harmonized (April 2015),
http://www.bach.banque-france.fr/?lang=en.
Notes: (1) Enterprise size 0 – All sizes, 0 – Variable samples. (2) Sample structures obtained from the absolute values. (3) BACH average comprises the weighted mean for the European countries available in the BACH database. (4) NACE C10 – Manufacture of food products, NACE C20 – Manufacture of chemicals and chemical products, NACE C25 – Manufacture of fabricated metal products, except for machinery and equipment, NACE C26 – Manufacture of computer, electronic and optical products, NACE C28 – Manufacture of machinery and equipment n.e.c. and NACE C29 – Manufacture of motor vehicles, trailers and semi-trailers.
C29 18% C10 11% C20 9% C28 8% C19 7% C24 6% C25 5% C26 5% C21, 4% C22, 4% C27, 4% C23, 3% C30, 3% C11, 2% C17, 2% C13, 1% C14, 1% C15, 1% C16, 1% C18, 1% C31, 1% C32, 1% C33, 1% Other 30%