UK Budget: good politics, bad economics?
The UK government claimed that the fiscalconsolidation plan will be tough and they certainly did not disappoint. The government plans to reduce its structural budget deficit by 8% of GDP over the next five years. From a political point of view, the new coalition scores well given that they blamed most of the austerity measures on Labour’s profligacy and decided to carry them out when their approval ratings is still high. But we are not sure whether such rapid and severe consolidation plan makes economic sense. There are certainly some reasons for optimism as the private sector can spend more in the
anticipation of lower taxes in the future. Whats’ more, bond investors might ask lower risk premiums to hold on to British government debt. But we should remember that the credit-constrained private sector is still busy repairing its balance sheet and interest rates cannot fall much more. The uncertainty surrounding the economic recovery, therefore, implies that the government should come up with a plan B if the situation turns for the worse.
The contents of the Budget 2010
The long-awaited UK emergency budget finally arrived. And let’s be honest, it is one of the harshest consolidation programmes ever presented by any government. In total, the announced measures build up to a fiscal tightening worth around £40bn per annum over the next five years – about 2% of annual GDP. When added to the tax and spending measures already planned by the previous government, the total discretionary
consolidation will be some £128bn per annum by fiscal year (FY) 2015-16, a whopping 8% of GDP. As a result of these belt-tightening measures, borrowing in FY 2014-15 is now expected to be £37bn (or 2.1% of GDP) compared to the previous prediction of £74bn (or 4% of GDP) by the Labour government. And borrowing is now projected to be a
cumulative £116bn lower in FY 2014-15 than expected in the March Budget. Therefore, net public debt will peak at 70.3% of GDP in FY 2013-14 and fall to 69.4% in FY 2014-15 (see table 1 for a summary).
Table 1: The Budget 2010 at a glance
Variables 2010‐11 2011‐12 2012‐13 2013‐14 2014‐15
GDP growth (% y‐o‐y)
March Budget (Labour) 1.25 3.25 3.5 3.25 3.25 June Budget (Con‐Lib) 1.2 2.3 2.8 2.9 2.7 Net borrowing (% of GDP)
March Budget (Labour) 11.1 8.5 6.8 5.2 4 June Budget (Con‐Lib) 10.1 7.5 5.5 3.5 2.1 Net borrowing (£ billion)
March Budget (Labour) 163 131 110 89 74 June Budget (Con‐Lib) 149 116 89 60 37 Structural deficit (% of GDP)
March Budget (Labour) 7.3 5.3 4.1 3.1 2.5 June Budget (Con‐Lib) 7.4 5 3.4 1.8 0.8 Net debt (% of GDP)
March Budget (Labour) 63.6 69.5 73 74.5 74.9 June Budget (Con‐Lib) 61.9 67.2 69.8 70.3 69.4 Source: HM Treasury
Now the main question is whether the
government made a right decision to carry out serious austerity measures in an emergency budget? To answer this, we will first look at whether it was a right political move until we move to the economics of the programme.
Is Mr. Cameron shooting himself in the foot?
Many commentators believe that fiscal consolidation is the kiss of death for the governments implementing them. Even Mervyn King, the governor of the Bank of England, has claimed according to some rumours that “whoever wins this election will be out of
power for a whole generation because of how tough the fiscal austerity will have to be”.
Surprisingly enough, academics find no empirical evidence that governments carrying out austerity measures are voted out of office. Alesina, Carloni and Lecce (2010) find in their sample of past fiscal consolidation programmes that the number of times the government changed was 13 times while in 26 cases there were no changes (see table 2). The authors argue, therefore, that it is possible for fiscally
responsible governments to engage in large fiscal adjustments and survive politically. But the success was very much dependent on a number of important ingredients – creation of a sense of urgency because of impending crisis, implementation of austerity measures early on after the election and good
communication with the public. Table 2: Political costs of consolidation
Primary balance Number of Number of
adjustment per times government times government
Period year (%GDP) changed did not change
Denmark 82‐86 ‐2.4 0 2 Greece 89‐94 ‐1.9 2 2 Sweden 93‐98 ‐1.5 1 2 Ireland 87‐89 ‐1.3 0 1 Portugal 80‐86 ‐1.0 0 5 Italy 92‐97 ‐1.0 2 3 UK 93‐99 ‐1.1 1 1 Finland 92‐00 ‐1.2 2 1 France 93‐97 ‐0.6 1 2 Belgium 81‐90 ‐0.7 0 4 Austria 95‐01 ‐0.6 2 2 Netherlands 90‐00 ‐0.4 2 1 Total change 13 Total no change 26
Source: Alesina, Carloni and Lecce (2010)
So how did the Con-Lib coalition score on the political front? Rather well, we have to admit. For one, the government continuously repeated that this budget was ‘unavoidable’. Any lack of resolve in restoring order to the public finances was apparently going to push the country to edge of the abyss, or so the argument went. In addition, the government embarked on this unpopular path early on so that they can blame most of the painful austerity measures on the past “profligacy” of the Labour government (see box 1).
Box 1: Labour’s report card
Although the Labour party had been mostly living beyond its means since taking over the helm in 1997 (i.e. in a period of high economic growth), it is not fair to blame double-digit deficits on their runaway spending. In fact, the sudden deterioration of public finances in the UK was mostly thanks to the massive retrenchment of the private sector amid the financial crisis. Figure 1 shows that since 2008 the private sector has been running gigantic surpluses and the government was forced to
run sizeable deficits to fill in the spending gap. Banks needed to be recapitalised and a plethora of growth boosting measures needed to be introduced to avoid a depression-like scenario. Equally, the surge in social security spending combined with a sharp drop in tax revenues amid falling asset prices and banking profits pushed the deficit further into the red. Figure 1: Sectoral financial balances
-12 -8 -4 0 4 8 12 -12 -8 -4 0 4 8 12 97 98 99 00 01 02 03 04 05 06 07 08 09 10
Public sector balance Private sector balance Net capital inflows/outflows
% of GDP % of GDP
Source: Rabobank, OECD
Figure 2: Debt decomposition
-10 -5 0 5 10 15 20 -10 -5 0 5 10 15 20 97 98 99 00 01 02 03 04 05 06 07 08 09 10 Cyclically adjusted primary balance
Automatic stabilisers
Stock-flow adjustment (includes financial sector support, FX movements, etc.) Debt dynamics (difference between interest rate and nominal GDP growth rate) Total change
Drivers of changes in British government debt
% of GDP % of GDP
Source: Rabobank, OECD
Moreover, if we look at the figure 2, we see debt ratios in the UK were not actually rising, which was largely thanks to a highly favourable macroeconomic backdrop. The average debt ratio from the year Labour took over (1997) until the crisis (2007), was around 47% of GDP. For that matter, most of the recent increase in Britain’s debt ratio can be explained by the severe drop in economic activity and the direct support measures for the banking sector and not the cyclically adjusted primary
balance. With regards the support measures, Lavaen and Valencia (2010) show that the net direct fiscal costs of the banking crisis in the period of 2007-2009 for the UK amounted to almost 7.5% of GDP – the highest among the advanced economies.
Where the government does not score particularly well is their communication with the British public. In a recent Financial Times poll last week, more than 40% of respondents believed the looming spending cuts would affect them only a little, if at all, while Mr. Cameron mentioned in his speech that the cuts will affect “everyone”. Obviously, he has not been clear enough. And therein lies the problem. If the harsh measures come as a surprise for some, it may lead to lower approval ratings for Mr. Cameron.
Feverish economic dispute
But an even more important criteria for the government should be their success in putting the gaping budget deficit on a decisive downward path without endangering the still fragile economic recovery. How successfully they will be depends on many unknown factors, which has led to a division amongst well-respected economists. This was made all the more clear when 20 economists urged the former Chancellor of the Exchequer, Allistair Darling, in an open letter to the Sunday Times (14.Feb.2010) to start cutting the structural deficit this year. They wrote that “there is a
compelling case, all else being equal, for the first [austerity] measures beginning to take effect in the 2010-11 fiscal year”. While in a
matter of days, 60 economists responded in a letter of their own to the Financial Times (18.Feb.2010) that such policy was absolutely wrong. They wrote:
“In urging a faster pace of deficit reduction to
reassure the financial markets, the signatories of the Sunday Times...seek to frighten us with the present level of the deficit but mention neither the automatic reduction that will be
achieved as and when growth is resumed nor the effects of growth on investor confidence. How do the letter’s signatories imagine foreign creditors will react if implementing fierce spending cuts tips the economy back into recession?”
Unfortunately, the only point economists seem to agree on is that the government made a right decision to give spending cuts the leading role in their consolidation plan – they account for 77% of the fiscal tightening. This is because historical evidence shows that spending restraint is more likely to generate lasting fiscal consolidation and better economic performance than tax increases.
So which one of the camps – exit now or exit later – is right? Only time will tell. But let’s look briefly at the reasons why Mr. Cameron listened to the first camp before turning to the worries of the “exit later” camp.
Getting ahead of the curve
The deficit hawks believe staying put and hoping for the best is the wrong way to go about the current fiscal mess in the UK. The belief is that once markets take fright, interest rates will jump and the debt dynamics will become truly appalling. This why the Con-Lib coalition believes the policy of keeping-your-fingers-crossed is “irresponsible”.
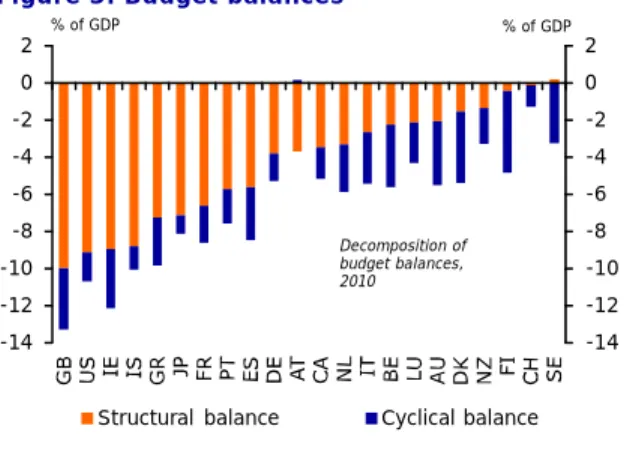
The current Chancellor of the Exchequer, Mr. Osborne, even goes so far as to draw parallels between the UK’s fiscal troubles and that of Greece. Although in a previous note we have refuted that theory (see “Is Britain the next Greece?” – Special Report 2010/08) there are some valid reasons to be worried about UK’s public finances. The structural deficit of the UK is estimated to be the highest amongst the OECD countries in 2010 (see figure 3) and their debt ratio since 2008 is rising the fastest compared to the rest of AAA-rated sovereigns, according to Fitch.
Figure 3: Budget balances -14 -12 -10 -8 -6 -4 -2 0 2 -14 -12 -10 -8 -6 -4 -2 0 2
Structural balance Cyclical balance Decomposition of budget balances, 2010
% of GDP % of GDP
Source: Rabobank, OECD
So it was clear that something had to be done. But the common fear is whether the private sector will be able to stand on its own feet when the government heads for the exit? The the newly-formed Office for Budget
Responsibility (OBR) certainly thinks so. As seen in table 1, the OBR forecasts growth to remain robust during the austere period – albeit somewhat weaker than what Mr. Darling had us believe. The OBR expects the Budget to knock just 0.4% off GDP over the next two years, and a mere 0.2% over the next four years as a whole. The reason for their “optimism” is largely based on the three factors they have outlined in their Budget report (p. 19):
1. Monetary conditions will remain loose for
longer should the need arise.
2. A credible fiscal consolidation plan would
calm bond vigilantes who fret about Britain’s borrowing and, therefore, lead to lower interest rates. This is bound to have a positive effect on the entire economy (for details see our Special: “Demystifying the paths towards debt sustainability”).
3. A fiscal adjustment may be expansionary if
households and firms believe that the fiscal tightening generates a change in regime that eliminates the need for larger adjustments in the future. As such, in the anticipation of lower taxes, the private sector will spend more in the current period (this is also known as the Ricardian
equivalence effect).
What if the plan backfires?
These factors can all be helpful, but many are still not convinced that the economy will grow as rapidly as the current fiscal arithmetic assumes. This is why the Labour party, which is in the “exit later” camp, calls the Budget “reckless” and “short-sighted”. There are number of reasons presented by the
opponents. First, the monetary policy rate in the UK is already constrained by the zero-bound. Given the substantial amount of slack in the economy, some economists believe that policy rates are actually tight at the moment (i.e. policy rates had to be in the negative territory, which is obviously impossible). Moreover, sluggish bank lending amid huge asset writedowns means the monetary transmission channel is clogged. So monetary policy is more of a problem than the solution. Figure 4: Borrowing costs are already low
0 1 2 3 4 5 6 7 8 9 10 0 1 2 3 4 5 6 7 8 9 10
Government bond yields, 10yr, 18.June.2010
% %
Source: Rabobank, Reuters EcoWin
Second, the Keynesians say that borrowing costs are already low in the UK (see figure 4), so a further drop of, say, 1-1.5% would hardly make a difference. Mind you that one of the biggest reasons why Ireland, Sweden and Finland had successful consolidation
programmes in the past was owing to sharp drops in long-term interest rates.
Finally, the Keynesians dismiss the Ricardian offset of public saving that the Con-Lib
coalition is hoping for because private agents are credit-constrained and are still in desperate need of repairing their balance sheets. For that matter, the potential crowding-in of private investment and consumption will be less in the current scenario.
So the Keynesians believe a premature fiscal exit will have the effect of throwing the hot potato of unsustainable debt back to the private sector and this will choke the recovery given that households and firms are still in the midst of their deleveraging process while facing major headwinds (i.e. higher
unemployment, falling wages, tighter credit conditions, etc). In the most adverse scenario, the economy may weaken so much that the whole fiscal consolidation may backfire as tax revenues collapse and social security expenses soar, thereby pushing the budget balance back into the red.
To further strengthen their argument, they point to the recent sovereign debt crisis in the European periphery as a sign that export growth will remain subdued for some time to come. Remember, the eurozone members buy nearly half of the country’s exports. Therefore, the anticipated weakness of external demand cautions against putting many eggs in the foreigners basket.
Plan B, anyone?
The fact of the matter is that the OBR itself points to the great uncertainties surrounding their forecasts. They state explicitly in their report that the chance of GDP growth coming within 1%-point of their prediction for this year is 70%. For next year, that figure falls to below 40%. By 2014, there is only around 30% chance that their forecast will be correct. Given the amount of uncertainty regarding the future path of the UK economy, what is the government’s plan B if things do not work out as nicely as have hoped for? Sadly, they do not have one. But any army General could tell the government that blindly believing in one scenario may result in unnecessary casualties.
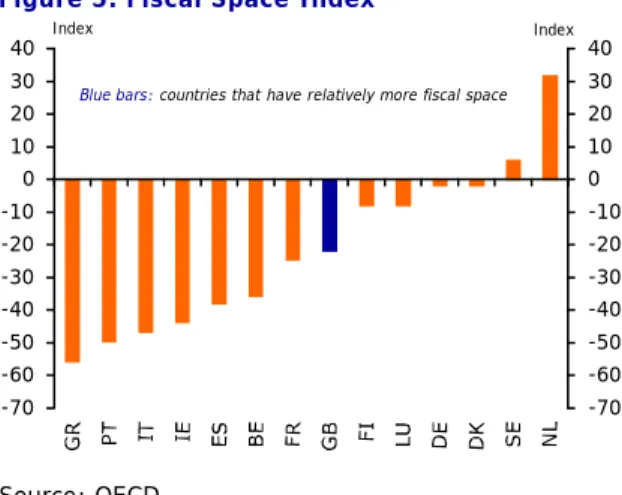
Having a backup plan does not mean believing in the worst, but it shows to the markets that the government is ready for anything. Given that the public sector still has some fiscal space left (see figure 5), such plan B would be considered credible by most, in our view. Figure 5: Fiscal Space Index
-70 -60 -50 -40 -30 -20 -10 0 10 20 30 40 -70 -60 -50 -40 -30 -20 -10 0 10 20 30 40 Index Index
Blue bars: countries that have relatively more fiscal space
Source: OECD
Against this backdrop, the fragililty of the economy suggests that no policymaker should stick dogmatically to a single plan. Sound policymaking means outlining the weapons you have in your arsenal, from infrastructure projects to tax rebates, to expand demand temporarily with extra public spending in case the situation turns for the worse. This could equally mean that the government slows down the consolidation process. The findings of Corsetti et al (2010) shows that gradual consolidation is the strategy that has the lowest cost in terms lost output.
June 2010 Shahin Kamalodin (+31 30 2131106) [email protected] www.rabobank.com/kennisbank References
-
Alesina, A., Carloni, D. And Lecce, G. (2010). The European experience with large fiscal adjustments. VoxEU.org column, 29 May-
Corsetti, G., Kuester, K., Meier, A. Muller, G.(2010). Debt consolidation and fiscal
stabilization. AEA Papers and Proceedings, 2010.
-
Lavaen, L. and Valencia, (2005). Resolution ofBanking Crises: The Good, the Bad, and the Ugly. IMF Working Paper 146