Declarative Processes
Morten Marquard1, Muhammad Shahzad1,2, and Tijs Slaats1,3? 1
Exformatics A/S, Dag Hammarskj¨olds All´e 13, DK-2100 Copenhagen Ø, Denmark
{mmq, ts}@exformatics.com,http://www.exformatics.com
2 TEO International
3 IT University of Copenhagen
Abstract. As a provider of Electronic Case Management solutions to knowledge-intensive businesses and organizations, the Danish company Exformatics has in recent years identified a need for flexible process support in the tools that we pro-vide to our customers. We have addressed this need by adapting DCR Graphs, a formal declarative workflow notation developed at the IT University of Copen-hagen. Through close collaboration with academia we first integrated execution support for the notation into our existing tools, by leveraging a cloud-based pro-cess engine implementing the DCR formalism. Over the last two years we have taken this adoption of DCR Graphs to the next level and decided to treat the nota-tion as a product of its own by developing a stand-alone web-based collaborative portal for the modelling and simulation of declarative workflows. The purpose of the portal is to facilitate end-user discussions on how knowledge workers really work, by enabling collaborative simulation of processes. In earlier work we re-ported on the integration of DCR Graphs as a workflow execution formalism in the existing Exformatics ECM products. In this paper we report on the advances we have made over the last two years, we describe the new declarative process modelling portal, discuss its features, describe the process of its development, re-port on the findings of an initial evaluation of the usability of the tool, resulting from a tutorial on declarative modelling with DCR Graphs that we organized at last years BPM conference and present our plans for the future.
Keywords: Declarative Modelling, DCR Graphs, Web-Based Process Modelling, Col-laborative Process Simulation, Process Flexibility, Knowledge Work
1
Introduction
Former secretary of labor in the Clinton administration, Robert Reich, argued that the competitiveness of nations depends on the education and skills of its people and on the infrastructure connecting people with one another [25]. He segmented the work
?
Authors listed alphabetically. This work has been supported by the Danish Agency for Science, Technology and Innovation through an industrial PhD grant. We gratefully acknowledges help-ful comments from Søren Debois, Thomas Hildebrandt and anonymous reviewers.
force into three types of work: (1) routine production services, (2) ”in-person” services and (3) ”symbolic- analytic” services. Today we often refers to symbolic analysts as knowledge workers [3, 6], the employees which contribute to most of the economic growth in developed economies. Supporting these knowledge workers and ensuring easy and smooth collaboration is important to compete globally. Enabling knowledge workers to work smarter, rather than just harder, involves various IT infrastructures to ensure communication and collaboration.
Traditional process initiatives, typically seen in the automobile industry, focus on routine production services [25]. While increasing productivity and cutting costs in primary industries is important to compete globally, it is even more important to pro-vide similar support for knowledge workers. Comparing tools and processes used in the automobile industry with knowledge intensive industries reveals a great disparity: the infrastructure supporting routine production services is much more advanced what is found supporting knowledge workers. Often knowledge workers use email as their pri-mary communication and collaboration tool, and studies shows that knowledge workers on average spend 28 percentage of the time reading and responding to emails [16]. This is hardly efficient and makes it hard to compete in a global economy, especially as knowledge workers in the developing countries have cheap and easy access to sec-retaries and other in-person services, and therefore will be better serviced than knowl-edge workers in the developed countries. The engineers, doctors and financial analysts in the western world simply need to work harder as they cannot leverage cheap primary services. Therefore, providing infrastructure and technologies for knowledge workers which automate their more mundane tasks is critical to compete globally. McKinsey Global Institute estimate a productivity gain of 20-25 percentage on average knowledge workers by using modernsocial technologies[16].
Efforts to make knowledge workers more productive often involve attempts to trans-fer and adopt the technologies used in routine production services, in particular process technologies are commonly based on the industry standard Business Process Manage-ment Notation (BPMN) [23,34]. The BPMN notation is founded in the concept of flow; the idea that to describe the behaviour of a process one needs to describe how control passes (flows) between its activities. It has been observed however that the flow-based paradigm is not ideal for knowledge-centred processes: knowledge workers deal with very diverse problems which rarely ”fit the mould”, instead of being given predefined sequences of tasks they often need to decide themselves what actions they should take based on their expert knowledge. The IT systems that support them therefore need to be able of offering a large degree of flexibility. [21, 26, 35] Such flexible processes exhibit a large degree of variability, exhibited in flow-based models by many different possible paths and states, which leads to so-calledspaghetti modelswhich are no longer understandable by users.
As an alternative a newdeclarativeorconstraint-basedparadigm has been proposed [8, 12, 22, 24, 30]. The declarative paradigm is grounded in the idea that one should only model the constraints (or business rules) of a process and then derive the possible paths from the constraints. Any execution allowed by the constraints is a valid execution of the process model, i.e. the workers are given maximal flexibility within the rules.
Exformatics is a Danish software developer providing Electronic Case Manage-ment (ECM) solutions to knowledge-intensive businesses and organizations such as LEGO, ISS, ministries and government institutions. Already from their founding they have realised the need for flexible processes support in their tools and in initial versions this was solved by very rough process definitions that only grouped tasks within spe-cific phases, but otherwise left maximal flexibility to the users. They realised that this approach lacked the ability of adding more meaningful rules and constraints to their processes and through participation in a Danish knowledge networkInfinit[1], which supports interaction and dissemination between academia and industry they came into contact with the Process Models group at the IT University of Copenhagen (ITU) which was working on related issues and in particular has developed the DCR Graphs nota-tion [5, 8, 10, 19]. DCR Graphs is a declarative notanota-tion for flexible processes that sets itself apart from other declarative notations such as Declare by utilizing only a very small set of constraints, yet yielding high formal expressive power. In addition it of-fers a straightforward run-time semantics formalized as transformations of the graphs, which means that its visual representation can be used both at design-time to represent process definitions and at run-time to represent process instances, in a similar manner as Petri-nets.
Exformatics became very interested in the work on DCR Graphs and how they could employ the notation to leverage flexible processes. Therefore they initiated a close collaboration with the researchers at ITU, facilitated through various Danish fund-ing mechanisms supportfund-ing university-industry collaboration [4]. Most notable among these was a 3 years industrial PhD project, where Exformatics employed a PhD student to do research on flexible process notations while at the same time being enrolled at ITU.
During this project DCR Graphs were first integrated into the existing ECM tools as a formalism for process-control by implementing a cloud-based process engine based on the DCR Graphs semantics [28]. At the same time the student also developed a prototype tool for the graphical modelling of DCR Graphs which was well received within the company and opened the road to further adaptation of DCR Graphs not only as an internalized notation for standardized processes, but also as a graphical notation for designing processes as a part of business consultancy services, in essence making DCR Graphs a product of their own.
Engaging end-users in the process dialogue is hard as process notations can be hard to understand for the users, but lack of end-user engagement often leads to process implementations not supporting the real business needs. Misunderstandings over the semantics of notations and assumed implicit behaviour that is not explicitly modelled lead to users interpreting processes in different ways, ultimately leading to failure of many process initiatives. In order to avoid such issues we aimed to include extensive support for collaborative process simulation in our tools. To ensure employee engage-ment we allow the users toplaythe processes like a computer game among co-workers. The team of co-workers can define the process using a declarative process-model and immediately start process simulation in order to verify whether the modelled processes meet their expectations and the real world needs. End-users often asks questions like
sub-sequently the process model can be adjusted to meet the increased understanding of the process. Rather than requiring modellers to ”know” a precise and correct model from day one, we empower them to iteratively model the processes through an increased understanding of the (possibly changing) business rules and requirements.
To support such flexible, interactive and run-time adaptable process modelling ac-tivities and facilitating end-user discussions on how knowledge workers really work we developed a stand-alone web-based collaborative portal for the modelling and sim-ulation of declarative workflows. This paper focuses on this new declarative process portal. We start by giving a short introduction to DCR Graphs. We then give a detailed overview of the portal and its features, discuss the development processes that led to its creation and discuss initial efforts at evaluating the usability of the portal. We finalize by discussing our plans for the future, both in terms of new features to the portal and new avenues of research.
1.1 Related Work
Several web-based commercial tools exist for the modelling of business processes; such as Signavio, IBM Blueworks Live and Oracles Business Process Management Suite. However, to our knowledge DCRGraphs.net is the first web-based modelling tool aimed in particular at constraint-based notations for flexible processes.
The latest version of BPMN [23] includes support for so-calledad hoc sub-processes, providing a method for adding pockets of flexibility to a BPMN diagram and supporting constraints similar to the condition and response relation of DCR Graphs [9]. In addi-tion there is an currently ongoing effort by the Object Management Group to develop a new standard notation aimed in particular at case management and adding support for flexible processes to BPMN, called the Case Management Model And Notation (CMMN) [22]. The work on CMMN is strongly inspired on the research on the Guard-Stage-Milestone (GSM) model [13] developed at IBM Research, which in turn is based on earlier work on artifact-centric business processes [2]. While GSM is foremost a data-centric model it has some declarative influences as well, the main elements of the notation arestagescontaining tasks, which are either active or inactive based onguards
defined on the stage. The acceptance criteria of a stage are modelled throughmilestones, which can in turn be part of the guards of other stages. Compared to GSM, DCR Graphs put more focus on the behaviour of tasks and events than on the data of the process.
Declarative process languages came to prominence in the BPM community through the development of the Declare notation [24, 31, 33]. Declare consists of a relatively large set of constraints typically found in business processes, which are traditionally mapped to Linear Temporal Logic(LTL) formulae, although other formalizations also exist [15, 17, 18]. DCR Graphs differ from Declare in the number of symbols used in the notation: Declare uses a large number of constraint templates, each with their own symbol whereas DCR Graphs are limited to 5 elementary relations. Also, because the runtime semantics of DCR Graphs are given in terms of transformations on their mark-ing, it is straightforward to visualize and reason about the simulation of DCR Graphs. Exformatics adopted DCR Graphs because of their close research collaboration with ITU, giving them direct access to the researchers behind the notation, because they preferred a more concise notation and put particular importance into reasoning about
the runtime of processes through simulation. We are not aware of any published work reporting on industrial use of Declare.
2
Hierarchical DCR Graphs
In this section we exemplify DCR Graphs and their semantics using an abstracted ver-sion of the main case management process of the Exformatics ECM system.
Case Case Manager Archive Case Create Meeting Post To Activity Stream Create Document % ▼
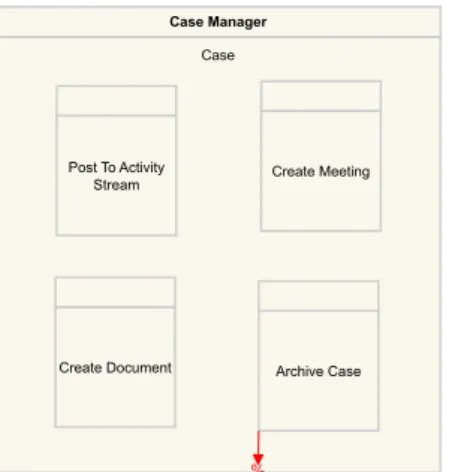
Fig. 1.Root Case Management Process
In figure 1 we start with the root pro-cess. The main building blocks of a DCR Graph are the events (or activities), drawn as a box with a bar on top. The box contains the name of the activity and the bar contains the roles that are able of executing it. Our process has a sin-gle role: the case manager. Activities can be grouped together by nesting them un-der a super-activity, in which case only the atomic activities are executable. Such groupings are a graphical shorthand for applying constraints or properties to mul-tiple activities at once: in our process the super-activity Casehaving the role
Case Manager means that the case
manager is able of executing every atomic activity nested under it. Constraints or busi-ness rules can be added to the model by adding one of five relations, drawn as directed arrows between activities. The root process contains a single relation, the exclusion
relation (→%) fromArchive CasetoCase. The exclusion relation is used to re-move activities from the process, for example to close tasks that should no longer be executable, or to model an exclusive choice between two activities. Because the super-activity Caseacts as a grouping the exclusion relation applies to all five of the un-derlying activities. This means that after archiving the case no further actions can be taken as it removes all activities from the process. Following the declarative paradigm unconstrained activities can be done at any time and any number of times, therefore the process supports many different runs: one could for example upload two documents, create a meeting, upload another document and finally archive the case. Note that while
Archive Casecloses the process by removing all activities, it is not required to
happen and the previous example run would also have been valid if it had not ended by archiving the case.
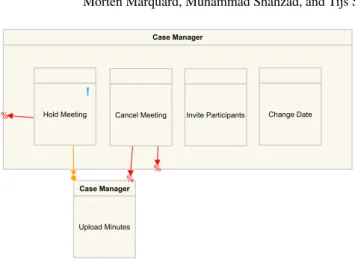
Figure 2 shows the process for organizing a meeting. Similarly to the previous ex-ample we use the exclusion relation to remove activities from the process when they are no longer relevant: the activitiesInvite Participants,Change Date,Hold
MeetingandCancel Meetingare grouped together and removed by either
hold-ing or cancellhold-ing the meethold-ing. Only after holdhold-ing the meethold-ing is it possible to upload the minutes of the meeting, this is modelled by the condition relation (→•) which states that beforeUpload Minutescan be done we first need to have doneHold Meeting.
Case Manager Upload Minutes Case Manager Invite Participants Hold Meeting ! Change Date Cancel Meeting % ▼ ▼% %▼ ▼
Fig. 2.Meeting Sub-process
Cancel Meetingexcludes this activity since it does not make sense to upload
min-utes for a meeting that was cancelled. Finally the goal of the meeting sub-process is that we either eventually hold the meeting or cancel it. This is modelled by making
Hold Meetingapending response, drawn by adding a blue exclamation mark to the
activity box. A pending response denotes that an activity should either happen or be removed from the process before we can finish or close the process; in our example eitherHold Meetingneeds to be done orCancel Meetingneeds to exclude it.
Checkin Case Manager Checkout Case Manager Download Case Manager %▼ %▼
+
▼+
▼ ▼Fig. 3.Document Handling Sub-process
Figure 3 shows the pro-cess for managing a document in the ECM. To edit the document a user needs to check it out, the file is then locked until it is checked in again. This is mod-elled using first the
ex-clusion relation to exclude each activity when they happen (meaning they can only be done once at a time) and the two newinclude relations(→+) between the two activi-ties. The include relation is used to add removed activities back into the process, so in this case, whenCheckouthappens, it removes itself and addsCheckinto the pro-cess and vice versa. Finally when a file is checked out we always want it to be checked in again before the process can finish. We model this through the response relation
(•→) which is a dynamic version of the pending response that we introduced earlier. It denotes that afterCheckoutis executed we requireCheckinto be executed (or ex-cluded) at least once before we can close the process. It is always possible to download the document through the unconstrainedDownloadactivity.
Finally we would like to tie all these process together into a single process describ-ing the handldescrib-ing of a case in the ECM system. For this we use an extension called
hier-archical DCR (Hi-DCR) Graphs, which adds a notion of spawnable multi-instance
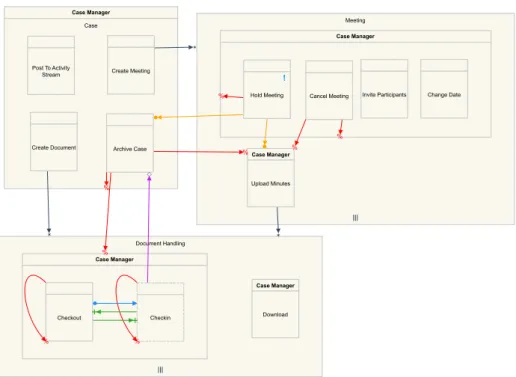
sub-processes. Figure 4 shows the case management process as a Hi-DCR Graph. The main new concept are the two new sub-processesMeetingandDocument Handling,
Document Handling Meeting Case ||| ||| Case Manager Archive Case Create Meeting Post To Activity Stream Create Document Case Manager Download Case Manager Case Manager Upload Minutes Case Manager Cancel Meeting Checkout Invite Participants Hold Meeting ! Change Date %▼ %▼ +▼ ▼ ▼ ▼ ▼ ▼ % ▼ % ▼ ▼ % ▼ ▼ %▼ ▼ %▼ Checkin ▼ % + ▼
Fig. 4.Case Management Process
drawn as a box without a bar on top of it. These are essentially DCR Graphs inside the root process that need to be initialized through the newspawn relation(→∗), creating a new copy of the sub-process for each time it is spawned. In the example the
activ-ityCreate Meetingspawns a new copy ofMeetingeach time it is executed and
Create DocumentandCreate Minutescreate a newDocument Handling
process each time they are executed.
When one has a relation between an activity of a sub-process and an activity of its parent, the relation will apply to each instance of the activity. For example a case can not be archived while there are pending meetings; this is modelled by adding a condition
fromHold MeetingtoArchive Case, meaning that while there is at least one
Hold Meeting-activity that has not yet been executed or excluded (by cancel
meet-ing), it is impossible to executeArchive Case. In a similar manner it should not be possible to archive the case while documents are checked out. We model this through
themilestone relation(→), which blocks an activity as long as some other activity is
pending. Because of the response relation fromCheckouttoCheckin, there will be a pending response on the latter whenever the file is checked out. The milestone from
CheckintoArchive Caseensures that as long as there is at least one instance
ofCheckinthat is pending, we can not archive the case. Finally, to archive the case,
Archive Caseexcludes all instances of all activities inDocument Handling,
except forDownloadas it should still be possible to download files. All instances of
Upload Minutesare also excluded, it is not necessary to exclude the other activities inMeetingas this will already have been done by holding or cancelling the meeting and unless one of these has been executed the case can not be archived.
The example DCR Graphs from figures 1, 2 and 3 are all available on DCRGraphs.net, the Hi-DCR Graph in figure 4 was drawn using the development version of the portal which is not yet ready for release.
3
The DCR Graphs Process Portal
The DCR Graphs Portal4provides an online web based tool for the modelling, sharing
and simulation of DCR graphs.
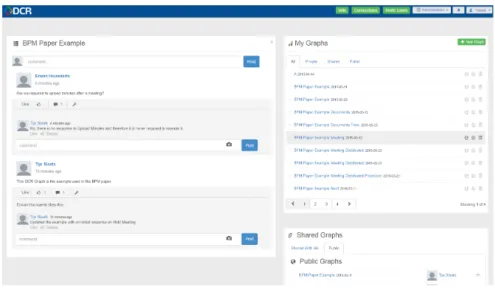
To use the portal one can register as a new user or log in using a LinkedIN or Face-book account. After registering users can maintain their profile, create DCR Graphs, connect to friends and colleagues and simulate DCR Graphs either individually or col-laboratively with other users. Users can communicate with each other through a main
activity stream (similar to Facebook’s news feed) and local activity streams for each
DCR Graph.
Fig. 5.Portal
The portal contains a graphical web-based editor which supports the modelling of all aspects of a DCR Graph, such as the activities, relations, roles and data. A number of unique features have been added to help improve the presentation and understanding of the modelled processes: activities and relations can be assigned a numericallevel, which can be used to control the level of detail at which one wishes to view the model. In addition activities and relations can be assigned one or more groups and a model can be filtered based on these groups or specific roles. To facilitate discussion and collaboration among co-workers, easy access to the activity stream of the graph has been provided from within the editor. The editor also supports revisions management, tracking all changes and providing users the ability to designate major versions. Older versions can be viewed graphically and rolled-back to. There is a wizard available to rapidly create a
4
new graph. The editor supports importing XML files (following the standard provided in [28]) and can export DCR Graphs as XML, SVG and PNG files. Models can be shared with friends an co-workers or made publicly available to all users of the portal.
Fig. 6.Editor
From the editor the user can start to simulate a model. When initiating a new simu-lation the user can assign a user to each of the roles of the model, these can be human users or automated users. To simulate a model individually one simply leaves all the roles assigned to oneself, but by inviting friends or co-workers one can start a collabo-rative simulation with different people playing different roles in the process. Currently two automated users are provided, an eager user that will perform any available activity that is either required or has not yet been done before and a lazy user that only performs activities which are currently required. By assigning all roles to automated users one can start a fully automated simulation. Simulations can be paused, at which point it is possible to dynamically edit the model, resumed and restarted and a record of each simulation is kept in the system which can be viewed and replayed. During simulation the runtime of the DCR Graph is updated and visualized on-the-fly, enabled activities which have either not been executed before, or are currently required are given a green border to highlight them to the user. In addition there is a task list which displays all enabled or pending activities, grouped in the following order: 1) enabled and pending event, 2) pending but blocked events, 3) enabled events which have not been executed earlier and 4) enabled events which have been executed earlier (but can be repeated). The activities executed are logged in the Execution Log, which can be used later to re-play the simulation. The task list also disre-plays the current accepting state of the process, i.e. whether the process can be considered completed or more activities need to be exe-cuted to finish the process. The participants in the process are listed during simulation with the roles they play in the current simulation.
In order to support private usage by customers and universities (for which academic licensing possibilities are available) we’ve extended the portal to support private
organi-Fig. 7.Simulation
zations with their own users, graphs, etc. This enables organisations to set up their own version of the portal, inviting their employees and students and model and share pro-cesses within a closed community. Users can belong to several organisations, including
thepublicorganisation which is available to all users by default.
In order to enable and encourage 3rdparty development, such as student projects,
we provide an application plug-in framework for the portal. We foresee a series of ad-ditional features such as model checking (dead- and live-lock checking) and extended process visualisation being facilitated by this framework. The framework has recently been used to develop an app supporting flow-based visualizations of DCR Graphs and searching for suitable ”happy paths” based on different search criteria as part of a re-search project performed in cooperation with the IT university of Copenhagen and a Danish credit institution. More details on the framework can be found at the wiki5.
4
Development of the DCR Portal
Development of the portal has been carried out using the Scrum methodology, through close co-operation between the development team at TEO International in Pakistan and the design team at Exformatics in Denmark. We used short 2 to 3 week sprints with frequent updates of the portal. Different technologies have been used to achieve the solution so far, including: JavaScript with Rapha¨el, jQuery, Microsoft .NET with MVC 4, REST services and the existing DCR Process Engine which was developed in a mix of C# and F#. We are currently working on the 10thmajor version of the portal, which will include support for sub-processes.
The DCR Editor is purely a JavaScript application which utilizes REST services developed in .NET to communicate with the web-server. The editor uses the Rapha¨el
5
Library to visualize the graphs in SVG-format. Simulation of the graphs uses DCR pro-cess engine services which have been upgraded over the time to support newly added features. The wrapper of the Editor, which provides listing of the graphs, sharing, ac-tivity stream and friendship functionalities is developed in MVC 4 .NET. Simulation in Editor uses realtime notifications, updates with the help of Signal R which uses Web-Sockets where possible. The editor utilizes caching techniques to minimize the requests to server and improve the performance of the product.
5
Evaluation
At last years BPM conference we organized a tutorial on flexible business process mod-elling using DCR Graphs where we first gave an introduction to DCR Graphs, exempli-fying the notation through a demo of the process portal, then asked the audience to try out the portal for themselves by doing a number of exercises and finally requested their feedback in the form of a questionnaire.
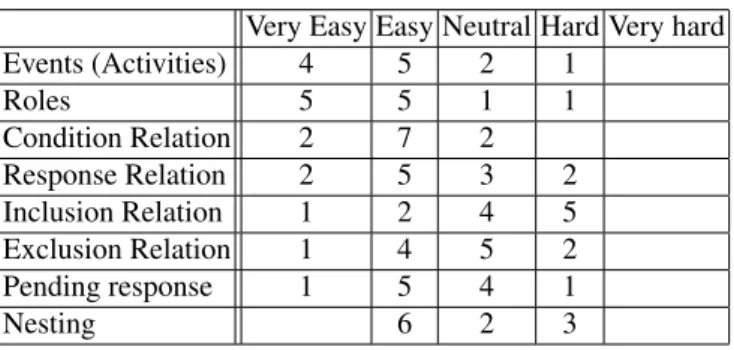
Very Easy Easy Neutral Hard Very hard
Events (Activities) 4 5 2 1 Roles 5 5 1 1 Condition Relation 2 7 2 Response Relation 2 5 3 2 Inclusion Relation 1 2 4 5 Exclusion Relation 1 4 5 2 Pending response 1 5 4 1 Nesting 6 2 3
Table 1.Understandability of Concepts
Twelve people filled out the questionnaire, eleven identified as re-searchers and one as a practitioner. On aver-age the attendants had been active in the BPM field for 5 years, rang-ing from 6 months to 14 years. Five peo-ple had previous experi-ence with DCR Graphs, whereas 9 people had
previous experience with declarative modelling notations in general.
Very Easy Easy Neutral Hard Very hard
Events(Activities) 3 7 2 Roles 3 4 4 1 Condition Relation 6 3 3 Response Relation 8 2 2 Inclusion Relation 5 5 2 Exclusion Relation 6 5 1 Pending response 7 3 2 Nesting 1 6 2 3
Table 2.Understandability of Notation
In the first set of questions we asked the audience if they found the underlying concepts of DCR Graphs hard or easy to understand. We specifically asked them to only comment on the understandability of the concept and not the graphical notation used. The results are shown in table 1, perhaps not
sur-prisingly most found activities (9) and roles (10) easy or very easy to understand. Of the relations the participants found the condition the easiest to understand, 9 people scored it easy or very easy, followed by the response (7), exclusion (5) and finally inclusion
(3). It is noteworthy that despite being closely related the audience found the inclusion relation significantly harder to understand then the exclusion relation, we conjecture that the exclusion more closely matches familiar concepts such as mutual exclusion, whereas the inclusion relation was more novel to the audience.
In the next set of questions we asked the audience to rate the understandability of the graphical notation. Table 2 shows the results, overall activities and roles were found to be easy or very easy to understand, whereas the users were more neutral about the notation of the relations. The condition and response scored higher then the inclusion and exclusion, we conjecture that this may be because many attendants were already familiar with the precedence and response constraints in Declare.
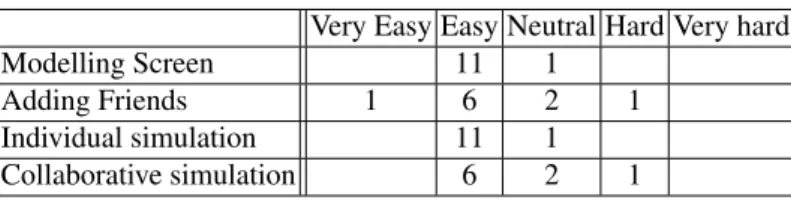
Very Easy Easy Neutral Hard Very hard
Modelling Screen 11 1
Adding Friends 1 6 2 1
Individual simulation 11 1
Collaborative simulation 6 2 1
Table 3.Usability of the Tool
In our final set of questions, whose results are shown in table 3, we focussed on the tool itself and asked the partici-pants to rate the us-ability of its various components. Both the
modelling and simulation functionality scored high, with 11 people finding them easy to use and the final participant being neutral on their usability. Adding connections scored a little less well, with 7 people finding this part of the tool easy or very easy to use. Collaborative simulation scored only slightly lower, with 6 participants finding it easy to use, out of 9 people answering this particular question.
The portal has been used for teaching a process modelling course at ITU, with 75 users signed up. While we have not organized a similar questionnaire for the students, overall the experience has been positive and no major issues were encountered in using the portal. More recently we also initiated a collaboration with the Federal University of the State of Rio de Janeiro (UNIRIO) where they use the portal for teaching a similar course.
6
Future Work
We recognize that it is too early to draw strong conclusions from the questionnaire based on a small number of academic participants. In the near future we plan to run multiple industrial workshops following the same structure as the tutorial, both as a method for raising awareness of the portal and attracting potential new customers and as a way to receive additional feedback from actual practitioners which will allow us to make stronger claims regarding its usability.
Further initiatives focus on: Sub-processes
The ability to split processes into sub-processes which can be instantiated and exe-cuted separately from the parent process. Experience from previous use cases [7] shows that sub-processes are important to model processes in an easy to describe and understandable way. Work on this item is already ongoing and we expect to
have sub-processes included in the live version of the portal by the summer of 2015.
Verification
Various algorithms have been developed to analyse DCR graphs for dead- and live-lock [11, 20]. Adding such analysis to the portal is important not only to support modelling DCR Graphs in the design phase, but also to support run-time adapta-tion of DCR Graphs within producadapta-tion systems such as the Exformatics Electronic Case Management tool. When the user adds new activities and/or constraints the resulting model should be checked for live- and dead-lock.
Gamification
As suggested by Keith Swenson, author of various books on Adaptive Case Man-agement [29], we intend to investigate addinggamificationfeatures to the portal by allowing participants toearnpoints and credits through active participation in the various aspects of the portal, for example helping other users with relevant ques-tions or modelling and publishing popular models of common processes.
Collaborative Editing
Several users, in particular students (who commonly work in groups), have re-quested support for the collaborative editing of process models. As this goes well along with collaborative simulation this is a feature we’re likely to add in the near future.
Time
An extension to DCR Graphs supporting time and deadlines has been proposed in the past [11]. We aim to support this extension in the portal, both as a part of the editor and simulation, for which we will provide the ability to scale, manually progress and pause time so that long-term processes can be simulated more quickly. Resources and Stochastic Models
DCR Graphs provide a constraint-based notation that allows one to describe and find all possible paths through a model, but to assist the users enacting the pro-cess it would be useful to inform them which paths the most efficient, similarly to how a route-finding tool such as Google Maps can find the fastest route between two points based on maps that describe any possible path. Simply finding the path requiring the least amount of activities is in most cases not enough, as not all ac-tivities consume the same amount of resources. To improve the ability of the portal to find efficient solutions for a process it would be useful if we could model the resources consumed by activities (for example time, machinery, personnel and/or financial means) and the probability that activities out of the users control (for ex-ample external or automated activities) will occur.
Process Mining
We plan to integrate various process mining [32] techniques into the tool, allowing users to conformance check logs based on a DCR Graphs model and supporting process discovery of DCR Graphs models. In addition we intend to use process mining techniques in combination with the previously mentioned support for re-sources and stochastic models to support advanced methods for process improve-ment where the portal predicts efficient paths through a process based on an analysis of previous behaviour.
Hybrid Techniques
A common pitfall of declarative notations is that practitioners are more familiar and accustomed to flow-based approaches such as BPMN diagrams, swim-lanes and flow-charts, making them hesitant to fully adopt a completely new paradigm. We are therefore investigating adding hybrid techniques [14, 27, 36] to the portal which will allow users to use DCR Graphs in combination with some of the flow-based models that they are used to.
7
Conclusion
Over the last few years Exformatics has taken large steps in adopting declarative pro-cess notations and techniques: they have employed the notation as a modelling tool in projects with customers, developed a declarative process engine based on the DCR Graphs notation and deployed said process engine as part of a recent customer project. More recently they have developed a new stand-alone solution, the DCR Graphs pro-cess portal, which provides an easily acpro-cessible web-based modelling and simulation tool for declarative processes. The portal has a strong social aspect, supporting commu-nication between the different stakeholders about their models and the ability to jointly simulate models in a collaborative setting. In this paper we described the portal and its development, together with the underlying Hierarchical DCR Graphs language, an extension of the original DCR Graphs language that offers support for multi-instance sub-processes.
There are many avenues for possible future work and Exformatics will continue to invest heavily in both declarative and hybrid process technologies. They have entered into a new collaboration initiative with IT University of Copenhagen (ITU), are partly funding a postdoctoral researcher over the next two years, are directly hiring a part-time researcher who is also employed at ITU and have joined as a partner on a number of research funding applications on declarative and hybrid process notations and tech-nologies. Furthermore Exformatics participates in various industry initiatives, currently with a major Danish financial institution which has worked with process modelling for many years but are looking into declarative notations to provide more flexible process models.
References
1. Innovations netværk for it.http://www.infinit.dk/.
2. Kamal Bhattacharya, Cagdas Gerede, Richard Hull, Rong Liu, and Jianwen Su. Towards
formal analysis of artifact-centric business process models. InIn preparation, pages 288–
304, 2007.
3. Thomas H Davenport, Sirkka L Jarvenpaa, and Michael C Beers. Improving knowledge
work processes.Sloan management review, 1996.
4. Søren Debois, Thomas Hildebrandt, Morten Marquard, and Tijs Slaats. Bridging the valley of death - a success story on danish funding schemes paving a path from technology readiness
level 1 to 9. InProceedings of the 2nd International Workshop on Software Engineering
5. Søren Debois, Thomas Hildebrandt, and Tijs Slaats. Hierarchical declarative modelling with
refinement and sub-processes. InBusiness Process Management, volume 8659 ofLecture
Notes in Computer Science, pages 18–33. Springer International Publishing, 2014.
6. Peter F. Drucker.Management Challenges for the 21st Century. HarperBusiness, 2001.
7. Søren Dubois, Thomas Hildebrandt, Morten Marquard, and Tijs and Slaats. A case for declarative process modelling: Agile development of a grant application system. 2014. 8. Thomas Hildebrandt and Raghava Rao Mukkamala. Declarative event-based workflow as
distributed dynamic condition response graphs. InPost-proceedings of PLACES 2010, 2010.
9. Thomas Hildebrandt, Raghava Rao Mukkamala, and Tijs Slaats. Designing a
cross-organizational case management system using dynamic condition response graphs. In
En-terprise Distributed Object Computing Conference (EDOC), 2011 15th IEEE International,
pages 161 –170, 29 2011-sept. 2 2011.
10. Thomas Hildebrandt, Raghava Rao Mukkamala, and Tijs Slaats. Nested dynamic condition
response graphs. InProceedings of Fundamentals of Software Engineering (FSEN), April
2011.
11. Thomas Hildebrandt, Raghava Rao Mukkamala, Tijs Slaats, and Francesco Zanitti. Contracts
for cross-organizational workflows as timed dynamic condition response graphs.Journal of
Logic and Algebraic Programming (JLAP), may 2013.
12. Richard Hull, Elio Damaggio, Riccardo De Masellis, Fabiana Fournier, Manmohan Gupta, Fenno Terry Heath, III, Stacy Hobson, Mark Linehan, Sridhar Maradugu, Anil Nigam, Pi-wadee Noi Sukaviriya, and Roman Vaculin. Business artifacts with guard-stage-milestone
lifecycles: managing artifact interactions with conditions and events. InProc. of DEBS ’11,
pages 51–62, New York, NY, USA, 2011. ACM.
13. Richard Hull, Elio Damaggio, Fabiana Fournier, Manmohan Gupta, Fenno Terry Heath, III, Stacy Hobson, Mark Linehan, Sridhar Maradugu, Anil Nigam, Piyawadee Sukaviriya, and Roman Vaculin. Introducing the guard-stage-milestone approach for specifying business
entity lifecycles. InProc. of WS-FM’10, pages 1–24, Berlin, Heidelberg, 2011.
Springer-Verlag.
14. Fabrizio Maria Maggi, Tijs Slaats, and Hajo A. Reijers. The automated discovery of hybrid
processes. InProceedings of 12th International Conference on Business Process
Manage-ment (BPM 2014), pages 392–399, 2014.
15. Fabrizio Maria Maggi, Marco Montali, Michael Westergaard, and Wil M. P. van der Aalst. Monitoring business constraints with linear temporal logic: An approach based on colored
automata. InBusiness Process Management (BPM) 2011, volume 6896 ofLecture Notes in
Computer Science, pages 32–147, 2011.
16. Jacques Bughin Richard Dobbs Charles Roxburgh Hugo Sarrazin Geoffrey Sands Michael Chui, James Manyika and Magdalena Westergren. The social economy: Unlock-ing value and productivity through social technologies. 2012.
17. Marco Montali. Specification and Verification of Declarative Open Interaction Models: a
Logic-Based Approach, volume 56 ofLecture Notes in Business Information Processing.
Springer, 2010.
18. Marco Montali, Maja Pesic, Wil MP van der Aalst, Federico Chesani, Paola Mello, and
Sergio Storari. Declarative specification and verification of service choreographiess. ACM
Transactions on the Web (TWEB), 4(1):3, 2010.
19. Raghava Rao Mukkamala.A Formal Model For Declarative Workflows - Dynamic Condition
Response Graphs. PhD thesis, IT University of Copenhagen, March 2012.
20. Raghava Rao Mukkamala, Thomas Hildebrandt, and Tijs Slaats. Towards trustworthy
adap-tive case management with dynamic condition response graphs. InProceedings of the 17th
IEEE International EDOC Conference, EDOC 2013, 2013.
21. N. A. Mulyar, M. H. Schonenberg, Mans, and van der Aalst. Towards a Taxonomy of Process Flexibility (Extended Version). 2007.
22. Object Management Group. Case Management Model and Notation, version 1.0. Webpage,
may 2014.http://www.omg.org/spec/CMMN/1.0/PDF.
23. Object Management Group BPMN Technical Committee. Business Process Model and
No-tation, version 2.0. http://www.omg.org/spec/BPMN/2.0/PDF.
24. M. Pesic, H. Schonenberg, and W.M.P. van der Aalst. DECLARE: Full Support for
Loosely-Structured Processes. InProceedings of the 11th IEEE International Enterprise Distributed
Object Computing Conference, pages 287–. IEEE Computer Society, 2007.
25. Robert B. Reich. The Work of Nations: Preparing Ourselves for 21st Century Capitalism.
Vintage Books, 1992.
26. Manfred Reichert and Barbara Weber. Enabling Flexibility in Process-Aware Information
Systems: Challenges, Methods, Technologies. Springer, Berlin-Heidelberg, 2012.
27. Hajo A. Reijers, Tijs Slaats, and Christian Stahl. Declarative modeling–an academic dream
or the future for bpm? In Florian Daniel, Jianmin Wang, and Barbara Weber, editors,
Busi-ness Process Management, volume 8094 ofLecture Notes in Computer Science, pages 307–
322. Springer Berlin Heidelberg, 2013.
28. Tijs Slaats, Raghava Rao Mukkamala, Thomas Hildebrandt, and Morten Marquard.
Exfor-matics declarative case management workflows as dcr graphs. InBusiness Process
Manage-ment, volume 8094 ofLecture Notes in Computer Science, pages 339–354. Springer Berlin
Heidelberg, 2013.
29. Keith D. Swenson. Mastering the Unpredictable: How Adaptive Case Management Will
Revolutionize the Way That Knowledge Workers Get Things Done. Meghan-Kiffer Press,
2010.
30. W. M. P. van der Aalst, M. Pesic, and H. Schonenberg. Declarative workflows: Balancing
between flexibility and support.Computer Science - R&D, 23(2):99–113, 2009.
31. Wil van der Aalst, Maja Pesic, Helen Schonenberg, Michael Westergaard, and Fabrizio M.
Maggi. Declare. Webpage, 2010.http://www.win.tue.nl/declare/.
32. Wil M. P. van der Aalst. Process Mining: Discovery, Conformance and Enhancement of
Business Processes. Springer Publishing Company, Incorporated, 1st edition, 2011.
33. Wil M.P van der Aalst and Maja Pesic. DecSerFlow: Towards a truly declarative service
flow language. InProceedings of Web Services and Formal Methods (WS-FM 2006), volume
4184 ofLNCS, pages 1–23. Springer Verlag, 2006.
34. Hagen V¨olzer. An overview of bpmn 2.0 and its potential use. InBusiness Process Modeling
Notation, volume 67 ofLecture Notes in Business Information Processing, pages 14–15.
Springer Berlin Heidelberg, 2010.
35. Barbara Weber, Manfred Reichert, and Stefanie Rinderle-Ma. Change patterns and change
support features - enhancing flexibility in process-aware information systems. Data and
Knowledge Engineering, 66(3):438–466, September 2008.
36. Michael Westergaard and Tijs Slaats. Mixing paradigms for more comprehensible models.
In Florian Daniel, Jianmin Wang, and Barbara Weber, editors,Business Process
Manage-ment, volume 8094 ofLecture Notes in Computer Science, pages 283–290. Springer Berlin