PROBLAB GOES TO SCHOOL: DESIGN, TEACHING, AND
LEARNING OF PROBABILITY WITH MULTI-AGENT
INTERACTIVE COMPUTER MODELS
Dor Abrahamson and Uri WilenskyThe Center for Connected Learning and Computer-Based Modeling Northwestern University, Evanston, IL, USA
ProbLab, an experimental middle-school unit in probability and statistics, includes a suite of computer-based interactive models authored in NetLogo (Wilensky, 1999). We explain the rationale of two of the models, Stochastic Patchwork and Sample Stalagmite, and their potential as learning supports, e.g., the temporal–spatial metaphor: sequences of stochastic events (occurring over time) are grouped as arrays (laid out in space) that afford proportional judgment. We present classroom episodes that demonstrate how the Law of Large Numbers (many samples) can be mapped onto the classroom social space (many students) as a means of facilitating discussion and data sharing and
contextualizing the content. We conclude that it is effective to embed the Law of Large Social Numbers into designs for collaborative learning of probability and statistics.
Introduction
The mathematics domain of probability has been long regarded as challenging for students of all ages (von Mises, 1981, Hacking, 1975, 2001; Konold, 1994; Biehler, 1995; Maher, Speiser, Friel, & Konold, 1998; Gigerenzer, 1998; Liu & Thompson, 2002). At the Center for Connected Learning and Computer-Based Modeling at
Northwestern University, we are creating software and computer-based activities to help students learn probability. Specifically, based on our previous research on students’ challenges in understanding probability (“Connected Probability,” Wilensky, 1993, 1995, 1997), we have designed a group of curricular models in the domain of
probability. Our interactive models are written in NetLogo (Wilensky, 1999) and incorporate interface features that allow students to run probability experiments under different parameter settings. A strength of NetLogo is that it affords simulating many random events concurrently because it uses parallel processing (it is ‘multi-agent’). Also, students can examine and even modify the code in which the models are
programmed, partly because NetLogo code—its primitives and syntax—was specifically designed to be easier to read and learn as compared to other computer languages (see also Papert, 1980, on Logo). The NetLogo “models library” includes models from a range of scientific and mathematical domains. Some of these models are grouped around classroom curricular units. One of these groups is ProbLab (Abrahamson & Wilensky, 2002). This paper introduces ProbLab, focusing primarily on “Stochastic Patchwork”
and “Sample Stalagmite,” two of several models currently in ProbLab.1 We present and analyze data from implementations in urban middle-school classrooms in which we investigated dimensions of collaborative activity design around essentially individual work with the simulations and vis-à-vis the specific content (for inherently collaborative designs, see, for example, S.A.M.P.L.E.R., Abrahamson & Wilensky, 2004).
Computer Models as Learning Environments for the Domain of Probability We are committed to help students ground mathematical content in meaningful experiences (e.g., Wilensky, 1993, 1997; Freudenthal, 1986; Gigerenzer, 1998;
Abrahamson, 2004), and our lesson plans encourage a social construction of
knowledge in the classroom milieu (see Brousseau, 1997). In designing the ProbLab models, we have endeavored to make probability an approachable domain for
middle- and high-school students. We submit that students’ biggest challenge with the domain of probability is not so much that the conceptual constructs per se are difficult but that the domain is difficult as seen through the lens of traditional
mathematical representations. Specifically, probabilistic processes occur over time, and learners are challenged by the epistemological tension between, on the one hand, individual outcomes, e.g., this flipping of a coin or this sample of coin flips, and, on the other hand, phenomena as global events, e.g., the overall chance of the coin falling on ‘heads’ (Liu & Thompson, 2002; Hacking, 2001). In ProbLab, we are attempting to create models that allow students to move between and connect such individual (micro-) and global (macro-) outcomes (see also Abrahamson & Wilensky, 2003; Papert, 1996).
Stochastic Patchwork
An important aspect of students’ connecting to the domain of probability through working in technology-based learning environments is that students ground in
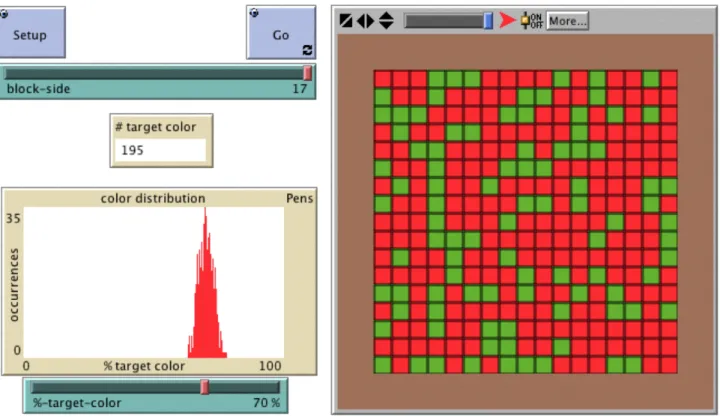
probability simulations the ideas inherent both in symbolical formats of the domain and in formulae for calculating and communicating findings from probability experiments. For instance, students should experience the meaning of a “.7” notation in probability distribution functions or experimental outcomes. One objective of this paper is to present and discuss a type of representation that may enhance students’ bridging between, on the one hand, simple probabilistic events, e.g., flipping coins, and, on the other hand, the corresponding formal representation, e.g., an overall “.7” chance of falling on ‘heads’ (for a biased coin). Specifically, these bridging representations may help students ground an understanding of probability—what it means to say that a probabilistic mechanism has a .7 chance of generating a favored event—in perceptual judgments of spatial proportion (Resnick, 1992), i.e. seeing that .7 of an outcome array is red (see Figure 1).
1 All ProbLab models are available for free download at http://ccl.northwestern.edu/ see also
http://ccl.northwestern.edu/curriculum/ProbLab/ for more models, further discussion, and a complete
Figure 1. ProbLab: Stochastic Patchwork. Parameters are set so each square in the graphics-window “mosaic” (total of 17^2 = 289 squares) has an independent .7 (or 70%) chance of being red on each trial. Therefore, on each trial, the mosaic has approximately .7 red squares, and after several hundred trials the histogram shows a normal distribution
converging on .7.
The ProbLab model Stochastic Patchwork (see Figure 1, above) is a bridging tool (Abrahamson, 2004) between time-based probabilistic events and space-based perceptual judgments. The probabilistic element in this model is a square “coin” that has a red “side” and a green “side.” Instead of flipping this single coin many times, we flip many clones of this coin all at once. The crux of this model is that if a single coin has a .7 chance of falling on red, then the aggregate of a sufficiently-large sample of these coins that flip all at once will approximate a .7 redness, i.e. most of the time about .7 of the squares will be red. The objective of students’ interacting with the model is that they understand how the model works and explore the effect of modifying parameter settings—the size of the population and/or the bias of the
coin/square—on the sample space (size and appearance) and on the dynamics of the emerging distributions.
Because the Stochastic Patchwork model simulates a probabilistic experiment, outcomes vary, yet after a sufficiently large number of successive iterations in the
experiment the outcome distribution approximates a normal distribution converging on a .7 probability as the mean, as displayed in a histogram that is part of the model (see Figure 1, above). We have found that students as young as 10-years old working with
ProbLab models interpreted experimental results using both enumeration-based strategies (counting red and green squares in samples) and multiplicative strategies (inferring proportions in populations by eyeballing red/green ratios in samples).
Sample Stalagmite
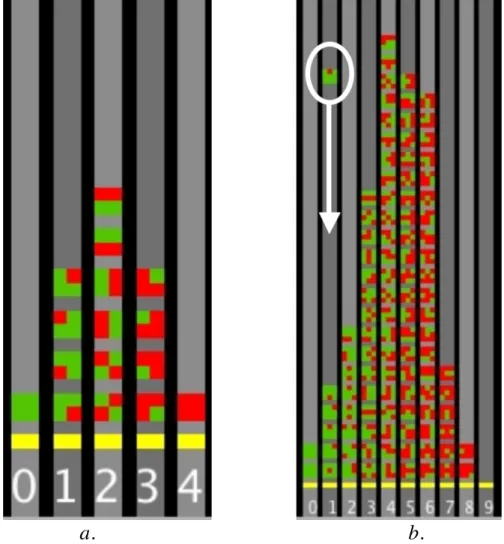
The ProbLab model Sample Stalagmite helps students understand histograms of probabilistic outcome distributions by building the histograms from the outcomes themselves. The model simulates the random generation of blocks of red/green squares and their accumulation into columns according to the number of red squares in each, e.g., 0 red squares, 1 red square, 2 red squares, etc. Figure 2a, below, shows the entire combinatorial sample space of sixteen “4-blocks” (2-by-2 arrays of
squares). Figure 2b, below, shows the partial combinatorial sample space of five-hundred-and-twelve “9-blocks” (3-by-3 arrays of squares). The model’s name comes from the dynamics of the visualization: the blocks descend along the columns to build a structure resembling a stalagmite (see, in Figure 2b, below, the descending 9-block marked by an ellipse).
a. b.
Figure 2. The NetLogo ProbLab model Sample Stalagmite: two fragments from the graphics window in the model’s interface under different conditions of running the
Sample Stalagmite accompanies students’ combinatorial analysis of all
possible blocks (see our publications on the combinations tower). In this model, 9-blocks are generated randomly. That is, at every run through the procedures, one of the 512 possible arrays pops up on top of the graphics window and falls down a histogram “chute” -- its corresponding column. For instance, if there are 2 red squares in the sample, the sample will fall down the ‘2’ column (see falling 9-block in the Figure 2b, on the previous page). The model can be set either to keep
duplicates or to reject them (in Figure 2 duplicates were rejected). So Sample Stalagmite takes the combinatorial space of the 9-blocks and re-positions it as a sample space. That is, each of the 512 arrays has the same chance (likelihood) of being generated on each trial.
The histogramed combinatorial sample space is designed as a visualization bridge for students to ground a sense of the likelihood of an event in combinatorial analysis and proportional judgment. For instance (see Figure 2b), students, who are comparing the column with 9-blocks that have exactly 4 red squares with the column of 9-blocks that have exactly 3 red squares, literally see that the subgroup of 4-red is more numerous and taller -- it occupies more space within the histogram as compared to the subgroup of 3-red squares. This increased commonality is related directly to the fact that there are more possible 4-red combinations (126) as compared to 3-red combinations (84). Also, the shape of the stalagmite remains roughly the same
whether we keep duplicates or reject them. This visual resemblance demonstrates that combinatorial analysis (theoretical probability) anticipates relative frequencies in empirical-probability experiments.
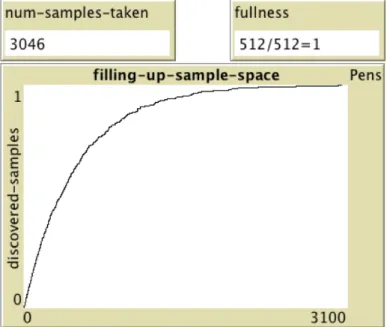
Figure 3. Fragment from NetLogo ProbLab model Sample Stalagmite. As the simulation searches for all items of a sample space, an accompanying graph (see Figure 3, above) plots the number of discovered samples against the number of attempts. This graph invariably shapes out logarithmically. The graph is
designed to support inquiry into advanced aspects of probability: Why is it that all searches for the combinatorial sample space of all 9-blocks invariably take on this shape?; Why does it take over 3000 trials to find 512 items?; Is this 6:1 ratio between trials and items significant?; Will this ratio repeat over experimental runs?: If not, why not?; Will this ratio repeat for a sample space of size 16 (4-blocks)?; What other phenomena in the world might give rise to a graph of this shape?; How should we call this graph? These questions are nontrivial, especially when cast in terms of moving between agent and aggregate perspectives: If each specific combination is equally likely to be sampled on each turn, why is it that “the last ones are always left behind for so long?”
Classroom Research
For this particular study, we investigated a potential mapping between the distribution of experimental outcomes and the “distribution” of students in the classroom. The rationale is that just as a single student can take enough samples so that the shape of the outcome distribution stabilizes, so all students can each take fewer samples that do not stabilize unless all students pool their samples.
Specifically, we explored whether such a students-to-samples mapping could be leveraged so as to stimulate inquiry-based classroom discussion.
We chose a design-based research framework (Cobb, Confrey, diSessa, Lehrer, & Schauble, 2003) so as better to investigate student early knowledge and difficulty in the domain of probability and statistics as well as to develop classroom learning supports that embrace this early knowledge and address these difficulties. Through iterated studies that began with individual students and focus groups and continued with classroom implementations, we are progressively modifying our computer-based models in response to feedback from students and teachers. Such collaboration between designers, programmers, researchers, students, and teachers, we find, is fruitful towards creating equitable and effective learning tools that may effect immediate changes in many students’ mathematical inclination and content knowledge. This report focuses on data from a single implementation along this design-research continuum.
Twenty-six 8th-grade students in a highly diverse urban school participated in an implementation of ProbLab over two weeks (half the time spent in a computer lab). Each student worked on an individual computer. Students used printed activity guides that moved from structured introductions to student-initiated experiments, and they could also modify the underlying code of the model. The researchers–facilitators and teacher moved between students for on-the-fly interviews. Each lesson included a classroom discussion. Due to the limited number of available computers, we split the students into two groups. This inadvertent staggering of the implementation proved fortuitous in that it allowed us an extra round of improvements. We videotaped all lessons both with a roaming and a classroom-spanning camera. We selected and transcribed discussion episodes to investigate how best to support students’ making
sense of their experiments as they move between their personal findings and classroom pooled findings.
Results and Discussion
Analysis of classroom discussion suggests that students are intrigued and stimulated by their interaction with the models. Following, we present two data examples. In both examples, students discuss with a facilitator outcomes from a probability experiment in Sample Stalagmite. The sampling of red or green squares had been framed as a “competition” between the two colors. Students had been asked to set the probability of red at 50%, to run the model ten times, and report their
findings in terms of the ratio of red and green “wins.” In the first example, the facilitator is working only with two students, and in the second example the entire classroom is discussing their results. Note that, whereas in the first example (two students) students must conjecture as to the outcomes of large numbers of trials, in the second example (classroom) students’ pooled outcomes allow for a cogent empirical finding.
Data Example #1: “On-the-fly” interview between a facilitator and two students.
Reuven: What’s happening here?
Student1: …more green than blue. I think the green is going to win.
R: What’s the chance that green will win?
Student1: 50–50.
R: Right. Is it possible that you do this experiment 100 times and green will win every time?
Student1: If it’s like once every f…
R: …if it’s 50–50. Let’s say the probability is 50%. Is it possible for the green to win every time?
Students1+2: No. I don’t think it is.
R: Would it be possible for green to win if you do it…once?
Student1: Yes.
R: Would it be possible for green to win if you do it twice?
Student1: Yes.
R: Would it be possible for green to win five times?
Student1: No.
R: Wait, so what about 3 or 4? Where’s the cutoff?
Student1: It’s rare.
R: Aha! It’s rare, ok. But if I were to flip a coin a 1000 times, is it possible that it will always come out ‘heads’?
Student1: Yeah.
Student2: It will be like a miracle.
R: It will be like a miracle, but is it possible?
Student2: No.
R: Why is it not possible?
Student1: Because it’s a 50–50 chance.
Student2: Well, maybe if you do it 1000 that will be your ‘50,’ and then if you
do it another thousand, that will be your other 50. [Both laugh]
Data Example #2: In a classroom summary discussion, Toby had been remonstrating that “there’s something wrong with the computer.”
Toby: The probability is 50–50 [in the setting of the model], so they [the
red/green outcomes] should be really close to each other, as in like it would be 4 red and 6 greens. But that’s not we had—we had like 2 red and 8 greens. So they were pretty far away from each other.
Dor: That is pretty far away. Were you having this all the time?
Toby: Yeah, the greens kept on winning.
Mogu: [He had worked closely with Toby] Most of the time.
Dor: [addressing classroom] Hands up whoever had the greens winning most of the time. [about half of the class] Ok, now hands up whoever had the reds winning. [the other half of the class] Does that make sense?
Toby: Yeah. [Dor proceeds to elicit outcomes and plot them as a distribution] Thus, classroom discussions allowed students to share unanticipated findings from their individual experiments and re-interpret and reconcile these findings through the lens of classroom sample distributions. We concluded that probability-related simulation-based classroom activities can be designed so as to leverage and explore the randomness that is intrinsic to the content through collaborative
discussion-based inquiry. When students each take a limited number of random samples, they are stimulated by their individual “wrong” outcomes to compare and compile their results as a cross-student sample-mean distribution. We have named the contextualization of the central-limit theorem in collaborative inquiry “The Law of Large Social Numbers.”
A promising finding is that many students appeared eager to modify the
computer procedures. These students wished to individualize the appearance of their experimental environment. In particular, the students wanted to change the colors of objects on the screen. In terms of programming, this may appear as a small step, yet we believe that the act of “looking under the hood” is critical—it constitutes an easy entrance activity that allays any student apprehension of programming and creates personal precedents and a strong sense of appropriation and accomplishment.
In future studies, we will focus on: (a) understanding the conditions that best support students in linking concrete and computer-based objects; (b) the affect of printed activity guides in terms of creating shared classroom understandings and vocabulary, stimulating explorative inquiry, and facilitating opportunities for teacher attention to individual students; (c) whether more students with little if any programming experience could be drawn to modifying the computer procedures underlying the models and how such work may inform their content learning; and (d) developing a more comprehensive articulation of student understanding of the interplay of determinism (the settings of the
computer model) and randomness (the specific outcomes) and how this interplay informs student cognition of the central limit theorem.
*Acknowledgement: The design research described in this paper was supported in
part by the National Science Foundation under Grant No. REC-0126227. The
opinions expressed in this paper are those of the authors and do not necessarily reflect the views of NSF.
References:
Abrahamson, D. (2004). Keeping meaning in proportion: The multiplication table as a case of pedagogical bridging tools. Unpublished doctoral dissertation,
Northwestern University, Evanston, IL.
Abrahamson, D. & Wilensky, U. (2002). ProbLab. The Center for Connected
Learning and Computer-Based Modeling, Northwestern University, Evanston, IL.
http://ccl.northwestern.edu/curriculum/ProbLab/
Abrahamson, D. & Wilensky, U. (2003). The quest of the bell curve: A
constructionist approach to learning statistics through designing computer-based probability experiments. Proceedings of the Third Conference of the European Society for Research in Mathematics Education, Bellaria, Italy, Feb. 28 – March 3, 2003. http://ccl.northwestern.edu/cm/papers/bellcurve/
Abrahamson, D. & Wilensky, U. (2004). S.A.M.P.L.E.R.: Collaborative interactive computer-based statistics learning environment. Proceedings of the 10th
International Congress on Mathematical Education, Copenhagen, July 4 – 11, 2004.
http://ccl.northwestern.edu/papers/Abrahamson_Wilensky_ICME10.pdf
Biehler, R. (1995). Probabilistic thinking, statistical reasoning, and the search of causes. Newsletter of the international study group for research on learning probability and statistics, 8(1). (Accessed December 12, 2002)
http://seamonkey.ed.asu.edu/~behrens/teach/intstdgrp.probstat.jan95.html
Brousseau, G. (1997). Theory of didactical situations in mathematics (N. Balacheff, M. Cooper, R. Sutherland, & V. Warfield, Eds. & Trans.). Boston: Kluwer Academic Publishers.
Cobb, P., Confrey, J., diSessa, A., Lehrer, R., & Schauble, L. (2003). Design experiments in educational research. Educational Researcher 32(1), 9 – 13. Freudenthal, H. (1983). Didactical phenomenology of mathematical structure.
Dordrecht, The Netherlands: Kluwer Academic Publishers.
Gigerenzer, G. (1998). Ecological intelligence: An adaptation for frequencies. In D. D. Cummins & C. Allen (Eds.), The evolution of mind (pp. 9 – 29). Oxford: Oxford University Press.
Hacking, I. (1975). The emergence of probability. Cambridge: Cambridge University Press.
Hacking, I. (2001). An introduction to probability and inductive logic. Cambridge, UK: Cambridge Press.
Konold, C. (1994). Understanding probability and statistical inference through
resampling. In L. Brunelli & G. Cicchitelli (Eds.), Proceedings of the First Scientific Meeting of the International Association for Statistical Education (pp. 199 – 211). Perugia, Italy: Università di Perugia.
Liu, Y., & Thompson, P. (2002). Randomness: Rethinking the foundation of probability. In D. Mewborn, P. Sztajn, E. White, H. Wiegel, R. Bryant, and K. Nooney (Eds.), Proceedings of the Twenty Fourth Annual Meeting of the North American Chapter of the International Group for the Psychology of Mathematics Education, Athens, GA, October 26-29, 2002: Vol. 3 (pp. 1331–1334). Columbus, OH: Eric Clearinghouse for Science, Mathematics, and Environmental Education.
Maher, C.A., Speiser, R., Friel, S., & Konold, C. (1998). Learning to reason probabilistically. Proceedings of the twentieth annual conference of the North American group for the Psychology of Mathematics Education (pp. 82 – 87). Raleigh, NC.
Papert, S. (1980). Mindstorms. NY: Basic Books.
Papert, S. (1996). An exploration in the space of mathematics educations.
International Journal of Computers for Mathematical Learning, 1(1), 95 –123. Resnick, L. B. (1992). From protoquantities to operators: Building mathematical
competence on a foundation of everyday knowledge. In G. Leinhardt, R. Putnam & R. A. Hattrup (Eds.), Analysis of arithmetic for mathematics teaching (pp. 373 – 429). Hillsdale, NJ: Lawrence Erlbaum.
von Mises, R. (1981). Probability, statistics, and truth (J. Neyman, D. Scholl, & R. Rabinowitsch, Trans.). Dover Publications. (Original work published in 1928).
Wilensky, U. (1993). Connected mathematics—Building concrete relationships with mathematical knowledge. Doctoral thesis, M.I.T.
Wilensky, U. (1995). Paradox, programming and learning probability. Journal of Mathematical Behavior. 14(2), 231 – 280.
Wilensky, U. (1997). What is normal anyway?: Therapy for epistemological anxiety. Educational Studies in Mathematics 33(2) 171 – 202.
Wilensky, U. (1999). NetLogo. Evanston, IL. Center for Connected Learning and Computer Based Modeling, Northwestern University.