1071-412X/00/$04.00⫹0
Copyright © 2000, American Society for Microbiology. All Rights Reserved.
Multisite Comparison of CD4 and CD8 T-Lymphocyte Counting by
Single- versus Multiple-Platform Methodologies: Evaluation of
Beckman Coulter Flow-Count Fluorospheres
and the tetraONE System
KEITH A. REIMANN,1* MAURICE R. G. O’GORMAN,2JOHN SPRITZLER,3CYNTHIA L. WILKENING,3
DANIEL E. SABATH,4KAREN HELM,5DONALD E. CAMPBELL,6ANDTHE NIAID DAIDS
NEW TECHNOLOGIES EVALUATION GROUP†
Division of Viral Pathogenesis, Beth Israel Deaconess Medical Center, Harvard Medical School,1and Harvard School of Public Health,3Boston, Massachusetts; Children’s Memorial Hospital, Northwestern University, Chicago, Illinois2;
University of Washington, Seattle, Washington4; University of Colorado Health Sciences Center, Denver, Colorado5; and Children’s Hospital of Philadelphia, Philadelphia, Pennsylvania6
Received 22 February 1999/Returned for modification 23 April 1999/Accepted 18 August 1999
New analytic methods that permit absolute CD4 and CD8 T-cell determinations to be performed entirely on the flow cytometer have the potential for improving assay precision and accuracy. In a multisite trial, we compared two different single-platform assay methods with a predicate two-color assay in which the absolute lymphocyte count was derived by conventional hematology. A two-color method employing lymphocyte light scatter gating and Beckman Coulter Flow-Count fluorospheres for absolute counting produced within-labo-ratory precision equivalent to that of the two-color predicate method, as measured by coefficient of variation of replicate measurements. The fully automated Beckman Coulter tetraONE System four-color assay employ-ing CD45 lymphocyte gatemploy-ing, automated analysis, and absolute countemploy-ing by fluorospheres resulted in a small but significant improvement in the within-laboratory precision of CD4 and CD8 cell counts and percentages suggesting that the CD45 lymphocyte gating and automated analysis might have contributed to the improved performance. Both the two-color method employing Flow-Count fluorospheres and the four-color tetraONE System provided significant and substantial improvements in between-laboratory precision of absolute counts. In some laboratories, absolute counts obtained by the single-platform methods showed small but consistent differences relative to the predicate method. Comparison of each laboratory’s absolute counts with the five-laboratory median value suggested that these differences resulted from a bias in the absolute lymphocyte count obtained from the hematology instrument in some laboratories. These results demonstrate the potential for single-platform assay methods to improve within-laboratory and between-laboratory precision of CD4 and CD8 T-cell determinations compared with conventional assay methods.
The progressive loss of CD4⫹T lymphocytes (CD4 T cells) through virally mediated cell destruction is the predominant pathophysiological manifestation of human immunodeficiency virus type 1 (HIV-1) infection (15). Enumeration of this cell subset provides an estimate of HIV disease progression (17). A major component of the immune response to HIV-1 infection is mediated by CD8⫹T lymphocytes (CD8 T cells) (6). CD8 T cells capable of suppressing HIV-1 replication adopt an acti-vation phenotype and appear in increased numbers in the blood and other body compartments following infection (7, 19). Therefore, the CD4 and CD8 T cells in blood are
fre-quently quantified to assess immune competence and disease stage in HIV-1-infected patients. Furthermore, changes in CD4 T-cell numbers are an important estimate of the response to antiretroviral therapy. The CD4 T-cell count remains the most important immunologic surrogate marker of the efficacy of new antiretroviral regimens used in clinical trial evaluations (9). The accurate quantitation of these cells in blood is crucial for providing clinical care to HIV-1-infected patients and for the systematic evaluation of new therapeutic modalities. How-ever, previous studies have identified substantial variability in results between laboratories performing these assays (1, 5).
The currently recommended method for CD4 T-cell deter-mination (2, 3) utilizes three independently derived values from two different instruments: a white blood cell (WBC) count and percent lymphocytes derived from a hematology instrument, and percentage of CD4 or CD8 T cells derived from a flow cytometer. A major disadvantage of this multiple-platform assay method is that error in each independent mea-surement is multiplied at each subsequent step in the calcula-tion.
Recently, new analytic methods have emerged that permit absolute CD4 and CD8 T-cell determinations to be performed either using a single-determination, non-flow cytometry-based assay (8, 10, 11) or entirely on the flow cytometer (14). In the single-platform flow cytometry-based techniques,
fluoro-* Corresponding author. Mailing address: Beth Israel Deaconess Medical Center, RE-113, P.O. Box 15732, Boston, MA 02215. Phone: (617) 667-4583. Fax: (617) 667-8210. E-mail: kreimann@caregroup .harvard.edu.
† M. O’Gorman, Chairman, Northwestern University, Chicago, Ill.; E. Bessent, University of California, San Diego; S. Plaeger, University of California, Los Angeles; A. Donnenberg and S. Douglas, Children’s Hospital of Philadelphia, Philadelphia, Pa.; F. Mandy, Bureau for HIV/AIDS and STD, Health Canada, Ottawa, Canada; J. Nicholson, Centers for Disease Control and Prevention, Atlanta, Ga.; K. Reimann, Beth Israel Deaconess Medical Center, Boston, Mass.; J. Schmitz, University of North Carolina; Chapel Hill; C. Schnizlein-Bick; Indiana University, Indianapolis; J. Kagan and D. Livnat, DAIDS/NIAID/National Institutes of Health, Bethesda, Md.
344
on August 17, 2020 by guest
http://cvi.asm.org/
spheres are added to the blood at a known concentration. Absolute cell counts in each specimen can be calculated ratio-metrically by simultaneously counting both fluorospheres and the cells of interest (18). Other technological improvements, including automated instrument setup, lymphocyte gating, and cursor placement, could also improve assay performance. In the present study, we have assessed the within-laboratory and between-laboratory precision of two alternative assay methods: a two-color method that uses Beckman Coulter Flow-Count fluorospheres to determine absolute counts, and a four-color method that uses the fully automated tetraONE System. The precision obtained with these alternative methods was com-pared with the precision obtained with a conventional multi-ple-platform assay method. We also assessed the accuracy of these two new assay methods by comparing the absolute counts obtained with the single-platform methods and with the con-ventional multiple-platform method.
MATERIALS AND METHODS
Sites.All five sites that participated in this study were clinical flow cytometry laboratories that performed lymphocyte immunophenotyping for the AIDS Clin-ical Trials Group and were certified by the National Institute of Allergy and Infectious Disease (NIAID) Division of AIDS Flow Cytometry Certification Program (2). All laboratories had extensive experience in performing clinical
immunophenotyping for CD4⫹and CD8⫹T lymphocytes by conventional
meth-ods but had no prior experience with the new, single-platform methmeth-ods evaluated in this study. Before participating in this study, workers in each laboratory underwent a 2-day on-site training in the new methods by a representative from Beckman Coulter. At each site, assays were performed by one laboratory tech-nologist except for lab D, where study data were generated by three different technologists.
Instrumentation.The hematology instruments used for determining absolute lymphocyte counts varied at the five sites and included a Coulter STK-S, a Technicon H2, a Sysmex HST430, and an Abbott CellDyn 3500 at labs A and D, B, C, and E, respectively. All laboratories performed flow cytometric analyses with the Beckman Coulter EPICS XL flow cytometer (Beckman Coulter, Miami, Fla.) using System II software and tetraONE System (version 1.0; Beckman Coulter). Specimen preparation was performed on the Multi-Q-Prep worksta-tion (Beckman Coulter). All pipetting was performed with a positive-displace-ment Eppendorf Repeater pipetter (Brinkmann Instrupositive-displace-ments, Westbury, N.Y.).
Reagents.All reagents were provided by Beckman Coulter and used as rec-ommended by the manufacturer.
Specimens.To measure within-laboratory precision, specimens were obtained locally at each site from HIV-1-infected donors after informed consent was obtained (hereafter referred to as local specimens). Laboratories were requested
to obtain specimens from seven donors with CD4 T cell counts of⬍200 cells/l
and seven with CD4 T cell counts of⬎200 cells/l. Blood was drawn directly into
evacuated blood collection tubes containing EDTA and delivered to the labo-ratory within 1 h. To measure between-labolabo-ratory precision, specimens were obtained from HIV-1-infected donors by a central contractor (FAST Systems, Inc., Gaithersburg, Md.). We attempted to obtain an equivalent number of
specimens representing the following three CD4 T-cell count strata:⬍200 cells,
200 to 500 cells, and⬎500 cells. Blood was drawn directly into evacuated blood
collection tubes containing EDTA and then shipped at ambient temperature by overnight courier service to each site (hereafter referred to as central speci-mens). Confirmation of HIV-1 infection status was made by routine clinical serology. The number of specimens analyzed in the comparison of within-labo-ratory precision and between-labowithin-labo-ratory precision studies was chosen to provide an 80% power to detect shifts in percent coefficient of variation (%CV) or in median CD4 or CD8 T-cell counts. These calculations were based on variability estimates from a previous study (11).
Flow cytometric immunophenotyping for CD4ⴙand CD8ⴙT lymphocytes.All
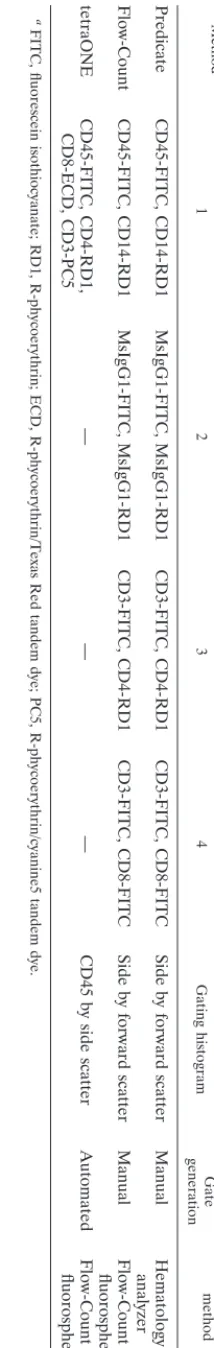
local and central blood specimens were analyzed by three different methods (summarized in Table 1). Each site performed these assays in one of three different orders for the entire study.
(i) Predicate method.Absolute lymphocyte counts were determined as the product of the WBC count and percent lymphocyte differential as measured by the hematology instruments. Flow cytometer alignment, calibration, and spectral compensation were performed according to each individual laboratory’s
operat-ing procedure. For specimen preparation, 100l of EDTA-anticoagulated blood
was incubated with premixed antibodies for 20 min and erythrocytes were lysed with the ImmunoPrep reagent system (Beckman Coulter) on a Multi-Q-Prep work station and analyzed within 6 h of lysis. The percentage of lymphocytes expressing CD3 and CD4 or CD3 and CD8 was determined according to the published guidelines for Flow Cytometric Immunophenotyping (2, 3). A lym-phocyte light scatter gate (scattergate) was manually drawn on a dot plot of side versus forward light scatter parameters. The lymphocyte scattergate was adjusted
TABLE
1.
Description
of
methods
evaluated
Method
Tubes
a
Lymphocyte
gating
Absolute-count
method
1
2
3
4
Gating
histogram
Gate
generation
Predicate
CD45-FITC,
CD14-RD1
MsIgG1-FITC,
MsIgG1-RD1
CD3-FITC,
CD4-RD1
CD3-FITC,
CD8-FITC
Side
by
forward
scatter
Manual
Hematology
analyzer
Flow-Count
CD45-FITC,
CD14-RD1
MsIgG1-FITC,
MsIgG1-RD1
CD3-FITC,
CD4-RD1
CD3-FITC,
CD8-FITC
Side
by
forward
scatter
Manual
Flow-Count
fluorospheres
tetraONE
CD45-FITC,
CD4-RD1,
CD8-ECD,
CD3-PC5
—
—
—
CD45
by
side
scatter
Automated
Flow-Count
fluorospheres
a
FITC,
fluorescein
isothiocyanate;
RD1,
R-phycoerythrin;
ECD,
R-phycoerythrin/Texas
Red
tandem
dye;
PC5,
R-phycoerythrin/cyanine5
tandem
dye.
on August 17, 2020 by guest
http://cvi.asm.org/
to meet or exceed the guidelines’ target percent purity (⬎85%) and percent
recovery (⬎90%) using CD45 and CD14 expression (2, 3). The percentages of
CD3⫹CD4⫹and CD3⫹CD8⫹lymphocytes within the total lymphocyte light
scattergate were determined by using the two-color antibody combinations de-scribed in Table 1 and adjusted for purity by dividing the measured subset
percentage by the percent purity. Absolute CD3⫹CD4⫹and CD3⫹ CD8⫹
lymphocyte counts (herein referred to as CD4 T-cell counts and CD8 T-cell counts, respectively) were calculated by multiplying the specific subset percent-age by the absolute lymphocyte count.
(ii) Flow-count method.The percentages of CD3⫹CD4⫹and CD3⫹CD8⫹
lymphocytes were determined by using a manually drawn lymphocyte scattergate and two-color immunofluorescence as described for the predicate method above.
Immediately prior to analysis, 100l of Flow-Count fluorospheres (Beckman
Coulter) were added to each lysed specimen. Absolute CD4 and CD8 T-cell counts were automatically determined by the System II software using the ratio
of CD3⫹CD4⫹or CD3⫹CD8⫹lymphocytes to fluorospheres counted using the
following formula: cells per microliter⫽[(cells counted)/(fluorospheres
count-ed)]⫻fluorospheres/microliter.
(iii) tetraONE method.The tetraONE System (Beckman Coulter) consists of a fully automated software-reagent combination that performs CD4 and CD8 T-cell counts by four-color analysis on the EPICS XL flow cytometer. In this integrated software-reagent system, instrument standardization and spectral compensation are performed automatically by analysis of four tubes of bead standards or fluorochrome-stained reference cells prior to specimen analysis. For
each specimen, 100l of EDTA-anticoagulated blood was incubated with 10l
of tetraCHROME reagent containing the four antibody-fluorochrome combina-tions described in Table 1. Specimens were then lysed as described above on a
Multi-Q-Prep work station. Immediately prior to analysis, 100l of Flow-Count
fluorospheres was added to each tube. Tubes were placed into an autoloading carousel, and sample acquisition and analysis were performed automatically by the tetraONE System software. A lymphocyte gate was determined automatically
using CD45 fluorescence and side scatter parameters. The percentages of CD3⫹
CD4⫹and CD3⫹CD8⫹lymphocytes within the lymphocyte gate were reported.
Absolute CD4 and CD8 T-cell counts were automatically calculated using the ratio of cells to fluorospheres as described above for the Flow-Count method.
Data review and exclusion.All histograms from the hematology analyzers and flow cytometers were reviewed by operators for consistent light scatter and fluorescence patterns prior to reporting data. Data were considered unusable for the following reasons: (i) inability to generate an absolute lymphocyte count on the hematology instrument, (ii) absence of detectable fluorescence (e.g., no antibody added), and (iii) incomplete or abnormal lysis of erythrocytes, as de-termined by observing abnormal light scatter patterns or differences in CD3% of
⬎5 percentage points between tubes. Analyses that failed to yield usable results
for these reasons accounted for less than 1% of the total data collected. Data for central specimens that were deemed unusable at one site were excluded from all sites. Of 75 central specimens that arrived on time, 8 were excluded from analysis at all sites for the reasons described above.
Within-laboratory precision.To compare the within-laboratory precision of the three assay methods, each site attempted to obtain local specimens from 14 HIV-positive donors in which half of the specimens had a CD4 T-cell count of
⬎200 cells/l and half had a CD4 T-cell count of⬍200 cells/l. A total of eight
tubes (5 ml each) of blood were drawn sequentially from each donor. Four tubes were used for “fresh” analysis, where eight replicate analyses (two analyses for each of four tubes) were performed by all three methods within 6 h of blood collection. The remaining four tubes were held at ambient temperature over-night, and the identical eight replicate analyses were performed by all three methods. Analysis of “aged” specimens was performed 22 to 33 h after blood collection.
Between-laboratory precision.Each site received identical amounts of 103 blood specimens obtained by a central contractor. Equivalent representation of
donors in the following CD4 T-cell count strata was attempted:⬍200 cells/l,
200 to 500 cells/l, and⬎500 cells/l. Each central specimen was analyzed at
each site by all three methods within 36 h of blood collection.
Accuracy of absolute counts.We calculated the differences in absolute counts between each single-platform method and the predicate method to determine the extent of agreement between the new and predicate methods using the central specimens that had been assayed at each site. Differences between new and predicate methods were plotted for each laboratory. We also attempted to assess whether differences between new and predicate methods in individual laboratories were due to assay biases in the predicate or the single-platform methods. For each specimen, we calculated the difference between the individual laboratory’s absolute CD4 or CD8 T-cell count and the median absolute count from all five laboratories. Deviations from the median value were plotted for each laboratory by method.
Statistical analyses.Variability was determined by using the %CV. Determi-nation of significant differences between the variability of the Flow-Count method and the predicate method and between the tetraONE method and the predicate method were based on the Wilcoxon rank sum test. This test was applied to the %CVs of CD4 and CD8 T-cell counts and the %CVs of CD4 and CD8 T-cell percentages for each specimen (between laboratories for central specimens and among replicates for local specimens). Comparisons of the dif-ferences in absolute counts (and percentages) between the Flow-Count method and the predicate method and between the tetraONE method and the predicate method were based on the Wilcoxon rank sum test applied to the CD4 and CD8 T-cell counts (and percentages) for each specimen at each laboratory, stratifying by donor in the case of local specimens. The same test was used to compare the differences in absolute counts (and percentages) between specimens analyzed fresh and the same specimens analyzed after 22 to 33 h (using the same analytical
method). A Bonferroni correction for multiple testing (k⫽2, statistical
signif-icance defined asP⬍0.025) was used to adjust for comparing both the
Flow-Count and tetraONE methods with the same predicate method results.
RESULTS
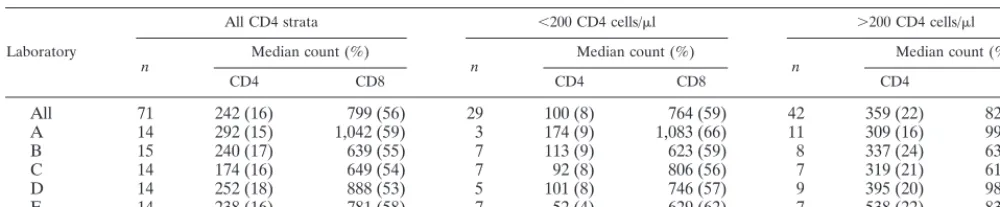
Description of data. (i) Local specimens. All laboratories analyzed specimens fromⱖ14 local donors, and a description of these specimens is shown in Table 2. Despite a protocol requesting that each laboratory recruit an equivalent number of donors with CD4 T-cell counts of⬎200 cells/l and⬍200 cells/l, two laboratories (A and D) obtained fewer than seven specimens from donors having⬍200 CD4 T cells/l.
(ii) Central specimens.Of 103 central specimens shipped by the central contractor, 87 were received by all sites within 33 h of collection. Of the 87 specimens received on time, usable data were generated by all sites on 67 specimens comparing the predicate and Flow-Count methods and on 71 specimens com-paring the predicate and tetraONE methods (Table 3). All three CD4 T-cell strata were represented in these specimens. However, the CD4⬎500 cells/l stratum was somewhat un-derrepresented (⬍20% of all specimens).
Within-laboratory precision. (i) Flow-Count method versus predicate method.Eight replicates of each local specimen were analyzed by both the predicate and Flow-Count methods within 6 h of specimen collection. The precision of absolute CD4 and CD8 T-cell counts and percentages was determined for each method by calculating the %CV from the replicate measurements of each specimen. As shown in Table 4, the median %CV for absolute CD4 and CD8 T-cell counts ob-tained by the Flow-Count method were usually similar or lower
TABLE 2. Summary of statistics for local specimens analyzeda
Laboratory
All CD4 strata ⬍200 CD4 cells/l ⬎200 CD4 cells/l
n Median count (%) n Median count (%) n Median count (%)
CD4 CD8 CD4 CD8 CD4 CD8
All 71 242 (16) 799 (56) 29 100 (8) 764 (59) 42 359 (22) 821 (51)
A 14 292 (15) 1,042 (59) 3 174 (9) 1,083 (66) 11 309 (16) 993 (58)
B 15 240 (17) 639 (55) 7 113 (9) 623 (59) 8 337 (24) 639 (44)
C 14 174 (16) 649 (54) 7 92 (8) 806 (56) 7 319 (21) 617 (43)
D 14 252 (18) 888 (53) 5 101 (8) 746 (57) 9 395 (20) 980 (48)
E 14 238 (16) 781 (58) 7 52 (4) 629 (62) 7 538 (22) 837 (53)
aThe median number of cells per microliter (median percentage) was determined by the predicate method 22 to 33 h after collection.
on August 17, 2020 by guest
http://cvi.asm.org/
than the %CV for results obtained by the predicate method but did not differ significantly. As expected, the median %CV for percentage of CD4 and CD8 T cells obtained by the Flow-Count and predicate methods (Table 5) were nearly identical, since both of these methods calculated CD4 and CD8 T-cell percentages using a two-color assay with a manually drawn lymphocyte light scatter gate. These results suggest that the use of Flow-Count fluorospheres for absolute cell counting re-sulted in overall within-laboratory precision that was equiva-lent to that obtained using the predicate method.
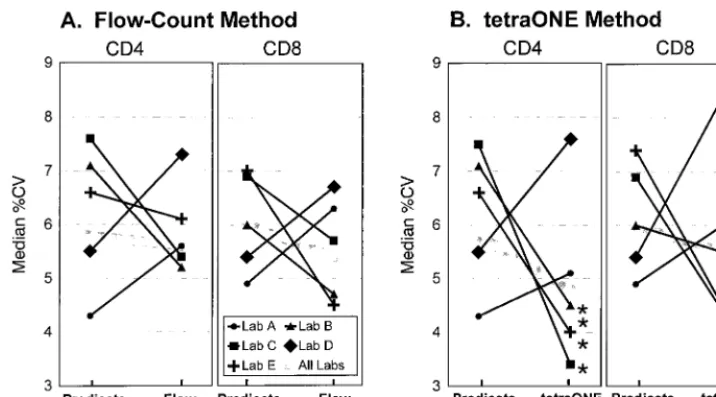
There was considerable variation between laboratories in the relative precision achieved by these two methods. In three laboratories, the median %CV was lower for the Flow-Count method than for the predicate method. In the other two lab-oratories, the median %CV was lower for the predicate method (Fig. 1A). However, differences in precision between methods were never statistically significant. Of note, the two laboratories whose CD4 and CD8 T-cell counts were less pre-cise by the Flow-Count than by the predicate method also had the lowest %CV by the predicate method (Fig. 1A).
(ii) tetraONE method versus predicate method.The preci-sion in CD4 and CD8 T-cell absolute counts and percentages obtained by the four-color tetraONE method was compared with that of the predicate method in the manner described above. As shown in Table 4, the %CV for both absolute CD4 and CD8 T-cell counts was significantly lower for values ob-tained by the tetraONE method than for those obob-tained by the
predicate method. This improved precision for both CD4 and CD8 T-cell subsets occurred predominantly in specimens with CD4 T cell counts of⬍200 cells/l. Within this stratum, %CVs decreased overall by 1 to 2%. While statistically significant, the improvement in precision was relatively small. The tetraONE method, which employed an automated CD45 lymphocyte gat-ing strategy, also resulted in significantly lower %CV for CD4 and CD8 T-cell percentages (predominantly in the⬍200 CD4 T-cell count stratum) compared with the predicate method (Table 5). Thus, use of the tetraONE method resulted in a small but significant improvement in the within-laboratory pre-cision of CD4 and CD8 T-cell counts and percentages over the predicate method.
Striking differences were observed in the relative precision that individual laboratories obtained by the tetraONE and predicate methods. Of the five participating laboratories, three showed a lower median %CV with the tetraONE method than with the predicate method for absolute CD4 or CD8 T-cell counts (Fig. 1B). However, in two laboratories, the tetraONE method resulted in a higher median %CV than the predicate method. The two laboratories that obtained poorer perfor-mance with the tetraONE method were the same laboratories in which poorer performance occurred with the Flow-Count method.
(iii) Fresh versus aged specimens. The effect of overnight aging of specimens on assay precision and on absolute CD4 and CD8 T-cell counts was also assessed with the local speci-mens. To measure the effect on precision, we determined the %CV of the absolute CD4 and CD8 T-cell counts for speci-mens analyzed within 6 h of drawing and compared that with the %CV observed for the same specimens analyzed between 24 and 33 h after drawing (all CD4 strata combined). There were no significant differences in assay precision (i.e., %CV) when fresh and aged specimens were analyzed by either the predicate or the Flow-Count method. Aging also had no effect on the precision of CD8 T-cell counts obtained by the tetra-ONE method. The %CV of absolute CD4 T-cell counts ob-tained using the tetraONE method was significantly greater for aged specimens than for fresh specimens. However, the me-dian increase in %CV was small (⬍1%), and despite this in-crease, the median %CV for CD4 T-cell counts on aged spec-imens analyzed by the tetraONE method was still smaller than the median %CV for fresh specimens analyzed by the predi-cate or Flow-Count method (data not shown).
The overnight aging of specimens resulted in very small but statistically significant changes in absolute CD4 and CD8 T-cell counts, as measured by both the Flow-Count and tetra-ONE methods (median change in CD4 and CD8 T-cell counts
TABLE 5. Comparison of within-laboratory precision of CD4 and CD8 T-cell percentages for predicate method versus Flow-Count
and tetraONE methodsa
T cells stratumCD4
(cells/l)
Median %CV (Pvs predicate method)
Predicate
method Flow-Countmethod tetraONEmethod
CD4 All 4.1 4.5 (0.530) 3.7 (0.001)
⬍200 6.5 6.0 (0.863) 4.3 (0.001) ⬎200 3.4 3.3 (0.240) 3.0 (0.225)
CD8 All 1.9 1.8 (0.515) 1.8 (0.268)
⬍200 1.8 2.0 (0.697) 1.5 (0.016) ⬎200 1.9 1.8 (0.565) 2.0 (0.565)
aSee Table 4, footnotea.
TABLE 3. Summary statistics for central specimens analyzed
Method CD4 stratum(cells/l) n
Median count
(median %)a
CD4 CD8
Flow-Count All 67 265 (20) 734 (56)
⬍200 25 141 (14) 561 (56)
200–500 33 319 (22) 834 (58)
⬎500 9 600 (33) 911 (42)
tetraONE All 71 279 (20) 756 (56)
⬍200 25 142 (14) 572 (56)
200–500 34 320 (22) 851 (58)
⬎500 12 611 (34) 895 (41)
aMedian cells per microliter (median percentage) by the predicate method for
all laboratories combined.
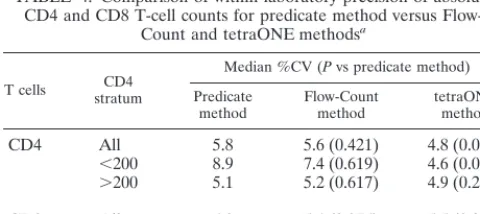
TABLE 4. Comparison of within-laboratory precision of absolute CD4 and CD8 T-cell counts for predicate method versus
Flow-Count and tetraONE methodsa
T cells stratumCD4
Median %CV (Pvs predicate method)
Predicate
method Flow-Countmethod tetraONEmethod
CD4 All 5.8 5.6 (0.421) 4.8 (0.002)
⬍200 8.9 7.4 (0.619) 4.6 (0.002) ⬎200 5.1 5.2 (0.617) 4.9 (0.288)
CD8 All 6.0 5.4 (0.076) 5.5 (0.017)
⬍200 7.6 5.3 (0.066) 5.8 (0.004) ⬎200 5.4 5.5 (0.599) 5.2 (0.516)
a%CVs were calculated from eight replicates of each specimen at 6 h.
Rep-licate analyses were performed by each method. %CVs in Flow-Count and tetraONE methods were compared with %CV from the predicate method as
described in Materials and Methods. APvalue of⬍0.025 was considered
sig-nificant.
on August 17, 2020 by guest
http://cvi.asm.org/
for the Flow-Count method was⫺7 and⫺18 cells/l, respec-tively, and for the tetraONE method it was⫺4 and⫹9 cells/l, respectively). Aging had no effect on absolute CD4 T-cell counts determined by the predicate method. However, by the predicate method, aged specimens yielded significantly higher CD8 T-cell counts (median change,⫹18 cells/l) (data not shown).
Between-laboratory precision. (i) Flow-Count method ver-sus predicate method. The between-laboratory precision in absolute CD4 and CD8 T-cell counts was compared between the Flow-Count and predicate methods using central speci-mens that were analyzed at all five laboratories. The %CV was calculated from the values obtained in the five laboratories for each specimen by the different assay methods. Analysis of absolute CD4 and CD8 T-cell counts by the Flow-Count method resulted in significantly improved between-laboratory precision (Table 6). Compared with the predicate method, the Flow-Count method reduced between-laboratory %CV for absolute CD4 and CD8 T-cell counts by approximately 7%. There was a tendency toward greater decreases in %CV among specimens with lower CD4 counts. Significant
reduc-tions in between-laboratory %CV were observed for CD4 and CD8 T-cell counts on specimens in the⬍200 and 200 to 500 strata (Table 6). The %CV of the CD4 and CD8 T-cell per-centages did not vary significantly between these two assay methods (data not shown).
(ii) tetraONE method versus predicate method. Similar analyses were performed to compare the between-laboratory precision in absolute CD4 and CD8 T-cell counts by the tetra-ONE method and the predicate method. Compared with the predicate method, the tetraONE method also resulted in a significant reduction of between-laboratory %CV (Table 7). The magnitude of this reduction was similar to that observed in the Flow-Count method. The reduction in %CV occurred across all CD4 strata (Table 7). The %CVs of CD4 T-cell percentages did not differ significantly between the two meth-ods. However, the %CVs of CD8 T-cell percentages were slightly but significantly higher for tetraONE results than for predicate results (median difference in %CV, ⫹1.9%) (data not shown).
Accuracy of single-platform methods. The accuracy of the single-platform methods was determined by comparing results from the new methods with those obtained using the predicate method. Using results from the central specimens, subset
per-FIG. 1. Comparison of within-laboratory precision in absolute CD4 and CD8 T-cell counts between predicate method and single-platform methods by laboratory. Median %CVs are illustrated for each method from eight replicates ofⱖ14 specimens. (A) Flow-Count method versus predicate method; (B) tetraONE method versus predicate method.ⴱ, significantly different from predicate method,P⬍0.025.
TABLE 6. Comparison of between-laboratory precision in absolute T-cell counts for predicate method versus Flow-Count methoda
T cells CD4 stratum(cells/l) Median %CV (Pvs predicate method) Predicate method Flow-Count method
CD4 All 18.2 10.8 (0.000)
⬍200 19.5 12.0 (0.000)
200–500 16.7 9.4 (0.007)
⬎500 18.8 12.1 (0.055)
CD8 All 16.9 10.1 (0.000)
⬍200 18.1 10.8 (0.000)
200–500 15.5 7.9 (0.002)
⬎500 17.2 10.8 (0.098)
a%CVs were calculated from the same specimens analyzed by both methods
in all five laboratories. %CV by the predicate method was compared with %CV by the test method as described in Materials and Methods. APvalue of⬍0.025 was considered significant.
TABLE 7. Comparison of between-laboratory precision in absolute T-cell counts for predicate method versus tetraONE methoda
T cells CD4 stratum(cells/l) Median %CV (Pvs predicate method) Predicate method tetraONE method
CD4 All 18.2 9.6 (0.000)
⬍200 19.5 9.6 (0.001)
200–500 16.6 10.8 (0.001)
⬎500 19.8 9.5 (0.009)
CD8 All 16.9 12.1 (0.000)
⬍200 18.1 11.3 (0.000)
200–500 15.4 14.8 (0.356)
⬎500 18.8 10.8 (0.052)
aSee Table 6, footnotea.
on August 17, 2020 by guest
http://cvi.asm.org/
centages or absolute counts from the predicate method were subtracted from results derived by either the Flow-Count or tetraONE method to determine the direction and magnitude of the differences. Overall, there was good agreement between CD4 and CD8 T-cell percentages derived by the predicate method and those obtained using either the Flow-Count or tetraONE method. Median CD4 and CD8 T-cell percentages varied by less than 2 percentage points between predicate and Flow-Count or tetraONE except for laboratory D, in which the tetraONE method yielded a median CD8 T-cell percentage that was 4 percentage points lower than the median CD8 T-cell percentage from the predicate method (data not shown).
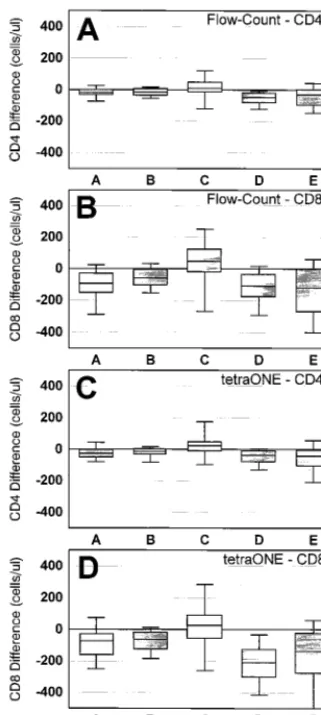
The differences in absolute counts between the predicate and single-platform methods by laboratory are shown in Fig. 2. Four laboratories (A, B, D, and E) produced absolute counts using the Flow-Count method that were slightly but consis-tently lower that the absolute counts derived by their predicate method (median absolute difference: CD4,⫺18 to⫺47 cells/l [Fig. 2A]; CD8,⫺48 to⫺112 cells/l [Fig. 2B]). The remaining laboratory (C) produced results using the Flow-Count method that were consistently higher than those derived by the predi-cate method (median absolute difference: CD4, ⫹7; CD8,
⫹42) (Fig. 2A and B). Interestingly, the identical pattern of differences was observed in each laboratory when absolute counts derived by their predicate method and tetraONE method were compared (Fig. 2C and D). The same laborato-ries (A, B, D, and E) produced results using the tetraONE method that were lower than their predicate method results (median absolute difference: CD4,⫺14 to⫺36 cells/l; CD8, ⫺30 to ⫺196 cells/l). The same remaining laboratory (C) produced higher absolute counts by the tetraONE method than with the predicate method (median absolute difference: CD4,⫹19; CD8,⫹22).
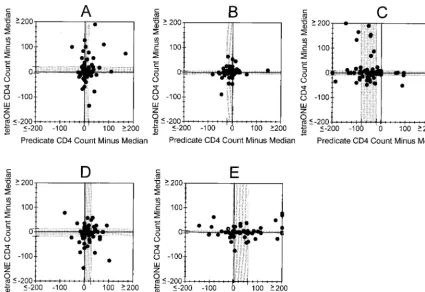
Source of difference in absolute counts between predicate and single-platform methods.The magnitude and direction of the differences we observed in absolute counts between either the Flow-Count or tetraONE method and the predicate method were consistent within each laboratory. However, it was unclear whether discrepancies in absolute counts between the predicate and single-platform methods occurred because one of the methods consistently yielded higher or lower results in an individual laboratory. In an attempt to determine the source of this bias, we compared the absolute count generated by each laboratory with the median absolute counts from all five laboratories for each method. This analysis assumed that the five-laboratory median absolute count would be closer to the actual absolute count than any individual mea-surement.
Figure 3 illustrates the differences observed when the five-laboratory median value was subtracted from the predicate value (xaxis), and the tetraONE value (y axis) for absolute CD4 T-cell counts measured in each laboratory. Laboratory B, which showed good agreement between absolute counts de-rived by the tetraONE and predicate methods (Fig. 2C), also showed good agreement between CD4 T-cell counts and the five-laboratory median CD4 T-cell count obtained by both assay methods (Fig. 3B). The median difference between this laboratory’s values and the five-laboratory median values for the predicate and Flow-Count methods was 0 and 0, respec-tively. Laboratory C, which produced higher absolute CD4 T-cell counts by tetraONE than by their predicate method (Fig. 2C), showed a bias toward underestimation of CD4 T-cell count by their predicate method (median difference,⫺41 cells) compared with the five-laboratory median. However, this lab-oratory’s results by tetraONE were in good agreement with the five-laboratory tetraONE median values (median difference, 0 cells) (Fig. 3C). This suggested that the bias in absolute counts from laboratory C was largely due to underestimation by the predicate method. In contrast, laboratory E produced lower CD4 T-cell counts by the tetraONE method than by their predicate method (Fig. 2C). A comparison of this laboratory’s values with the five-laboratory median values suggested that the difference in this laboratory was due to an overestimation of CD4 T-cell count by the predicate method. Laboratory E’s results from the tetraONE method agreed well with the five-laboratory median values (predicate median difference, ⫹5 cells; tetraONE difference, 0 cells) (Fig. 3E). The results from laboratories A and D were less clear cut. It appeared that bias in both the tetraONE and predicate methods might have con-tributed to the overall difference in CD4 T-cell counts gener-ated by these two methods. Although only data from CD4 T-cell counts by the tetraONE method are illustrated, the same trend was observed for absolute CD8 T-cell counts generated by the tetraONE method and for all absolute counts generated by the Flow-Count method.
FIG. 2. Absolute differences in CD4 and CD8 T-cell counts between single-platform and predicate methods. (A and B) Flow-Count method minus predicate for CD4 (A) and CD8 (B); (C and D) tetraONE method minus predicate for CD4 (C) and CD8 (D). Box indicates median and interquartile range (25th and 75th percentiles); upper and lower lines indicate 90th and 10th percentiles, respectively.
on August 17, 2020 by guest
http://cvi.asm.org/
DISCUSSION
The single-platform flow cytometric methodologies for CD4 and CD8 T-cell determinations represent simple and efficient modifications in clinical lymphocyte subset enumeration. The results of this study confirm that use of Flow-Count fluoro-spheres for absolute counting in a two-color, light scatter-gated assay can provide within-laboratory precision that is equivalent to a predicate, two-color, scatter-gated assay in which absolute lymphocyte counts are derived by conventional hematology. The tetraONE System has automated CD45 lymphocyte gating and analysis and uses fluorosphere-derived absolute counting. This method provided a small but significant improvement in within-laboratory precision for both percentages and absolute counts compared with the two-color predicate method. The evaluation of these two single-platform assays suggests that two features of the tetraONE System, automated CD45 lym-phocyte gating and automated analysis, contribute more to improving within-laboratory precision than the use of fluoro-spheres for absolute counting.
More strikingly, use of Flow-Count fluorospheres in either a two-color, light scatter-gated assay or the four-color, auto-mated tetraONE System resulted in significant and substantial improvement in between-laboratory precision. Both single-platform assay methods decreased between-laboratory %CV by nearly half compared with the predicate method. The with-in-laboratory and between-laboratory precision that we ob-served using a conventional multiple-platform method was nearly identical to the precision observed in other multisite studies that analyzed similar specimens (1, 11, 14).
Despite an overall improvement in assay precision, the per-formance of individual laboratories varied considerably. Only
three of the five participating laboratories, when examined individually, showed a significant improvement in within-labo-ratory precision using the tetraONE method. The same trend among laboratories, although not statistically significant, was observed for the Flow-Count method. The two laboratories that failed to improve their precision were the same laborato-ries that enrolled fewer local donors in the⬍200 CD4 cells stratum. The single-platform methods resulted in greater im-provement in precision in specimens with lower CD4 T-cell counts. Therefore, this different distribution of CD4 T-cell counts in the specimens analyzed by these two laboratories may have contributed to their apparent difference in perfor-mance using the single-platform methods. The single-platform methodologies also required greater pipetting precision than that needed to perform the predicate methodologies because accurate results rely on a precise 1:1 volume ratio of blood and fluorosphere suspension. Furthermore, the single-platform as-say methods represented new procedures at all participating sites, while these laboratories were all very experienced in the predicate assay. These facts may have also served to favor the predicate method at some sites.
We also analyzed the differences in absolute counts (and percentages) obtained by the new and predicate assays as an estimate of accuracy of the single-platform methods and to understand how the single-platform assay methods would im-pact the absolute CD4 and CD8 T-cell counts (and percent-ages) currently reported in individual laboratories. Overall, there was good agreement between the new and predicate methods in CD4 and CD8 T-cell percentage values. However, individual laboratories observed small but consistent differ-ences in absolute counts between the predicate and
single-FIG. 3. Source of absolute CD4 T-cell count bias in individual laboratories. The absolute CD4 T-cell count generated in each laboratory by the predicate or tetraONE method was subtracted from the five-laboratory median value by that method to determine whether method biases occurred in individual laboratories. A through E are laboratory designations. The shaded region indicates the interquartile range (25th and 75th percentiles) of these differences.
on August 17, 2020 by guest
http://cvi.asm.org/
platform assays. These differences could have resulted from assay bias in either the predicate or single-platform methods. To address this question, we used the results from central specimens analyzed by all laboratories. We concluded that the absolute count bias in at least two laboratories occurred in the predicate method. The bias in these laboratories was probably introduced by the lymphocyte counts from the automated he-matology analyzer because the CD4 and CD8 T-cell percent-ages did not vary by assay method. However, the absolute counts derived by the predicate method showed more devia-tion from the median than the absolute counts derived by the single-platform methods. Consistent with our observation, oth-ers have identified the lymphocyte count derived from the hematology instrument as the predominant source of CD4 count bias (13; R. Gelman and C. Wilkening, submitted for publication). In two other laboratories, both the predicate and single-platform method results differed from the median re-sults of all laboratories. Of note, these were the same labora-tories that were unable to show improved within-laboratory precision using the new methods.
The comparison of absolute counts (and percentages) be-tween predicate and new methods was performed using shipped, central specimens. Consensus guidelines recommend that the automated hematology for obtaining the absolute lym-phocyte count be performed within 6 h of drawing (2, 3). With some automated hematology analyzers, substantial changes in cell counts can occur after EDTA-anticoagulated blood is aged for periods longer than 12 to 24 h (12, 16). Therefore, the use of 1-day-old central specimens might have created a slight disadvantage for the predicate method.
This multisite evaluation of Flow-Count fluorospheres and the tetraONE System in a clinical setting provides assurance that these assay methods are precise and reliable alternatives to multiple-platform CD4 and CD8 T-cell determinations. These methods provided not only modest improvement in within-laboratory precision but substantial improvement in be-tween-laboratory agreement. Therefore, these single-platform methods have considerable potential to improve data consis-tency within multicenter trials. However, the impact of imple-menting a single-platform method on assay precision and ac-curacy within individual laboratories will depend on biases inherent in current methods and the skill of testing personnel.
ACKNOWLEDGMENTS
This work was supported by the NIAID Immunophenotyping Qual-ity Assessment Program, contract NO-AI-45175, and by funds from Beckman Coulter.
ADDENDUM
After this study was completed, Beckman Coulter modified the algorithm used by the tetraONE System to automatically gate lymphocytes. In the current version (version 2.0 and sub-sequent releases), the tetraONE System utilizes forward light scatter, CD45 fluorescence, and side light scatter parameters for lymphocyte gating. In the present study, only CD45 fluo-rescence and side light scatter parameters were used for this gating.
REFERENCES
1.Aboulker, J. P., B. Autran, K. Beldjord, F. Touraine, and P. Debre.1992.
Consistency of routine measurements of CD4⫹, CD8⫹peripheral blood
lymphocytes. J. Immunol. Methods154:155–161.
2.Calvelli, T., T. N. Denny, H. Paxton, R. Gelman, and J. Kagan. 1993. Guideline for flow cytometric immunophenotyping: a report from the Na-tional Institute of Allergy and Infectious Diseases, Division of AIDS.
Cy-tometry14:702–715.
3.Centers for Disease Control and Prevention.1997. 1997 revised guidelines
for performing CD4⫹T-cell determinations in persons infected with human
immunodeficiency virus (HIV). Morbid. Mortal. Weekly Rep.46(RR-2):1–
29.
4.Connelly, M. C., M. Knight, J. V. Giorgi, J. Kagan, A. L. Landay, J. W. Parker, E. Page, C. Spino, C. Wilkening, and T. J. Mercolino.1995.
Stan-dardization of absolute CD4⫹lymphocyte counts across laboratories: an
evaluation of the Ortho CytoronAbsolute Flow Cytometry System on normal
donors. Cytometry22:200–210.
5.Giorgi, J. V., H.-L. Cheng, J. B. Margolick, K. D. Bauer, J. Ferbas, M. Waxdal, I. Schmid, L. E. Hultin, A. L. Jackson, L. Park, J. M. G. Taylor, and the Multicenter AIDS Cohort Study Group.1990. Quality control in the flow cytometric measurement of T-lymphocyte subsets: the Multicenter AIDS
Cohort Study experience. Clin. Immunol. Immunopathol.55:173–186.
6.Giorgi, J. V.1993. Characterization of T lymphocyte subset alterations by
flow cytometry in HIV disease. Ann. N. Y. Acad. Sci.677:126–137.
7.Ho, H. N., L. E. Hultin, R. T. Mitsuyasu, J. L. Matud, M. A. Hausner, D. Bockstoce, C. C. Chou, S. O’Rourke, J. M. Taylor, and J. V. Giorgi.1993.
Circulating HIV-specific CD8⫹ cytotoxic T cells express CD38 and
HLA-DR antigens. J. Immunol.150:3070–3079.
8.Johnson, D., D. Hirschkorn, M. P. Busch, and the National Heart, Lung, and Blood Institute Retrovirus Epidemiology Donor Study.1995. Evaluation of
four alternative methodologies for determination of absolute CD4⫹
lym-phocyte counts. J. Acquir. Immune Defic. Syndr. Hum. Retrovirol.10:522–
530.
9.Mildvan, D., A. Landay, V. De Gruttola, S. G. Machado, and J. Kagan.1997. An approach to the validation of markers for use in AIDS clinical trials. Clin.
Infect. Dis.24:764–774.
10. Nicholson, J. K. A., W. M. Velleca, S. Jubert, T. A. Green, and L. Bryan.
1994. Evaluation of alternative CD4 technologies for the enumeration of
CD4 lymphocytes. J. Immunol. Methods177:43–54.
11. O’Gorman, M. R. G., R. Gelman, Site Investigators, and the NIAID New CD4 Technologies Focus Group.1997. Inter- and intrainstitutional evalua-tion of automated volumetric capillary cytometry for the quantitaevalua-tion of CD4- and CD8-positive T lymphocytes in the peripheral blood of persons infected with human immunodeficiency virus. Clin. Diagn. Lab. Immunol.
4:173–179.
12. Reardon, D. M., B. Warner, and E. A. Trowbridge.1991. EDTA, the tradi-tional anticoagulant of haematology: with increased automation is it time for
a review? Med. Lab. Sci.48:72–75.
13. Robinson, G., L. Morgan, M. Evans, S. McDermott, S. Pereira, M. Wans-brough-Jones, and G. Griffin.1992. Effect of type of haematology analyser
on CD4 count. Lancet340:485.
14. Schnizlein-Bick, C., J. Spritzler, C. Wilkening, J. K. A. Nicholson, M. R. G. O’Gorman, Site Investigators, and the NIAID New Technologies Evaluation Group.2000. Evaluation of TruCount absolute-count tubes for determining CD4 and CD8 cell numbers in human immunodeficiency virus-positive
adults. Clin. Diagn. Lab. Immunol.7:336–343.
15. Smith, R. D.1990. The pathobiology of HIV infection. Arch. Pathol. Lab.
Med.114:235–239.
16. Spence, N.1993. Differential leucocyte analysis of samples up to 48 hours old: improved results with citrate pyridoxal phosphate anticoagulant. Br. J.
Biomed. Sci.50:313–320.
17. Stein, D. S., J. A. Korvick, and S. H. Vermund.1992. CD4⫹lymphocyte cell enumeration for prediction of clinical course of human immunodeficiency
virus disease: a review. J. Infect. Dis.165:352–363.
18. Stewart, C. C., and J. A. Steinkamp.1982. Quantitation of cell concentration
using the flow cytometer. Cytometry2:238–243.
19. Walker, B. D., S. Chakrabarti, B. Moss, T. J. Paradis, T. Flynn, A. G. Durno, R. S. Blumburg, J. C. Kaplan, M. S. Hirsch, and R. T. Schooley.1987. HIV-specific cytotoxic T lymphocytes in seropositive individuals. Nature
(London)328:345–348.