Scholarship@Western
Scholarship@Western
Electronic Thesis and Dissertation Repository
8-19-2019 10:30 AM
Implementation of User-Independent Hand Gesture Recognition
Implementation of User-Independent Hand Gesture Recognition
Classification Models Using IMU and EMG-based Sensor Fusion
Classification Models Using IMU and EMG-based Sensor Fusion
Techniques
Techniques
José Guillermo Collí Alfaro The University of Western Ontario
Supervisor Trejos, Ana Luisa
The University of Western Ontario
Graduate Program in Biomedical Engineering
A thesis submitted in partial fulfillment of the requirements for the degree in Master of Engineering Science
© José Guillermo Collí Alfaro 2019
Follow this and additional works at: https://ir.lib.uwo.ca/etd
Recommended Citation Recommended Citation
Collí Alfaro, José Guillermo, "Implementation of User-Independent Hand Gesture Recognition
Classification Models Using IMU and EMG-based Sensor Fusion Techniques" (2019). Electronic Thesis and Dissertation Repository. 6347.
https://ir.lib.uwo.ca/etd/6347
This Dissertation/Thesis is brought to you for free and open access by Scholarship@Western. It has been accepted for inclusion in Electronic Thesis and Dissertation Repository by an authorized administrator of
The University of Western Ontario
Abstract
According to the World Health Organization, stroke is the third leading cause of disability. A
common consequence of stroke is hemiparesis, which leads to the impairment of one side of the
body and affects the performance of activities of daily living. It has been proven that targeting the
motor impairments as early as possible while using wearable mechatronic devices as a robot assisted
therapy, and letting the patient be in control of the robotic system can improve the rehabilitation
outcomes. However, despite the increased progress on control methods for wearable mechatronic
devices, the need for a more natural interface that allows for better control remains.
This work presents, a user-independent gesture classification method based on a sensor
fu-sion technique that combines surface electromyography (EMG) and an inertial measurement unit
(IMU). The Myo Armband was used to measure muscle activity and motion data from healthy
subjects. Participants were asked to perform 10 types of gestures in 4 different arm positions while
using the Myo on their dominant limb. Data obtained from 22 participants were used to classify
the gestures using 4 different classification methods. Finally, for each classification method, a
5-fold cross-validation method was used to test the efficacy of the classification algorithms.
Over-all classification accuracies in the range of 33.11%–72.1% were obtained. However, following the
optimization of the gesture datasets, the overall classification accuracies increased to the range
of 45.5%–84.5%. These results suggest that by using the proposed sensor fusion approach, it is
possible to achieve a more natural human machine interface that allows better control of wearable
mechatronic devices during robot assisted therapies.
Index terms—Body-machine interfaces, wearable robotic systems.
According to the World Health Organization, stroke is the third leading cause of disability.
A common consequence of stroke is the paralysis on one side of the body, which affects the
per-formance of activities of daily living. It has been proven that treating this paralysis as early
as possible using devices that combines both electrical and mechanical components, can improve
the rehabilitation outcomes. However, despite the increase progress on control methods for these
devices, a need for a more natural interface that allows for an intuitive interaction remains.
This work presents, a comparison of multiple interfaces based on gesture recognition that allow
a natural interaction with a wearable robotic device. Muscle electrical activity of the forearm, and
motion data were collected from 22 healthy participants while they performed 10 types of gestures
in 4 different arm positions. These data were used to train four interfaces to recognize these 10
gestures.
Each interface was evaluated on its ability to differentiate between gestures after being trained
using only the data obtained from the muscles’ electrical activity, and after being trained using
both, the muscle electrical activity and motion data. The results obtained suggest that it is possible
to achieve a more natural interaction with wearable devices during robot assisted therapies.
I feel extremely lucky to have had such a wonderful person providing guidance throughout this
journey. I am extremely thankful to have been a part of the Wearable Biomechatronics Laboratory.
I would like to express my gratitude to each member that is, and has been, part of this awesome
group. Special thanks goes to Anas Ibrahim for his help on with the neural network models. A
big thanks goes to Jacob Tryon for helping me with the statistical analyses. You are the best,
around! I would also like to thank Yue Zhou, for his constant support and guidance during these
two years (and also for introducing me to rock climbing).
A big thanks goes to my parents Jos´e Luis Coll´ı Solis and Militza Alfaro Gamboa for always
being there when I needed them the most, and for believing in me. I love you. A thanks goes
to my brother and sister as well, it was weird not having you around. Thanks to the group
#325:NameOfADayEvent, and the rest of my friends in M´exico, guys you are breathtaking! Lastly,
I want to express my most sincere gratitude towards my fianc´ee Maremy Castillo Ocampo, for all
these years of constant love and support. Thanks for being by my side on every decision I take. I
love you so much.
This work was supported by the Natural Sciences and Engineering Research Council (NSERC)
of Canada under grant RGPIN-2014-03815; by the Canadian Foundation for Innovation (CFI),
by the Ontario Research Fund (ORF); and by the Ontario Ministry of Economic Development,
Trade and Employment and the Ontario Ministry of Research and Innovation through the Early
Researcher Award. Thanks to the Mexican National Council of Science and Technology
(CONA-CYT) for funding my studies.
Abstract i
Lay Summary ii
Acknowledgements iii
Table of Contents iv
List of Figures x
List of Tables xii
Nomenclature and Acronyms xiv
1 Introduction 1
1.1 Motivation . . . 2
1.2 General Problem Statement . . . 3
1.3 Research Objectives and Scope . . . 4
1.4 Overview of the Thesis . . . 4
2 Literature Review 6 2.1 Introduction . . . 6
2.2 Wrist Anatomy . . . 6
2.3 Wrist Rehabilitation . . . 7
2.3.1 Constraint-Induced Movement Therapy . . . 8
2.7 EMG Pattern Recognition . . . 14
2.7.1 EMG Data Collection . . . 14
2.7.2 EMG Data Segmentation . . . 15
2.7.2.1 Teager-Kaiser Energy Operator . . . 15
2.7.2.2 Data Windowing . . . 15
2.7.3 Feature Extraction . . . 16
2.7.3.1 Time Domain Features . . . 16
2.7.3.2 Frequency Domain Features . . . 18
2.7.4 Classification Methods . . . 19
2.7.4.1 Support Vector Machines . . . 19
2.7.4.2 Least Squares Support Vector Machines . . . 20
2.7.4.3 Multilayer Perceptron Neural Networks . . . 20
2.8 User-Independent Classification Methods . . . 21
2.8.1 Particle Adaptive Classifier . . . 21
2.8.2 Adaptive LS-SVM . . . 22
2.8.3 Bilinear Models . . . 22
2.9 Conclusion . . . 24
3 Data Collection and Processing 25 3.1 Equipment . . . 25
3.1.1 The Myo Armband . . . 25
3.1.2 Data Analysis Software . . . 27
3.2 Participant Recruitment . . . 27
3.3 Experimental Protocol . . . 27
3.3.2 Gestures . . . 29
3.4 Data Processing . . . 30
3.4.1 Signal Segmentation . . . 31
3.4.2 Feature Extraction . . . 34
3.4.3 Cross-Validation Sets . . . 35
3.5 Summary of Data Collection and Processing . . . 36
4 Classification Methods 37 4.1 Classification Method: PAC . . . 37
4.1.1 Feature Normalization and Feature Reduction . . . 37
4.1.2 Calibration Phase . . . 38
4.1.3 The Representative Sample Set . . . 40
4.1.4 The Representative Particles Attractive Zone . . . 41
4.1.5 PAC Evaluation . . . 43
4.2 Classification Method: Adaptive LS-SVM . . . 43
4.2.1 Calibration Phase . . . 44
4.2.2 The Leave-One-Out Prediction . . . 44
4.2.3 Adaptive LS-SVM From Multiple Subjects . . . 47
4.2.4 Adaptive LS-SVM Evaluation . . . 50
4.3 Classification Method: Bilinear Model-based Classification . . . 50
4.3.1 Bilinear Model-based Classification: Datasets . . . 50
4.3.2 Bilinear Model Learning . . . 51
4.3.3 Calibration Phase . . . 55
4.3.4 Bilinear Model Evaluation . . . 56
4.4 Classification Method: MLP Neural Networks . . . 56
4.4.1 MLP Dataset . . . 56
4.4.2 MLP Learning . . . 56
5.1.3 PAC: Discussion . . . 67
5.2 Adaptive LS-SVM Classification . . . 69
5.2.1 Adaptive LS-SVM: 10 Gesture Classification . . . 69
5.2.2 Adaptive LS-SVM: 7 Gesture Classification . . . 72
5.2.3 Adaptive LS-SVM: Discussion . . . 75
5.3 Bilinear Model-Based Classification . . . 76
5.3.1 Bilinear Models-Based Classification: 10 Gesture Classification . . . 77
5.3.2 Bilinear Models-Based Classification: 7 Gesture Classification . . . 80
5.3.3 Bilinear Models-Based Classification: Discussion . . . 83
5.4 MLP Networks Classification . . . 84
5.4.1 MLP Networks: 10 Gesture Classification . . . 85
5.4.2 MLP Networks: 7 Gesture Classification . . . 88
5.4.3 MLP Networks: Discussion . . . 91
5.5 Comparison of Classification Methods . . . 92
5.5.1 Pairwise Comparisons . . . 93
5.5.2 Best Sensor Modality Pairwise Comparisons . . . 98
5.6 Conclusion . . . 100
6 Concluding Remarks 102 6.1 Contributions . . . 103
6.2 Limitations and Future Work . . . 104
References 108
A Permissions and Approvals 118
A.1 Ethics Approval . . . 118
A.2 Permission for Figure 2.1 . . . 120
B MATLAB Code 126 B.1 Data Processing Codes . . . 126
B.1.1 Extract Subject Data Code . . . 126
B.1.2 Main Routine Code . . . 130
B.1.3 Signal Filtering Codes . . . 133
B.1.4 Signal Conditioning Codes . . . 134
B.1.5 Onset Detection Code . . . 135
B.2 Feature Extraction Codes . . . 138
B.2.1 Vectorization Code . . . 138
B.2.2 MAV and MAVS Features Code . . . 142
B.2.3 WL Feature Code . . . 142
B.2.4 ZC Feature Code . . . 143
B.2.5 AR Coefficients Feature Code . . . 143
B.2.6 Mean Feature Code . . . 144
B.2.7 Std Feature Code . . . 144
B.2.8 RMS Feature Code . . . 144
B.3 Feature Normalization Code . . . 145
B.4 Feature Reduction Code . . . 145
B.5 Classification Codes . . . 147
B.5.1 LS-SVM Code . . . 147
B.5.1.1 Predict LS-SVM Code . . . 152
B.5.1.2 Get LS-SVM Parameters Code . . . 153
B.5.1.3 Compute RBF Kernel Code . . . 155
B.5.2 PAC Code . . . 155
B.5.4 Bilinear Model Codes . . . 173
B.5.4.1 Learn Bilinear Models Code . . . 179
B.5.4.2 Style and Content Separation Code . . . 181
B.5.4.3 Vector Transpose Code . . . 182
B.6 General Purpose Codes . . . 183
B.6.1 Reduce Number of Gestures Code . . . 183
C Mathematical Formulations 186 C.1 Least Squares Support Vector Machines . . . 186
C.2 Adaptive LS-SVM . . . 187
C.2.1 Adaptive LS-SVM From Multiple Subjects . . . 189
D Python Code 190 D.1 Real-Time EMG Data Streaming . . . 190
D.2 Classification Using Bilinear EMG Models . . . 193
E R Code 198 E.1 Train MLP . . . 198
E.2 Predict MLP . . . 200
2.1 Anterior and posterior views of the bones in the wrist. . . 7
2.2 Example of robotic devices that can be used during upper limb rehabilitation. . . . 10
2.3 General procedure of an EMG pattern recognition system . . . 14
2.4 MLP network model. . . 21
2.5 Representation of the EMG symmetric model. . . 23
3.1 The Myo Armband showing the labels for each sensor. . . 26
3.2 Custom data acquisition software developed. . . 26
3.3 Placement of the Myo Armband on the user’s dominant arm. . . 29
3.4 Recorded wrist and finger motions. . . 30
3.5 Arm positions used during data acquisition . . . 30
3.6 EMG and IMU data collection and processing. . . 31
3.7 Application of TKEO to each EMG channel of the Myo Armband. . . 32
3.8 Myo Armband averaged EMG signal and smoothed EMG signal. . . 32
3.9 Active region of each EMG channel. . . 33
3.10 Summary of the data collection process. . . 35
4.1 Summary of the PAC calibration phase. . . 39
4.2 Learning process of the PAC classification method. . . 42
4.3 Evaluation of the classification performance of the PAC classification method. . . . 43
4.4 Summary of the Adaptive LS-SVM calibration phase. . . 45
4.5 Learning process of the Adaptive LS-SVM classification method. . . 49
4.10 Architecture of the MLP network. . . 58
5.1 PAC confusion matrix of the 10 gestures collected using EMG data, and EMG and
IMU data. . . 63
5.2 PAC confusion matrix of the 7 gestures collected using EMG data, and EMG and
IMU data. . . 66
5.3 Adaptive LS-SVM confusion matrix of the 10 gestures collected using EMG data,
and EMG and IMU data. . . 71
5.4 Adaptive LS-SVM confusion matrix of the 7 gestures collected using EMG data,
and EMG and IMU data. . . 74
5.5 bilinear models-based confusion matrix of the 10 gestures collected using EMG data,
and EMG and IMU data. . . 79
5.6 bilinear models-based confusion matrix of the 7 gestures collected EMG data, and
EMG and IMU data. . . 82
5.7 MLP networks confusion matrix of the 10 gestures collected using EMG data, and
EMG and IMU data. . . 87
5.8 MLP networks confusion matrix of the 7 gestures collected using EMG data, and
EMG and IMU data. . . 90
5.9 Interaction between the classification methods and the sensor modality. . . 96
5.10 Overall accuracies of the classification methods using EMG data, and EMG and
IMU data. . . 97
2.1 Average reange of motion of the wrist joint. . . 8
2.2 Control modalities used during robot-assisted therapies. . . 11
3.1 Summary of participant information. . . 27
3.2 Myo Armband sensor placement. . . 28
4.1 RSNNS MLP network parameters. . . 59
5.1 Classification accuracies of 10 gestures using the PAC classification method. . . 62
5.2 Classification accuracies of 7 gestures using PAC classification method. . . 65
5.3 Classification accuracies of 10 gestures using the Adaptive LS-SVM classification method. . . 70
5.4 Classification accuracies of 7 gestures using the Adaptive LS-SVM classification method. . . 73
5.5 Classification accuracies of 10 gestures using bilinear models-based classification method. . . 78
5.6 Classification accuracies of 7 gestures using bilinear models-based classification method. . . 81
5.7 Classification accuracies of 10 gestures using MLP networks classification method. 86 5.8 Classification accuracies of 7 gestures using MLP networks classification method. . 89
5.9 Pairwise comparison of the different classification methods used with the 10 gesture dataset. . . 94
5.12 Pairwise comparison of the different classification methods using the best sensor
Latin Letters
b Machine learning models bias term
d(·) Kernel distance function
C SVM regularization term
I Identity matrix
`(·) Convex multiclass loss function
K(·) Kernel function
L(·) Lagrangian
SMA Schur complement of matrix MA
w Weights vector
ˆ
w Pretrained LS-SVM model
Xcal Calibration dataset obtained during the PAC and Adaptive LS-SVM
classification methods
Xtest Test dataset obtained during the PAC and Adaptive LS-SVM classification
methods
Xtrain Dataset used for training during the PAC and Adaptive LS-SVM classification
methods
Yi Predicted label of theith sample
ˆ
Yi Prediction of theith sample obtained by using a pretrained LS-SVM model
αi Vector of support vectors
β Scaling factor that weighs a pretrained LS-SVM model
γ RBF kernel parameter
λ Factor that controls the age of the representative particles in the PAC algorithm
ξi SVM slack variables
φ(·) Non-linear function that maps samples to a high dimensional space
Ψ(·) Teager-Kaiser Energy Operator function
ΨSC Bilinear Model of the EMG signal
Ψavg Mean of the conditioned EMG signal
Ψrms RMS of conditioned EMG signal
Acronyms
ADC Analog to Digital Converter
ANN Artificial Neural Networks
ANOVA Analysis of Variance
AR Auto-Regressive
BM Bilinear Models
Cap Capitate bone
CIMT Constraint-Induced Movement Therapy
CVF1 Cross-Validation Fold 1
CVF2 Cross-Validation Fold 2
CVF4 Cross-Validation Fold 4
CVF5 Cross-Validation Fold 5
DOF Degrees of Freedom
EEG Electroencephalography
EIT Electrical Impedance Tomography
EMG Electromyography
FMG Force Myography
FPGA Field Programmable Gate Arrays
GUI Graphical User Interface
Ham Hamate bone
HC Hand Closed
HMM Hidden Markov Models
HO Hand Open
IMU Inertial Measurement Unit
Itr1 Iteration 1
Itr2 Iteration 2
Itr3 Iteration 3
Itr4 Iteration 4
Itr5 Iteration 5
kNN k Nearest Neighbours
KP Key Pinch
LDA Linear Discriminant Analysis
LS-SVM Least Squares Support Vector Machines
Lun Lunate bone
MAV Mean Absolute Value
MC4 Metacarpal bone 4
MC5 Metacarpal bone 5
MLP Multilayer Perceptron
MMG Mechanomyography
MNF Mean Frequency
MUAP Motor Unit Action Potential
NN Neural Network
PAC Particle Adaptive Classifier
PCA Principal Component Analysis
Pis Pisiform bone
PKF Peak Frequency
PM Predictive Model
PP Precision Pinch
PSD Power Spectrum Density
PSR Power Spectrum Ratio
Rad Radius bone
ReLU Rectified Linear Unit
ROM Range of Motion
RBF Radial-Basis Function
RP Representative Particles
RSNNS R Stuttgart Neural Network Simulator
RSS Representative Sample Set
sEMG surface Electromyography
SGD Stochastic Gradient Descent
SNR Signal to Noise Ratio
SPSS Statistical Package for Social Sciences
SVD Singular Value Decomposition
SVM Support Vector Machines
TKEO Teager-Kaiser Energy Operator
Tpd Trapezoid bone
Tpm Trapezium bone
Trq Triquetrum bone
UE Upper Extremity
Uln Ulna bone
WAb Wrist Abduction
WAd Wrist Adduction
WE Wrist Extension
WF Wrist Flexion
WL Waveform Length
WP Wrist Pronation
WS Wrist Supination
ZC Zero Crossing
Units
cm Centimetres
Hz Hertz
yrs Years
Introduction
Cerebrovascular accidents, commonly known as stroke, are the third leading cause of disability
and the second leading cause of death in the world [1]. Up to 80% of stroke survivors often present
upper extremity (UE) hemiparesis [2] thus, requiring extensive rehabilitation sessions to regain
some UE functions. The main inconvenience for hemiparetic stroke patients is that they may not
be eligible for common rehabilitation techniques, which are usually aimed towards a population
with mild impairments [3]. Therefore, alternative therapies are necessary for hemiparetic stroke
patients to improve neuroplasticity, which is the ability of the brain to “rewire” functions associated
with damaged tissue to healthy parts of the brain.
One alternative therapy is bilateral training, which consists of the activation of motor synergies
between limbs, and as explained by Stewart et al.[4]: “voluntary movements of the intact limb
may facilitate voluntary movements in the paretic limb.” Rehabilitation is enhanced because when
symmetrical movements are executed, the motor cortex governing the actions of the healthy limb
is activated, thus increasing the voluntary muscle contractions in the impaired limb. Hence, by
performing bilateral movements, it is possible to promote neuroplasticity [4]. Moreover, bilateral
training has been tackled from different approaches, with robot-assisted therapy being the one
with greatest potential. Even though this innovative field has proven to be effective, much work
needs to be done regarding the interaction with robotic devices during robot-assisted therapies. In
this sense, by improving the patient’s level of engagement during robot-mediated rehabilitation,
such rehabilitation can provide an advantage over traditional rehabilitation therapies [5].
itation outcomes [6]. In the context of upper-limb robot-assisted therapy, wearable mechatronic
devices allow for the rehabilitation of specific groups of muscles by applying different torques at
certain joints of the upper limb [7]. An important aspect of robot-assisted therapy is the need
to promote patient mobility instead of just letting the robot perform the complete rehabilitation
task. Furthermore, it has been found that when the user’s movements are governed by those of the
robot, the amount of effort that the patient exerts while performing voluntary actions is reduced,
leading to negative effects during the recovery process [8]. Consequently, the ideal therapy is one
in which the patient is part of the control loop, which can be achieved by enabling different ways of
communication and interaction between the robotic device and the user [9]. However, even when
research in the field of robot-assisted therapy has increased [6, 7, 10–12], the need for a natural
human machine interface that allows an intuitive control and long-term adoption of this technology
remains [13].
To address this issue, gesture recognition has been studied as a possible solution for human
machine interface applications [14, 15], with gesture recognition based on electromyography (EMG)
being the most commonly used for interactions with robotic devices [16]. In previous years, the Myo
Armband [17], was introduced as a commercially available EMG based gesture recognition device,
opening a lot of possibilities for gesture recognition applications. However, the built-in proprietary
system of the Myo Armband is limited to the recognition of 5 gestures. This limitation may be
because the accuracy of the device is inversely proportional to the amount of gestures it can detect
[18, 19]. Moreover, when the Myo Armband is used in a user-independent scenario, which means
that it can be used by new users without prior training, its recognition accuracy drops from 83.1%
(user-dependent) to 53.7% (user-independent) [20]. This is important because a user-independent
scenario allows for a practical gesture recognition system. Such system can help new users become
proficient in using wearable mechatronic devices during robot-mediated therapies after a short
otherwise be required to adjust the interface to a specific subject, would not be necessary anymore
[21]. Hence, the time to complete a rehabilitation session for hemiparetic stroke patients would
be reduced. By overcoming these limitations, the Myo Armband, or a similar EMG-based device,
can be used to build a low-cost, reliable interface that can interact with wearable robotic devices.
1.2
General Problem Statement
Commonly, gesture recognition can be achieved by using different pattern recognition algorithms
such as support vector machines (SVM) and linear discriminant analysis (LDA). Furthermore,
the ideal gesture recognition interface should be one that requires training a classifier only once
without the need of retraining every time a new subject wears the device. This is known as
user-independent classification. However, because EMG signals are affected by different factors such as
muscle fatigue and level of health, among others, a user-independent classification is not always
possible without sacrificing classifier accuracy. To overcome this issue, one proposed solution
consists of using sensor fusion techniques, for example combining EMG data with kinematic data
coming from an inertial measurement unit (IMU), to improve the classification accuracy [21, 22].
Another solution is the use of incremental learning, which is a strategy to update the classifiers
by retraining them using new data samples [23]. However, in the specific case of SVM, using
incremental learning may lead to a concept drift, which is the change in the data distribution
over time [24]. Nonetheless, recent studies [23, 25] have proposed solutions for concept drift
during incremental learning by using SVM with particle adaptive classifier (PAC) [23] or SVM in
combination with another classification algorithm, such ask nearest neighbours (kNN) [25].
The purpose of this work is to develop a user-independent hand gesture recognition interface
using sensor fusion techniques and an adaptive incremental learning classifier. This work proposes
that by combining EMG and IMU data from the commercially available Myo Armband, and by
us-ing incremental learnus-ing usus-ing different classification methods, it is possible to increase the number
was collected from healthy subjects while they performed 10 different wrist and finger gestures.
The primary objectives of this thesis are as follows:
1. To acquire and analyze EMG and IMU data from healthy subjects while they perform
dif-ferent hand gestures.
2. To train different classifiers using EMG data, and EMG and IMU data collected from the
Myo Armband, and then evaluate their classification performance.
1.4
Overview of the Thesis
The structure of this thesis is summarized in the outline below:
Chapter 1 Introduction: This introductory chapter.
Chapter 2 Literature Review: Presents a review of wrist anatomy, wrist rehabilitation,
robot-assisted therapy, human machine interfaces used in robot-assisted
ther-apies, gesture recognition and motion intention detection, EMG and IMU
sig-nal acquisition, processing and asig-nalysis, and user-independent classification
methods.
Chapter 3 Data Collection and Processing: Presents the methods used for collecting
EMG and IMU data using the Myo Armband including the data collection
protocol and methods of data processing and analysis.
Chapter 4 Classification Methods: Presents the implementation of four classification
methods aimed towards an user-independent gesture recognition using EMG,
and EMG and IMU data.
Chapter 5 Results and Discussion: Presents the results of the data analysis and explains
Chapter 6 Conclusion and Future Work: Emphasizes the contributions of this work and
provides recommendations for future work.
Appendix A Permissions and Approvals: Includes ethics permission and approval, consent
form and trial form.
Appendix B MATLAB Code: Describes the MATLAB code used for EMG and IMU
anal-ysis.
Appendix C Mathematical Formulations: Describes the mathematical equations used to
solve some of the classification algorithms presented in this work.
Appendix D Python Code: Describes the Python code used for real-time EMG data
streaming, and for classification using the bilinear EMG models.
2.1
Introduction
To provide a knowledge base for the remainder of this thesis, this chapter presents a review of
the literature in the areas of wrist anatomy (Section 2.2), wrist rehabilitation (Section 2.3),
robot-assisted therapy (Section 2.4), motion intention and gesture recognition interfaces (Section 2.5),
user-independent gesture recognition (Section 2.6), EMG pattern recognition (Section 2.7), and
classification methods aimed towards a user-independent classification (Section 2.8). A literature
search was conducted using Google Scholar from September 2017 to July 2019. The keywords used
in the search included combinations of the following: upper limb rehabilitation, EMG features,
EMG+IMU sensor fusion, user-independent classification, and EMG gesture recognition. A total
of 119 references, which include papers and books, were incorporated into the literature review.
2.2
Wrist Anatomy
The wrist is a complex human joint localized between the hand and the forearm. It is comprised of
a collection of bones, which consist of the distal ends of the radius (Rad) and ulna (Uln) bones, 8
carpal bones, which include the scaphoid (Sca), the lunate (Lun), the triquetrum (Trq), the pisiform
(Pis), the trapezoid (Tpd), the trapezium (Tpm), the capitate (Cap), and the hamate (Ham); and
the proximal segments of the 5 metacarpal bones (MC1 to MC5) of the hand (Figure 2.1) [26, 27].
Figure 2.1: Anterior (left) and posterior (right) views of the bones in the wrist. Reprinted, with permission [27].
This complex structure allows the hand to interact with the external environment by adopting
different poses depending on the situation. Furthermore, by involving the radio–ulnar complex of
the forearm, complex movements, such as the rotation of the hand, can be performed [28]. These
sets of motions allow the wrist joint to be represented, in mechanical terms, as a 3 degree-of-freedom
(DOF) system [29].
2.3
Wrist Rehabilitation
Although it is possible for the the hand to achieve different poses thanks to the wrist joint, these
poses are limited to a certain range of motion (ROM) (Table 2.1). However, when people suffer from
a neurological injury such as a stroke, they are prone to experiencing some sort of impairment that
hinders the motor abilities of the wrist joint. This impairment can come in the form of hemiparesis,
which is the partial paralysis of the limbs due to muscle weakness, and can be a limiting factor
during activities of daily living [30]. Therefore, to regain lost motor functions, hemiparetic stroke
patients must undergo a series of rehabilitation treatments in order to promote neuroplasticity,
i.e., the ability of the brain to form new neural connections associated with damaged brain tissue
in healthy parts of the brain [4, 31]. In the following sections, some of the popular therapeutic
Wrist Radial Deviation 19◦
Wrist Ulnar Deviation 33◦
Wrist Pronation 71◦
Wrist Suppination 84◦
2.3.1 Constraint-Induced Movement Therapy
Constraint-induced movement therapy (CIMT), also known as unilateral training therapy, is a
common rehabilitation technique used for hemiparetic stroke patients. This therapeutic approach
consists of improving the involvement of the affected limb during activities of daily living by forcing
the movement of the paretic limb while the motions coming from the healthy limb are reduced
or constrained [33, 34]. Although promising, CIMT has the drawback of being aimed only at a
population whose hemiparetic symptoms are not that severe [3]. Also, the constant practice of
CIMT may result in a reduced need for the brain to retain some information related to the motions
being performed, which results in less improvement of neuroplasticity [35].
2.3.2 Bilateral Movement Training
An alternative to CIMT is known as bilateral movement training. This technique consists of
activating motor synergies of the limbs by promoting the coordination of movement between the
paretic and non-paretic limb, thus facilitating voluntary motions on the affected limb [4, 36]. Three
main categories of bilateral training exist, divided according to the type of rehabilitation task they
perform. These categories are the following:
Repetitive reaching practice with the hand fixed: This type of training consists of training
a reaching motion by attaching the distal ends of both hands to a mechanical device. Then, a
reaching movement is trained by performing symmetrical motions (both hands push the device in
Isolated muscle repetitive task practice: Isolated repetitive muscle training consists of
iso-lating a group of muscles on both arms by restraining all types of motions but one. For example,
patients may be asked to perform repetitive movements of wrist flexion, wrist extension, among
others [37].
Whole arm functional task training: While the previous two tasks required the performing
of a single motion or activity, this training involves a set of motions that include the grasp, reach,
and release of an object. This training can be done by simultaneously using both arms to perform
these three actions or by using the non-paretic limb to guide the impaired limb [37].
2.4
Robot-Assisted Therapy
The previous section described traditional upper limb rehabilitation methods aimed towards
im-proving neuroplasticity. Even though the described therapeutic methods are designed to provide
high intensity training by being repetitive, task-oriented and challenging to the patient, a need to
further enhance the effects of the rehabilitation treatments exists [38]. Therefore, research groups
have come with the solution of using smart robotic devices to address the need of improving the
rehabilitation effects on patients with impaired arm functions after stroke. Robot-assisted therapy
can provide the tools to asses the improvement of motor control of the affected limbs in a much
faster, efficient, and objective way [39].
Usually, upper limb robot-assisted therapy is based on two types of robotic devices: serial
robotic manipulators and wearable mechatronic devices (Figure 2.2). The former is based on the
use of a robotic manipulator, which its end effector is attached to the hand of the patient, and
then it assists the patient by generating forces in order to complete the rehabilitation task.
The second type of therapy robots are known as wearable mechatronic devices. Contrary to end
effector robots, these types of mechatronic devices are designed so that their joints match those of
the user. Moreover, the main advantage of this design is that wearable mechatronic devices allow
for the rehabilitation of specific group of muscles by applying different torques at certain joints of
the upper limb [7].
(a) (b)
Figure 2.2: Example of robotic devices that can be used during upper limb rehabilitation. The KUKA robot, a serial robotic manipulator (a), and the WearME Brace [40], a wearable mechatronic device (b).
necessary to apply effective control strategies, which will dictate not only the mechanical behavior
of the system, but also the human-robot interactions [10]. Table 2.2 shows a summary of the
different control strategies used during robot-assisted therapies.
Among all of the control strategies described in Table 2.2, partially assistive control stands
as the most important because it promotes patient mobility instead of just letting the robot
perform the complete rehabilitation task. Furthermore, it has been discussed that when the user’s
movements are led by those of the robot, the amount of effort the patient puts while performing
voluntary actions is reduced, leading to negative effects during the recovery process [41]. Therefore,
it is important to adopt the concept of user in the loop, in which the patient can interact with
the robotic device in a more natural and active way. Consequently, by adopting a more active
role that promotes self-improvement, hemiparetic stroke patients will feel more comfortable during
robot-assisted therapy sessions [42].
2.5
Motion Intention Detection vs. Gesture Recognition
Different approaches have targeted the “user in the loop” paradigm. Of these, motion intention
detection is the approach that has the potential to give almost full control to the wearer of the
classi-T able 2.2: Con trol mo dalities used during rob ot-assisted therapies [10, 41]. Mo dalit y Sub-Mo dalit y F urther Sub-Mo dalit y Assistiv e Mo de: The rob ot pro duces forces that are applied to the impaired lim b to complete the task P assiv e Con trol: The rob ot mo v es the impai re d lim b with out the need for the patien t to start the action P assiv e T ra jectory T rac king: The rob ot follo ws a predefined
path Passiv
(MMG) and force myography (FMG). These signals can be used then to predict the user movement
intention and then generate control commands for the wearable mechatronic devices.
Several studies have managed to utilize motion intention detection as a sophisticated control
method. Ryser et al. [43] developed a wearable robotic hand orthosis controlled using motion
intention detection based on EMG signals. The device detected patterns produced by the activation
of different muscles while performing specific hand gestures and then, these patterns were utilized
to control a wrist wearable mechatronic device. Zhang and Harrison [44] created a device that
was able to measure the cross-sectional impedance distribution among the muscles of the wrist
of the subject using the principle of the electrical impedance tomography (EIT). Because of this,
they were able to detect hand gestures with high accuracies. In studies like [45], the detection of
vibrations produced by the muscles also known as mechanomyography, was used to classify the
patterns; whereas in [46] force myography was utilized, which is the detection of the force produced
by the inner exerted pressure of the limb.
However, adopting motion intention detection as a control method narrows the population
of stroke survivors that can benefit from robot-assisted therapy to just a few. This is due to
the presence of involuntary muscular activation during voluntary movements that compromise
the signal classification in the training process of stroke patients [47]. Therefore, it is necessary
to shift to a more reliable approach that can provide an intuitive and straightforward control
method. Gesture recognition has been used as a reliable human machine interface in mobile
devices, as well as with robotic manipulators [14, 15]. Yet, even when gesture recognition can be a
valuable interface for the control of wearable mechatronic devices during robot-assisted therapies,
its potential has not been fully explored.
Nonetheless, recent studies have started to explore the use of different technologies for the
detection of upper limb gestures. For example, Jung et al. [48] designed a wearable device that
air bladders and air pressure sensors that detected the small changes in the shape of the muscles
due to swelling during voluntary actions. The problem with this device was that the presence of
involuntary movements affected the sensor readings, thus decreasing its reliability for the control
of wearable mechatronic devices. Noronha et al. [49] explored the use of eye tracking technology
to control a soft robotic glove, however the problem with this approach was that they were only
able to detect one single gesture, making the overall control system less versatile for activities
of daily living. Another approach for detecting gestures was explored by Zheng et al. [50], who
developed an armband with capacitive sensors. However, their study did not explore environmental
disturbances that occur when the sensing band was used multiple times. Finally, Haroon and Malik
[51] were able to detect gestures by obtaining EMG signals from the forearm of a subject. This
information was then used for the control of a robotic gripper.
2.6
User-Indpendent Gesture Recognition
To effectively use gesture recognition-based interfaces during rehabilitation sessions of hemiparetic
stroke patients, it is necessary to develop strategies aimed towards a user-independent scenario.
In doing so, deployment of robot-assisted therapies would be facilitated by adopting a system that
does not require any type of offline training for each new patient [21, 52].
Although EMG-based gesture recognition shows the potential to be the ideal interface for
human machine interactions due to EMG signals being rich in information about muscle electrical
activity, EMG has a low signal to noise ratio (SNR), and the fact that hemiparetic stroke patients
have limited motor abilities, this type of signals are difficult to use during robot-assisted therapies.
However, when used in combination with other types of sensors, its possible to compensate for
this disadvantage, as shown in several studies [15, 53]. Despite the capabilities of simultaneously
employing information coming from multiple sources, different studies have opted to employ more
sophisticated pattern recognition techniques to enhance the capabilities of the EMG signals, in
order to achieve a user-indepenendent gesture recognition interface. In the following sections,
recognition system follows the procedure summarized in Figure 2.3 [54, 55].
Data Acquisition
Data Segmentation
Feature Extraction
Training and Evaluation of Classifier
Figure 2.3: General procedure of an EMG pattern recognition system.
2.7.1 EMG Data Collection
Electromyography (EMG) is a way to measure the electrical activity produced by the muscles when
they contract. In general, this electrical activity can be acquired using invasive and non-invasive
methods [56]. The first method consists of inserting needle electrodes through the skin and directly
into the muscle. On the other hand, the non-invasive technique consists of using electrodes made
of conductive materials that range from stainless steel to gold or silver metals [57], placed on the
surface of the skin over the muscle of interest. This process of acquiring the EMG signals using
the non-invasive method is also known as surface electromyograpy (sEMG).
Whenever a muscle contracts, each of its muscle fibers produces an action potential, which
when summed together, produce something known as motor unit action potential (MUAP). The
MUAP is responsible for producing currents that flow from the muscle cells to the surface of the
skin. The sum of all MUAPs produce an EMG signal that is read by electrodes placed on the
skin [58]. Once obtained, this EMG signal needs to be preprocessed before proceeding towards the
next steps of the pattern recognition. Given that the EMG signal is in the order of milivolts, the
first preprocessing step consists of amplifying with a gain in the range of 1000 to 10000 [59]. After
being amplified, the EMG signal is then filtered using a bandpass filter, which is usually composed
by a high-pass filter and a low-pass filter. These two filters are designed with cut off frequencies
around 10 to 20 Hz for the high-pass filter, and 500 Hz for the low pass filter [60]. Furthermore, a
that can corrupt the EMG signal.
2.7.2 EMG Data Segmentation
Following the amplification and filtering of the raw EMG signal, the second step of the pattern
recognition process consists of segmenting the preprocessed signal so that it can be analyzed for
real-time applications. However, it is necessary to first detect the moment when the muscle goes
from an idle or relaxed state to the contracted state. This process of detecting the change of state
is known as EMG onset detection and is important because it can be used as the trigger to start
motion analysis.
Typical EMG onset detection methods use threshold-based algorithms. These algorithms
in-clude threshold approaches [61], and double-threshold approaches [62–64]. While
single-threshold based approaches rely on detecting the instant when the amplitude of the signal
sur-passes a predefined value, double-threshold approaches take this concept even further by ignoring
false-alarm triggers. This is achieved by counting the number of consecutive samples in which the
amplitude of the EMG signal is above a predefined threshold, after the first motion trigger event
happens.
2.7.2.1 Teager-Kaiser Energy Operator
Solniket al. [65] showed that regardless of the motion onset detection method used, the detection
accuracy could be improved by using the Teager-Kaiser energy operator (TKEO), which measures
the instantaneous energy change of the signal [66], and is defined as follows:
Ψ (xi) =x2i −(xi+1×xi−1), (2.1)
wherexi represents theith EMG sample value.
2.7.2.2 Data Windowing
After preprocessing the EMG signal with TKEO, it can be properly segmented. This is particularly
the length of the windows should account for the maximum tolerated delay (300 ms) between
processing the information and controlling a myoelectric device [67]. Furthermore, depending on
the application, a trade-off between classification accuracy and delay exists, which can affect the
choice of the window length. In this sense, continuous windows with lengths of 200 ms provide
better classification accuracies, while overlapped windows with lengths above 200 ms, and 150 ms
of overlap, provide a faster response with a noticeable increase in the classification error [68].
2.7.3 Feature Extraction
Following data segmentation, the next pattern recognition step consists of feature extraction. For
the control of EMG-based wearable mechatronic devices, different studies have explored the use
of time domain, frequency domain, and time-frequency domain features for motion classification
[55, 69, 70]. Time domain features are the predominant features used in applications involving
wearable mechatronic devices and most myoelectrical devices. Their popularity comes from their
relatively fast computation due to not requiring any type of transformation [70]. On the other hand,
frequency domain features are mostly used in applications that study muscle fatigue, and are based
on the signal’s estimated power spectrum density (PSD) [54, 70]. Finally, time-frequency domain
features are used to extract the signal’s energy information in time and frequency simultaneously.
However, both frequency and time-frequency domain features require transformations that can be
computationally expensive [54].
2.7.3.1 Time Domain Features
Some of the most commonly used time domain features used in the literature are listed below
Mean Absolute Value (MAV) The MAV feature represents the mean absolute value of the
signal amplitude from a segment of window of sizem, as follows:
M AV(n) = 1
m
m
X
i=1
|xn(i)|, (2.2)
wherexn(i) represents the measure of sampleiof channeln.
Waveform Length (WL) This feature represents the cumulative length of the signal over a
time segment [70].
W L=
N−1 X
i=1
|x(i+ 1)−x(i)|, (2.3)
whereN is the length of the signal, andx(i) is the ith sample of the signal.
Mean Absolute Value Slope (MAVS) The MAVS feature of each segment n is defined as
the difference between the MAV of the current segment and the next segment for allN segments
[70], as follows:
M AV S(n) =M AVn+1−M AVn n= 1, . . . , N. (2.4)
Auto-regressive Coefficients (AR) An AR model represents each sample xi of the EMG
signal as the linear combination of each previous xi−p samples and white noise wi [70]. The AR
model is defined as follows:
xi = P
X
p=1
apxi−p+wi, (2.5)
whereP is the AR order and the coefficientsap are used as the EMG features.
Zero Crossing (ZC) This feature represents the number of times the signal crosses the zero
value. To avoid any background noise, a crossing is considered only when the signal exceeds certain
f(x, y) =
1 if(x×y)<0∩ |x−y| ≥th
0 otherwise.
(2.7)
2.7.3.2 Frequency Domain Features
The other type of features extracted during motion classification are the frequency domain features.
Phinyomarket al. [70] found that frequency domain features are not well suited for EMG signal
classification due to some of the features having the same discrimination as most time domain
features. However, they also found that two features in the frequency domain have the ability to
provide some useful information for EMG signal classification. These features are the following:
Mean Frequency (MNF) The mean frequency of the signal is the average frequency of the
EMG power spectrum [70]. It is calculated as follows:
M N F =
M
X
i=1
fiPi
, M
X
i=1
Pi, (2.8)
where M is the length of the frequency bin, fi is the frequency of the power spectrum at bin i,
and Pi is the EMG power spectrum at frequency bini.
Power Spectrum Ratio (PSR) The power spectrum ratio represents the ratio between the
maximum value of the EMG power spectrum and the whole energy of the EMG power spectrum
[70]. The PSR is calculated as follows:
P SR= P0
P =
f0+n X
i=f0−n
Pi
, E
2 X
i=E1
Pi, (2.9)
where P is the energy of the EMG power spectrum, which can lie within the range of E1 = 20
EMG power spectrum, n is the integral limit, and f0 is the frequency with the maximum power
spectrum in a frequency bin of lengthM [70].
Peak Frequency (PSR) The peak frequency, is the frequency at which the maximum power
occurs [70]. The PKF is given by:
P KF = max(Pi) i= 1, . . . , M. (2.10)
2.7.4 Classification Methods
After features have been extracted, they need to be used as inputs to a classifier in order to be
mapped to new known gestures. This section reviews some of the common pattern recognition
classification methods used for the control of wearable devices.
2.7.4.1 Support Vector Machines
Support Vector Machines (SVM) are a powerful classification method for solving non-linear
prob-lems regarding pattern recognition. SVM uses separating hyperplanes to distinctly classify between
data points corresponding to different classes. To properly classify these data points while also
increasing the probability of correctly classifying new data, SVM tries to find the ideal separating
hyperplane that maximizes the distance between samples of different classes. This distance is also
known as the classification margin, and it is defined by the support vectors, i.e., data that are
closest to the hyperplane. However, because the support vectors are the most difficult data to
classify, the classification margin is tuned to allow for some violations.
Although SVM can be used to solve linear classification problems, most of the applications
involve non-linear classification problems. In other words, the vast majority of pattern recognition
applications involves data samples that are not linearly separable. Therefore, SVM solve this issue
by using kernel functions. These functions allow the data samples to be projected into a high
dimensional space, where data that have some sort of similarity between each other are grouped
together. This allows for a non-linear classification problem to be treated as a linear classification
2.7.4.2 Least Squares Support Vector Machines
The Least Squares Support Vector Machines (LS-SVM) classification algorithm proposed by Suykens
and Vandewalle [75] is a variation of the SVM classifier. It was introduced to solve one of the major
drawbacks of SVM, which is the high computational burden of its optimization problem. LS-SVM
solve this issue by approaching the optimization problem using equality instead of inequality
con-straints, and a sum of squared errors [76]. This reformulation allows the solutions of the SVM
classification problem to be obtained using a system of linear equations. Because of this, LS-SVM
constitute the basis algorithm for most user-independent classification problems.
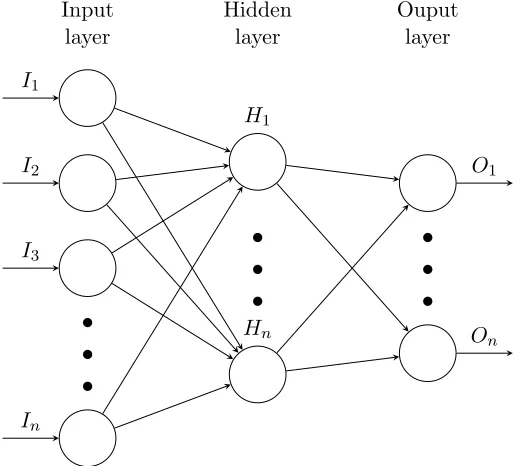
2.7.4.3 Multilayer Perceptron Neural Networks
Previous research in the field of EMG pattern classification [77] has successfully implemented
Ar-tificial Neural Networks (ANN) as a classification algorithm due to its high generalization abilities
over large data sets that are not linearly separable. Multilayer perceptron (MLP) networks are a
type of feedforward network that consists of an input layer, one or multiple hidden layers, and an
output layer (Figure 2.4).
Training of a MLP network occurs through an iterative process that consists of two steps: the
forward propagation phase and the back propagation phase. During the forward phase, information
used as the input signal travels through the network layer by layer in a forward direction. The
output of each layer is given by an activation function, whose choice depends on the application.
Different activation functions exist, however the commonly used one for bilinear problems is the
sigmoid function [78], whereas for multiclass classification problems, the softmax function [79] is
employed. On the other hand, during the back propagation phase, the output of the network
travels from the output layer to the input layer, with the purpose of computing a set of weights
that minimizes the classification error. This is achieved by using different algorithms, with the
..
.
..
.
..
.
I1
I2
I3
In
H1
Hn
O1
On
Input layer
Hidden layer
Ouput layer
Figure 2.4: MLP network model for multiple inputs and outputs.
2.8
User-Independent Classification Methods
In the previous section, the process of EMG pattern recognition was described. While the same
process is true for a user-independent EMG pattern recognition, the classification methods used
differ from the traditional ones. In the following sections some of these classification methods are
presented.
2.8.1 Particle Adaptive Classifier
The particle adaptive classifier (PAC) is an adaptive learning classification method based on
LS-SVM, and incremental learning. The concept of incremental learning consists of taking the support
vectors of a pretrained model and combining them with a new batch of incoming data. Then, a
new classification model is trained using these new data. However, this method will eventually
lead to a higher risk of misclassification due to the concept drift, which is caused by the change in
the data distribution every time a new model is trained [24].
Therefore, Huang et al. [23] proposed an alternative to this method that consisted of using a
this data sample is to any of the samples in the particle set. These distances are measured in the
kernel space. If the distance between the sample and a particle is below a predefined threshold,
the particle set is updated by substituting the sample particle with the new data sample. Finally,
if the particle set was updated, a new predictive model is trained.
The advantage of the PAC method is that it is possible to avoid not only the concept drift,
but also the computational cost of training new predictive models. This is because the size of the
particle set used is small, which yields a reduced number of support vectors.
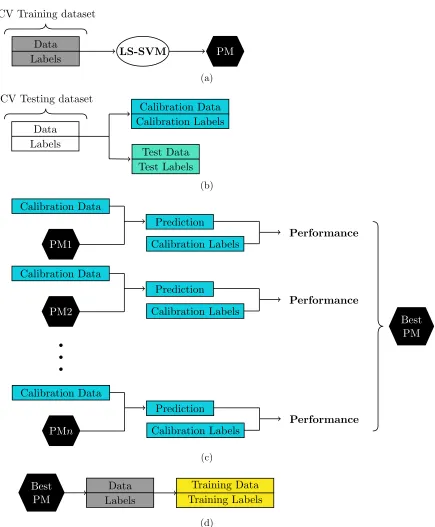
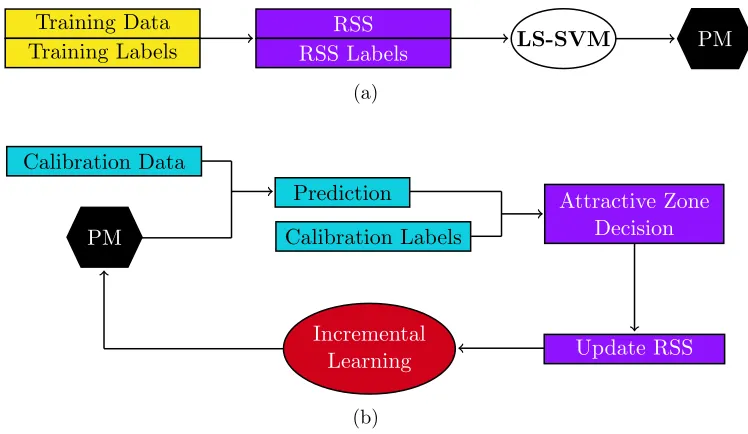
2.8.2 Adaptive LS-SVM
Another adaptive approach for a user-independent classification scenario is based on the work
proposed by Tomasi et al. [81]. This approach assumes that a database of pretrained LS-SVM
models exists, which can be used as the starting point to train a new predictive model for a new
user. To properly work, the adaptive LS-SVM requires the use of a calibration set, which is formed
whenever a new user performs a defined set of motions. Then, each of the pretrained models in
the database are used to classify the data obtained from the calibration phase. Because the user
performs the same motions used to train the pretrained models, it is assumed that at least the
new distribution of the data is close to at least one of the existing models.
The Adaptive LS-SVM proved to improve the classification performance of new data when used
in a user-independent scenario [81]. However, the main drawback of this method is that it relies
on the assumption that at least one previous model matches the new data distribution, which as
shown in [81], is not always the case.
2.8.3 Bilinear Models
Matsubara et al. [82] proposed a different user-independent classification method that consists
Figure 2.5: Representation of the EMG symmetric model. The EMG signal can be represented as a multidimensional array where each row K, which represents one EMG channel, contains the same number of samples.
approach used for computer vision applications [83].
To implement their technique, they represented a multichannel EMG signal (Figure 2.5) using
a symmetric bilinear model, as follows:
ΨSC =
I
X
i=1 J
X
j=1
wijk·ziS·xCj , (2.11)
where ΨSCk represents the EMG signal of channelk,zS∈RIandxC ∈RJ indicate the parameters,
respectively, of the style (user-dependent factors) and content (motion-dependent factors) vectors.
Also, by denotingW ∈RI×J as the parameter matrix of the bilinear model with entries w
ijk, each
channelk of ΨSC can be represented in a vectorized form, as follows:
ΨSCk =zS T ·Wk·xC. (2.12)
By using the bilinear model representation, Matsubaraet al. [82] were able to effectively classify
motion data using the content variables as a type of new feature inputs for a SVM classification
model. However, they found that this approach is heavily dependent on the setup of the EMG
collecting device. In this sense, if the EMG electrodes were not placed in the exact same location,
well as their control methods were described. Finally, EMG pattern recognition and some of the
user-independent classification algorithms were reviewed. In the following chapter, an IMU and
EMG-based sensor fusion technique used in combination with these user-independent classification
Data Collection and Processing
This chapter describes the procedure for EMG and IMU data collection and processing. The
following sections present a description of the equipment used, the experimental protocol, which
includes participant recruitment and data collection procedures, and signal processing methods
implemented to move forward to the development of a user-independent interface based on different
classification models. The code used in this section is shown in Appendices B.1 and B.2.
3.1
Equipment
3.1.1 The Myo Armband
The Myo Armband (Fig. 3.1), which is a gesture recognition band comprised of eight dry stainless
steel medical grade EMG sensors and one 9 degree-of-freedom (DOF) IMU, was used to collect data
during the trials. Each EMG sensor was sampled at a frequency of 200 Hz, and output an eight-bit
unitless integer value that ranges from -128 to 127 representing the level of activation of the muscle
being sensed. The 9 DOF IMU contains a three-axis accelerometer, a three-axis gyroscope, and a
three-axis magnetometer, each one sampled at a frequency of 50 Hz. Furthermore, six sixteen-bit
analog-to-digital converter (ADC) are used to digitize each axis of the accelerometer and gyroscope
elements of the IMU, while three thirteen-bit ADC are used for the magnetometer outputs [84].
Figure 3.1: The Myo Armband showing the labels for each sensor. The IMU is located within Sensor 4.
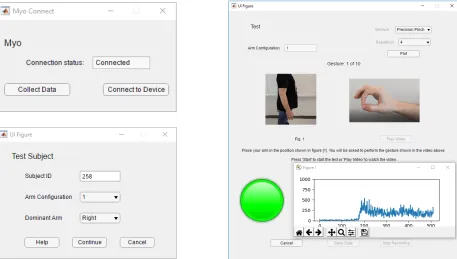
3.1.2 Data Analysis Software
Data from the Myo Armband were streamed via Bluetooth 4.0 to a 3.40 GHz Intel CoreTM i7 PC
running Windows 10 with 8 GB memory RAM. To complete the collection of the data, a custom
data acquisition GUI (Fig. 3.2) was developed in MATLAB R2017b using the App Designer toolbox
and the Myo SDK MATLAB Mex Wrapper toolbox [85].
3.2
Participant Recruitment
Trials began following approval from the Human Research Ethics Board at Western University
(Appendix A.1). Participants were recruited via email advertisement over a period of 7 months
from October 2018 to April 2019. Only healthy subjects over the age of 18 years old, with no
previous injuries of the shoulder, elbow or wrist, nor neurological disorders, were considered for
the trials. These exclusion criteria were implemented because musculoskeletal or neurological
disorders in these joints could hinder the ability to perform the gestures at their full range of
motion.
3.3
Experimental Protocol
Following participant consent, data collection began at the Wearable Biomechatronics Laboratory
at Western University. Each participant provided information about their age, dominant hand,
sex, weight, height, waist circumference, wrist circumference, forearm circumference, arm length,
and any information about prior upper-limb injuries. Such information was collected as a standard
procedure because it may account for differences in biological signals that may be useful for future
studies. However, only a portion of this information was employed in this study. Table 3.1 shows
a summary of the participants’ information.
Table 3.1: Summary of participant information.
Sex Dominant Hand
Age (yrs)
Weight (kg) Height (cm) Wrist Circumference (cm)
Forearm Circumference (cm) 18 Male 22 Right
above the Extensor Carpi Ulnaris muscle, which was located using palpation techniques. Therefore
and depending on the dominant arm, each remaining sensor of the Myo Armband was positioned
over the muscles described in Table 3.2, according to [86].
Table 3.2: Myo Armband sensor placement with respect to the forearm muscles depending on hand dominance [86].
Sensor # Right Arm Muscles Left Arm Muscles
1 Flexor Carpi Ulnaris Brachioradialis
Flexor Digitorum Superficialis
2
Anconeus Extensor Carpi Radialis Longus
Flexor Carpi Ulnaris Extensor Carpi Radialis Brevis
Brachioradialis
3 Extensor Digiti Minimi Extensor Digitorum
Extensor Pollicis Longus
4 Extensor Digitorum Extensor Digitorum
Extensor Carpi Ulnaris Extensor Carpi ulnaris
5 Extensor Digitorum Extensor Digiti Minimi
Extensor Pollicis Longus
6
Extensor Carpi Radialis Longus Anconeus
Extensor Carpi Radialis Brevis
Flexor Carpi Ulnaris Brachioradialis
7 Brachioradialis Flexor Carpi Ulnaris
Flexor Digitorum Superficialis
Figure 3.3: Placement of the Myo Armband on the user’s dominant arm.
3.3.2 Gestures
After the initial setup, participants performed ten hand gestures, which included a set of six wrist
motions and four finger motions (Fig. 3.4). The order of each motion was randomized for each
participant. Prior to the data collection, participants were instructed to perform each gesture
at a moderate and repeatable force level, i.e., there was no restriction on the amount of force
exerted by each participant. For each gesture, ten consecutive repetitions were performed, and
each repetition was held for five seconds with three seconds of resting time between repetitions.
The completion of the ten repetitions of the ten gestures was defined as a trial. Each trial was
performed in four different arm positions (Fig. 3.5) to prevent degradation of the classification
algorithm during the pattern recognition step, since it has been proven that changing the arm
position affects the classification performance [87]. Finally, each trial was video recorded to review
the motions performed by the participant in case any abnormalities in the data were found during
(a) (b) (c) (d) (e)
(f) (g) (h) (i) (j)
Figure 3.4: Wrist and finger motions that were recorded; a) Wrist Flexion (WF), b) Wrist Exten-sion (WE), c) Wrist Pronation (WP), d) Wrist Supination (WS), e) Wrist Adduction (WAd), f) Wrist Abduction (WAb), g) Hand Closed (HC), h) Hand Open (HO), i) Precision Pinch (PP), j) Key Pinch (KP).
(a) (b) (c) (d)
Figure 3.5: Arm positions used during data acquisition; a) forearm at full extension (0◦), b)
fore-arm flexed at 90◦, c) forearm flexed at 135◦, d) forearm at 90◦ flexion while externally
rotating the shoulder at 50◦.
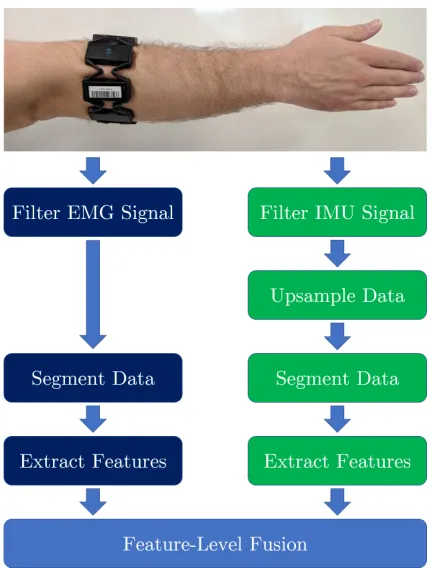
3.4
Data Processing
Collected EMG data were filtered using a 60 Hz notch filter to remove power line interference,
and a 4th order high-pass Butterworth filter with a cut-off frequency of 20 Hz. Accelerometer and
gyroscope data were filtered using a 4th order Butterworth band-pass filter with cut-off frequencies
of 0.2 Hz and 15 Hz to remove the gross orientation effects [88]. A summary of the data collection
Differential Amplifier
Notch Filter
High-pass Filter
Band-pass Filter
ADC Data
Segmentation
ADC Data
Segmentation EMG
IMU
Myo Armband PC
Figure 3.6: Block diagram of the EMG and IMU data collection and processing. EMG and IMU data collected from the Myo Armband were sent via Bluetooth to a PC running MAT-LAB. Then, the data were preprocessed before proceeding to the data segmentation step.
3.4.1 Signal Segmentation
The active region of the gesture,i.e., sections of the EMG and IMU data where the gesture motion
was being performed, was divided into segments using the following procedure. First, the active
area was computed by conditioning each EMG channel with the TKEO using Equation (2.1), and
then passed through a 4th order Butterworth low-pass filter with a 50 Hz cut-off frequency, before
it was finally rectified (Fig. 3.7), to improve the accuracy detection of the motion onset [65].
Then, the average absolute value of all the channels for each sample was computed using
Equation (3.1), resulting in the signal shown in Fig. 3.8a.
Ψavg =
1
n
n
X
i=1
|Ψi(t)|. (3.1)
In this equation, nis the number of channels and Ψi(t) represents the measure of sampletof the
sensori. Finally, Ψavg was smoothed using Equation (3.2), with a window size W = 60, to obtain
its root mean square Ψrms (Fig. 3.8b).
Ψrms=
v u u t
1
W
t+W−1 X
j=t
Ψ2
avg(j). (3.2)
The motion onset and offset were obtained from Ψrms using a variation of the double threshold
Figure 3.7: Sample data set showing a participant’s EMG signals after performing the WF gesture. The first column contains the EMG signals of channels 1, 3, 5, and 7; the second column contains the EMG signals of channels 2, 4, 6 and, 8. The EMG signal is represented in green, and the conditioned EMG signal with TKEO is represented in blue.
(a) (b)
maximas), whose values were above 10% of Ψrms global maxima. Then, the offset threshold was
set to 60% of the onset threshold. These percentages were determined experimentally. Afterwards,
the indices of Ψrms where the onset and offset occurred were taken and matched to every channel
of the EMG (Figure 3.9).
To avoid any false positives due to involuntary motions, data from the active region that was
less than 750 samples (3.75 seconds) was discarded. Furthermore, data longer than 1200 samples
(6 seconds) was truncated to 1000 samples (5 seconds as determined in the experimental protocol)
in case that the smoothed EMG signal failed to cross the offset threshold. In the event that the
double threshold technique failed to detect an active region, it was defined as the area between
samples 800 and 1650, which corresponds to the time frame when the participant was prompted
to perform the gesture. Using this technique, the active region of 72.51% of the data sets was
successfully detected.
To determine the onset and offset of the motion in the IMU data, the accelerometer and
gyroscopic data were upsampled from 50 Hz to 200 Hz using a cubic spline, so that the number of
maximum acceptable controller delay of upper-limb myoelectric devices should be 300 ms.
3.4.2 Feature Extraction
For both sensor modalities, time domain features were extracted from each window due to their
low complexity and the fact that they do not require any transformation into the frequency domain
[70], which reduces any extra computational resources. The following time domain features were
extracted:
From each EMG channel: MAV, MAVS, WL, 4th order AR and ZC.
From each axis of the IMU’s accelerometer and gyroscope: MAV and WL.
The result was a vector of 64 features ([4 features + 4 AR coefficients] × 8 channels) for
each window of the EMG data, and a vector of 12 features (2 features × 3 accelerometer axes
+ 2 features× 3 gyroscope axes) for each window of the IMU data. From these feature vectors,
two data sets were developed. The first one was formed by the 64 features extracted from each
window of the EMG data, and the second data set contained all 64 EMG features plus, the 12
extracted from the IMU data. In the case of the second data set, a feature-level fusion approach
was employed by concatenating each feature vector to form a single vector of 76 features. By using
this fusion level, correlated features can be detected better during the feature reduction phase [90].
![Table 2.2: Control modalities used during robot-assisted therapies [10, 41].](https://thumb-us.123doks.com/thumbv2/123dok_us/1893222.1247538/31.612.81.548.103.740/table-control-modalities-used-robot-assisted-therapies.webp)