Electronic Thesis and Dissertation Repository
2-4-2019 9:00 AM
Alpha-Synuclein Toxicity is Caused by Mitochondrial Dysfunction
Alpha-Synuclein Toxicity is Caused by Mitochondrial Dysfunction
Michael G. Tauro
The University of Western Ontario
Supervisor
Duennwald, Martin L.
The University of Western Ontario
Graduate Program in Pathology
A thesis submitted in partial fulfillment of the requirements for the degree in Master of Science © Michael G. Tauro 2019
Follow this and additional works at: https://ir.lib.uwo.ca/etd Part of the Cell Biology Commons
Recommended Citation Recommended Citation
Tauro, Michael G., "Alpha-Synuclein Toxicity is Caused by Mitochondrial Dysfunction" (2019). Electronic Thesis and Dissertation Repository. 6019.
https://ir.lib.uwo.ca/etd/6019
This Dissertation/Thesis is brought to you for free and open access by Scholarship@Western. It has been accepted for inclusion in Electronic Thesis and Dissertation Repository by an authorized administrator of
i
Abstract
Parkinson’s disease (PD) is the second most common neurodegenerative disorder, affecting roughly 1% of the population over the age of sixty years. Alpha-synuclein (aSyn) is a protein implicated in both familial and idiopathic forms of PD, yet despite the wealth of data implicating aSyn as a causative agent in PD, the mechanisms underlying its toxicity remain mostly unknown. Mitochondrial dysfunction is a major hallmark of PD, yet there is only limited evidence linking aSyn toxicity to mitochondrial dysfunction. My study establishes a novel aSyn model in respiring yeast cells, which allows me to explore how aSyn affects mitochondrial homeostasis and function. My data shows that mitochondrial fission and fusion, ER-mitochondria communication, and sphingolipid metabolism, interact genetically with aSyn toxicity. My work, therefore, indicates that aSyn impairs mitochondrial homeostasis, which might be a key contributor to neurodegeneration in PD.
Key Words
ii
Acknowledgements
First, I would like to thank the Parkinson Society Southwestern Ontario for trusting in my work enough to provide me with a scholarship. Winning the support of such a passionate and caring organization was a great honour and highlight of my academic career.
I would also like to thank Martin and everyone else in the Duennwald lab. Martin gave me the academic freedom I needed, worked tirelessly to keep me on track and became a little more grey in the process. I greatly appreciated his guidance and support. I would also like to thank our postdoc Dr. Mohammad Esmaeili for always humouring me with conversations about curing Parkinson’s or quick lessons in Farsi.
I thank my advisory committee Dr. Gary Shaw, Dr. Christopher Howlett and Dr. Patrick Lajoie for their continued support and willingness to put up with my many eccentricities.
The students in the Duennwald made my time as a grad student so much more enjoyable and helped greatly with the ups and downs that come with graduate school. Sonja was there from the start and was always happy to provide words of support and encouragement. The
undergrads I met and worked with were all great people and sometimes even enjoyed my antics, so thank you Soojie, Mihai, Andrey, Angela and Karina! I must also thank Lilian who first trained me and made me a western blot master, it is as always much appreciated! I would also like to thank the 2 other musketeers Daniel and Vy for always having my back and being such great friends.
iii
Abstract ... i
Acknowledgments ... ii
Table of contents ... iii
List of Tables ... vi
List of Figures... vi
List of Appendices ... vii
List of Abbreviations ...viii
Chapter 1 ... 1
1 Introduction ... 1
1.1 Parkinson’s Disease ... 1
1.2 Alpha-Synuclein ... 4
1.3 Alpha-Synuclein Models ... 6
1.4 Alpha-Synuclein Yeast Model ... 9
1.5 Autophagy in Parkison’s Disease ... 11
1.6 Oxidative Stress in Parkinson’s Disease ... 12
1.7 Mitochondrila Dysfunction in Parkinson’s Disease ... 14
1.8 Mitochondrial Homeostasis... 15
1.8.1 Mitochondrial Fission and Fusion ... 15
1.8.2 Mitochondrial Biogenesis and Mitophagy... 18
1.8.3 Prohibitins ... 2
1.8 Sphingolipids ... 23
1.10 Rationale, Hypothesis and Significance... 24
1.10.1 Rationale ... 24
1.10.2 Hypothesis... 24
1.10.3 Significance ... 24
2 Materials and Methods ... 26
iv
2.1.1 Yeast strains and media ... 26
2.1.2 Yeast Media ... 28
2.1.3 E. coli strains and media ... 28
2.1.4 DNA Plasmids ... 29
2.1.5 Antibodies ... 30
2.2 Methods ... 30
2.2.1 High Efficiency Yeast Transformation ... 30
2.2.2 E. Coli Transformation ... 31
2.2.3 Gateway Cloning ... 31
2.2.3.1 PCR... 32
2.2.3.2 BP Reaction ... 32
2.2.3.3 LR Reaction ... 33
2.2.4 Yeast Spotting Assays ... 33
2.2.6 Western Blot ... 34
2.2.6.1 Protein Extraction ... 34
2.2.6.2 Normalization of Protein Concentrations ... 35
2.2.6.3 SDS-PAGE ... 35
2.2.6.4 Immunoblotting and Analysis ... 35
2.2.7 Sedimentation Assay ... 35
2.2.7.1 Protein Extraction ... 35
2.2.8 Semi-Denaturing Detergent Agarose Gel Electrophoresis (SDD-AGE) ... 36
2.2.8.1 Protein Extraction ... 36
Chapter 3 ... 39
3 Results ... 39
3.1 Expansion of the Alpha-Synuclein (aSyn)Yeast Model – Aggregation and Toxicity in Respiring Cells ... 39
3.4 Petite-cells show no difference in aSyn toxicity and aggregation ... 53
3.5 Oxidative stress does not exacerbate aSyn toxicity and aggregation ... 56
v
3.7 Defects in ERMES exacerbates aSyn toxicity and increases aggregation ... 62
3.8 Prohibitin deletions exacerbate aSyn toxicity ... 65
3.9 Mitochondrial Homeostasis – Fission and Fusion ... 70
3.9.1 Deletion of mitochondrial fission genes reduces aSyn toxicity and aSyn aggregation ... 70
3.9.2 Deletion of mitochondrial fusion genes exacerbates aSyn toxicity and disrupts mitochondrial homeostasis ... 78
Chapter 4 ... 100
4 Discussion ... 100
4.1: A novel alpha-Synuclein model in respiring yeast ... 100
4.2: Oxidative Stress and aSyn Toxicity ... 101
4.3: Autophagy and Mitophagy Interact Genetically with aSyn Toxicity ... 102
4.4: Loss of ERMES Function Increases aSyn Toxicity and Aggregation ... 103
4.4: Impaired Prohibitin function Exacerbates aSyn Toxicity and Results in Abnormal Mitochondrial Morphology ... 103
4.7: Alkaline dihydroceramidase deficiency Rescues aSyn Toxicity... 104
4.8: aSyn Interacts Genetically with Mitochondrial Fission and Fusion ... 105
4.8 Conclusion ... 106
4.9 Limitations... 106
4.11 Significance ... 107
Appendices ... 109
References ... 110
vi
List of Tables
Table 1: Yeast deletion strains used in this study ... 28
Table 2: Plasmids created using Gateway Cloning in this study ... 31
Table 3: Antibodies used in this study. ... 32
List of Figures
Figure 1 ... 2Figure 2: Structural representation of the protein Alpha-Synuclein (aSyn): ... 4
Figure 3: Model systems to study aSyn ... 7
Figure 4: Saccharomyces cerevisiae aSyn model. ... 9
Figure 5: Schematic displaying some of the key proteins involved in mitochondrial fission. ... 14
Figure 6: Schematic displaying some of the key proteins involved in mitochondrial fusion ... 15
Figure 7: Simplified depiction of mitophagy ... 18
Figure 8: Simplified representation of prohibitin proteins ... 21
Figure 9: Schematic showing effects of decreased (left) and increased (right) ceramide levels .. 23
Figure 10: Simplified representation of prohibitin proteins... 41
Figure 11: Fluorescence microscopy of GFP-tagged aSyn and cells expressing mtGFP in the absence and presence of aSyn ... 43
Figure 12: aSyn toxicity in yeast cells grown in different carbon sources ... 46
Figure 13: Fluorescence microscopy of aSyn-GFP ... 48
Figure 14: Toxicity of previously established enhancers ... 51
Figure 15:Spotting assays of WT and petite yeast cells expressing aSyn-GFP ... 54
vii
Figure 17: aSyn toxicity in the presence of rapamycin and bafilomycin. ... 60
Figure 18:aSyn toxicity and aggregation in ERMES deficient cells ... 63
Figure 19:aSyn toxicity in yeast cells deleted for PBH1 or PBH2... 66
Figure 20: Fluorescence microscopy of WT and △phb2 yeast cells expressing mtGFP and aSyn ... 68
Figure 21: Genetic interactions of aSyn and mitochondrial fission genes ... 72
Figure 22: Fluorescence microscopy of WT and △fis1 yeast cells expressing mtGFP in the absence or presence of aSyn ... 74
Figure 23: aSyn aggregation in fission deficient yeast cells ... 76
Figure 24: Genetic interactions of aSyn and mitochondrial fusion gene deletions ... 80
Figure 25: Fluorescence microscopy of WT and △mdm30 yeast cells expressing mtGFP in the absence or presence of aSyn ... 82
Figure 26: aSyn aggregation in fusion deficient yeast ... 84
Figure 27: Genetic interactions of aSyn and a mitophagy gene deletion ... 87
Figure 28: Fluorescence microscopy of WT and △atg32 yeast cells expressing mtGFP in the absence or presence of aSyn ... 89
Figure 29: aSyn aggregation in mitophagy deficient yeast cells ... 91
Figure 30: aSyn toxicity and ceramide metabolism ... 94
Figure 31: Toxic polyQ expansion protein and mitochondrial homeostasis ... 97
Figure 32: Simplified schematic depicting the lifecycle of mitochondria in a healthy cell (top) and a cell expressing aSyn (bottom). ... 108
viii
List of Abbreviations
2xYT — 2x yeast extract tryptone
72Q — polyQ-expanded huntingtin protein AD — Alzheimer’s disease
Amp — Ampicillin
BCA assay — Bicinchoninic acid assay BSA — Bovine serum albumin
DMSO — Dimethyl sulfoxide DNA — Deoxyribonucleic acid ER — Endoplasmic reticulum Gal — Galactose
GFP — Green fluorescent protein H2O2 — hydrogen peroxide HD — Huntington’s disease Kan — Kanamycin
LB — Lysogeny Broth Li — Lithium
MAT — Mating type
MPP+ — 1-methyl-4-phenylpyridinium mRNA — Messenger RNA
NEM — N-Ethylmaleimide O2- — superoxide
OH- — hydroxide radicals
OD600 — Optical Density at 600 nm
PBST — Phosphate buffered saline with tween PCR — Polymerase chain reaction
PD — Parkinson’s disease PEG — Polyethylene glycol
ix RNA — Riboneucleic acid
ROS — Reactive oxygen species SD — Selective dextrose
SDD-AGE — Semi-Denaturating Detergent Agarose Gel Electrophoresis. SDS — Sodium dodecyl sulfate
SDS-PAGE — Sodium dodecyl sulfate polyacrylamide gel electrophoresis SGal — Selective galactose
SOD2 — Superoxide dismutase 2 TE — Tris-EDTA
UPS — Ubiquitin proteasome system WT — Wild type
YNB — Yeast nitrogen base
Chapter 1
1
Introduction
1.1
Parkinson’s Disease
Parkinson’s Disease (PD) is the most common motor disorder and the second most common neurodegenerative disorder, with approximately 1% of the population over the age of 60 suffering from PD (1). Males are more likely to be affected by PD than females, at a ratio of 3:2, and the average life expectancy following diagnosis is 7-14 years (2). Symptoms of PD can be divided into motor and non-motor symptoms. Non-motor symptoms, while not present in all cases, include general mood disorders, depression and anxiety, dementia, sleep disorders as well as cognitive symptoms (3). Generally, cognitive symptoms entail difficulties with executive functioning, such as planning, controlling attention, and increased impulsivity. It is generally accepted that most non-motor symptoms present in the later stages of the disease, yet some evidence suggests certain cognitive disturbances might actually be the earliest sign of PD (4). Motor symptoms comprise what is termed “parkinsonism”, and include bradykinesia (slowed movements), resting tremor, forward gait, and decreased facial expressions (5).
The most prominent pathological hallmark of PD is the appearance of Lewy bodies, which are large protein aggregates composed primarily of the protein alpha-synuclein (aSyn) (10). Initially, Lewy bodies were thought to cause neurodegeneration, yet recent evidence indicates a protective function (11).
The exact mechanisms underlying the cause of PD remain unknown, however, many causative agents have been identified (13). While the majority of cases of PD are idiopathic, i.e. without a known cause, a subset of approximately 5-15% of cases arise through inherited genetic mutations (14). These cases are termed familial PD (fPD) and have contributed much to our understanding of the causes of PD, generally. For instance, we now know that aSyn has a causative role in both idiopathic and fPD, and that mitochondrial dysfunction is intimately linked to PD, as mutations in three separate genes (PINK1, PARK2, PARK7) involved in mitochondrial homeostasis result in fPD (15).
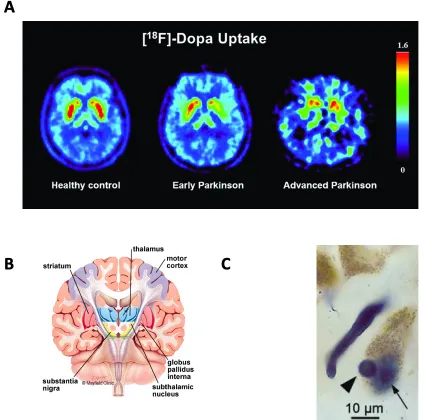
There is presently no cure for PD nor are there therapies that halt or delay neurodegeneration. There are, however, treatment options, which provide relief from PD symptoms (16). Most common is treatment with the drug L-DOPA. L-DOPA is a molecular precursor of the neurotransmitter Dopamine (DA), which is converted into DA by neurons (17). As the neurons affected by PD are predominantly dopaminergic, the goal with L-DOPA therapy is to increase the amount of DA in the remaining neurons and compensate for the lack of synaptic activity resulting from the neurodegeneration of dopaminergic (DAergic) neurons (17). However, L-DOPA loses effectiveness after approximately five years and has undesired side effects, such as dyskinesia (18). The reason for the loss in efficacy is not completely understood, yet it is believed to be caused by the continual neurodegeneration of the remaining DAergic neurons, which necessitates treatment with higher L-DOPA doses, resulting in increased side effects (18). As a means of postponing the loss in efficacy, other drugs such as MAOIs (monoamine oxidase inhibitors) are often used in advance or in unison with L-DOPA. MAOIs work by inhibiting MAO, an enzyme which breaks down DA in the synaptic cleft (19). With the inhibition of MAO, DA can remain in the synaptic cleft longer and stimulate the post-synaptic neuron for an extended period of time. Studies seeking to determine whether treatment with MAOIs alone delays progression of PD symptoms compared to treatment with L-DOPA have remained inconclusive (20).
1.2
Alpha-Synuclein
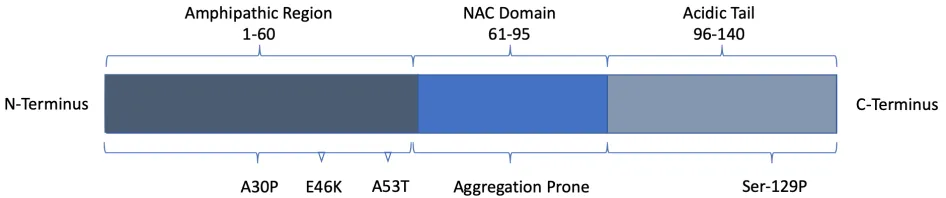
Figure 2: Structural representation of the protein Alpha-Synuclein (aSyn).
Alpha-Synuclein (aSyn) is an intrinsically disordered protein composed of 140 amino acids encoded by the SNCA gene (22). The N-terminal region of aSyn contains an amphipathic 60
residue sequence, while the central NAC (non-amyloid-b component) region (residues 61-95) is highly hydrophobic and involved in aggregation. The remaining residues 96-140 compose an unstructured highly acidic region (23).
aSyn can adopt an extended helical structure when bound to phospholipid bilayer membranes, yet it can also exist in many other forms when bound to other membranes, individual lipids, or other proteins (23). aSyn can exist both as a monomer, oligomer, protofibril, fibril, Lewy neurite, and finally as the main component of a Lewy body (24). Many of the conformational changes in aSyn are due to posttranslational modifications (25). Phosphorylation, nitration and modifications by DA and DA derivatives increase aSyn oligomerization (26). DA-aSyn modifications reduce degradation by chaperone-mediated autophagy of aSyn, while phosphorylation at Ser-129 also reduces aSyn clearance and degradation (27). Samples from PD unaffected brains show only 4% of Ser-129 phosphorylated aSyn, whereas PD patient samples reveal approximately 90% of aSyn in Lewy bodies is phosphorylated at Ser-129.
post-synaptic dendrites, which is, at least according to some studies, the major cause of PD symptoms (30).
aSyn is also known to display great seeding ability, i.e. when injected into healthy brains, aggregated forms of aSyn can induce aSyn aggregation and neurodegeneration throughout many brain regions (31). Lewy bodies are the major pathological hallmark of PD, and it is through the study of Lewy bodies that aSyn was first identified as a potential causative agent in PD. Indeed, aSyn has a causal role in familial PD, as duplications or triplications of the SNCA gene leads to familial PD, as do several point mutations in SNCA (Figure 2) (32). Moreover, the evidence is overwhelming that aSyn also plays a causative role in idiopathic PD, as the vast majority of idiopathic cases show Lewy bodies (31, 30, 23). Due to the virtual omnipresence of Lewy bodies in PD, they were initially believed to be the most toxic species of aSyn and thus cause neurodegeneration, yet this idea has recently been challenged, with many studies indicating a protective role for Lewy bodies (24). For example, the number of Lewy bodies does not correlate with the severity of PD symptoms and approximately 10% of neurologically healthy individuals over the age of 60 have been found to contain Lewy bodies. Furthermore, certain forms of familial PD (i.e. those caused by PARK7 mutations) do not present with Lewy bodies at all (33). Thus, it is reasonable to assume that Lewy bodies can, in fact, be protective, acting as a compactor to sequester the more toxic forms of aSyn (34).In line with this idea, much evidence in the past decade indicates that aSyn oligomers are the most toxic form of aSyn (35).
In any case, aSyn has been shown to interfere with a variety of cellular functions, which can lead to PD-associated neurodegeneration. While the earliest and most dominant pathways leading to aSyn-induced toxicity remain unknown, a few main players have been identified (41). For instance, aSyn interferes with lysosomal function and autophagy (42). In mammalian cell models, bafilomycin, an inhibitor of autophagy, leads to an increase in aSyn aggregation and cell death. Conversely, treatment with rapamycin, a drug, which induces increased autophagy, reduced aSyn toxicity (43). There is also evidence that aSyn, more specifically aSyn oligomers, impair protein degradation by the 26S proteasome (44). The aSyn-yeast model, which will be discussed in detail below, highlights ER-Golgi trafficking and lipid metabolism as the main pathways through which aSyn elicits cellular toxicity (45).
1.3
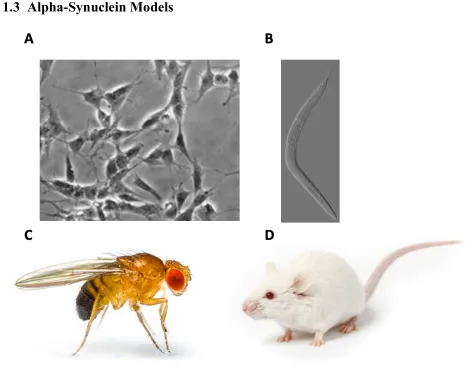
Alpha-Synuclein Models
Figure 3: Model systems to study aSyn. A Microscopic image ofdifferentiated SH-SY5Y cells (49). B Microscopic image of C. elegans (133). C Drosophila melanogaster or fruit fly (134). D Mouse (135)
To better understand the normal and pathological roles of aSyn in PD, various model systems and organisms have been utilized. These model systems range from tissue culture cells to unicellular organisms to non-mammalian and mammalian animal models.
differentiated neuronal cells in the brain and that aSyn toxicity and aggregation arise only after extremely high aSyn expression or addition of other cellular stressors (48). Furthermore, these cells are generally cultured with glucose as a carbon source, causing approximately 90% of ATP to be generated through glycolysis (47). As neurons generate approximately 90% of their ATP through oxidative phosphorylation, this model does not provide an accurate representation of the metabolic activity that occurs in the neurons affected in PD, such as many processes related to mitochondria (51).
1.4
Alpha-Synuclein Yeast Model
Figure 4: Saccharomyces cerevisiae aSyn Model. A Spotting assay (left) and fluorescence microscopy (right) of GFP-tagged aSyn under low expression. B Spotting assay (left) and fluorescence microscopy (right) of GFP-tagged aSyn under high expression.
Many studies have since explored the genetic interactions of aSyn in this yeast model using high-throughput screens to uncover genetic enhancers and suppressors of aSyn toxicity. These screens have revealed that at high levels of aSyn expression, gene deletions related to lipid metabolism and ER-Golgi vesicle trafficking (56) strongly enhance aSyn toxicity. Conversely, genetic screens searching for genetic suppressors of aSyn-toxicity found that genes involved in ER-Golgi vesicle trafficking were the most robust suppressors of aSyn toxicity when overexpressed together with high levels of aSyn expression (57). The most successful genetic suppressor identified in these screens was YPT1, the yeast orthologue to the mammalian RAB1. YPT1 encodes Rab GTPase, an enzyme involved in ER-Golgi trafficking. Overexpression of the Ypt1 protein leads to increased ER-Golgi vesicle trafficking. In fruit fly and nematode aSyn-models, RAB1 overexpression also significantly reduced neurodegeneration of dopaminergic neurons caused by aSyn expression (55). Thus, findings from the yeast model are replicated in other model systems.
However, one problem with this aSyn-yeast model is that genes related to mitochondrial homeostasis have not been identified as major genetic modifiers of aSyn toxicity, which is much in contrast to studies in virtually all other models. As mitochondrial dysfunction is intimately linked both to PD and aSyn-related dysfunctions, this lack of aSyn-mitochondrial interaction appears to be a shortcoming of the aSyn yeast model.
One possible explanation for the lack of genetic interactions pointing to mitochondrial dysfunction could be the use of the carbon sources used in the majority of previous aSyn yeast studies. The overwhelming majority of yeast work relies on aSyn expression using a galactose-inducible promoter, thus galactose is used as the sole carbon source to induce the expression of aSyn (58). In yeast, galactose is first converted into glucose-6-phosphate and then metabolized by glycolysis, which is called fermentation in microbes (59). In fact, yeast cells that are provided with ample fermentable carbon sources (e.g. glucose or galactose) will preferentially utilize glycolysis /fermentation to produce ATP before switching to primarily oxidative phosphorylation once the fermentable carbon sources are depleted. Furthermore, yeast deletion strains, which are completely deficient in oxidative phosphorylation, are still able to grow in glucose and galactose as a sole carbon source (60).
Therefore, we argue that aSyn does, in fact, interfere with yeast mitochondria, yet due to the use of galactose as a carbon source, these pathways could not be discovered in previous studies as the mitochondria were not required in these yeast models. To address this problem, we used non-fermentable carbons sources, such as glycerol, which forces the cells to produce ATP via oxidative phosphorylation combined with low expression of aSyn in our revised yeast model. Our aSyn yeast model creates a metabolic profile that more accurately represents the metabolic profile of neurons affected by PD (45). Also, as yeast grown with glycerol divide very slowly, they are more similar to neurons, which typically do not divide after maturation (61). Finally, as glycerol requires yeast to utilize their mitochondria to produce ATP, mitochondrial homeostasis will be crucial for cell growth, thus any disturbances to the mitochondria caused by aSyn will be obvious.
1.5
Autophagy in PD
Autophagocytosis, or more simply autophagy, is the process by which a cell breaks down or degrades various components of the cytoplasm (62). Autophagy can be divided into two distinct classes, macroautophagy and microautophagy (60). Both macroautophagy and microautophagy can be selective or non-selective processes. Macroautophagy begins by the formation of a phagophore, which forms around the cargo until the cargo is fully engulfed. Once the cargo is sequestered, the enclosed capsule is considered an autophagosome. The autophagosome will then fuse with the vacuole (yeast and plants) or lysosome (animals) where its content is degraded (63). As opposed to macroautophagy, in microautophagy cargo is not transported to the vacuole/lysosome by autophagosomes but is sequestered directly by invagination of the vacuolar/lysosomal membrane. Microauthophagy encompasses the degradation of mitochondria, peroxisomes, and components on the nucleus (61).
a drug that inhibits autophagy, exacerbates the negative consequences of oxidative stress and protein misfolding (67). For example, bafilomycin increases aSyn-toxicity in both cellular and animal models overexpressing aSyn (68).
Dysfunctional autophagy is implicated in many diseases, including neurodegenerative diseases. In Alzheimer’s disease, PD, and Huntington’s disease, it is believed that inadequate autophagy at least partially causes the accumulation of toxic protein aggregates (69). Thus, autophagy is a crucial process which is indispensable for cellular homeostasis and may play an important role in neurodegeneration.
1.6
Oxidative Stress in PD
Oxidative stress refers to the imbalance between the concentration of reactive oxygen species (ROS) and the cell’s ability to detoxify these ROS and counteract the damages they cause. Common ROS include superoxide, hydrogen peroxide and the hydroxyl radical (70). ROS cause damage via the redox reactions they form with various cellular components. ROS oxidize lipids, proteins and DNA, resulting in a variety of negative consequences. Lipids that are oxidized by ROS can form unstable lipid radicals, which can then trigger a chain reaction known as lipid peroxidation (71). Lipid peroxidation results in damage to cell membranes and the production of carcinogens or mutagens such as malondialdehyde (72). While all amino acid residues are susceptible to oxidation, cysteines are highly susceptible to oxidation due to their nucleophilic thiol containing side chain (68). Oxidation of proteins may result in a change of conformation, solubility, loss of function or gain of toxic function (69). DNA oxidation most often occurs at the guanine bases, which have the highest propensity for oxidation relative to adenine, cytosine and thymine (73). DNA oxidation can lead to increased mutations of the genome (71).
1.7
Mitochondrial Dysfunction in PD
Mitochondria, often touted the powerhouses of the cell, are involved in many cellular processes, including energy production and specific cell-signaling pathways (76), such as those regulating apoptosis. The main components of the mitochondria are the outer mitochondrial membrane (OMM), inner mitochondrial membrane (IMM), mitochondrial matrix, mitochondrial cristae, and the intermembrane space (74). The mitochondrial matrix is enclosed by the IMM and harbours all enzymes of the Krebs cycle, mitochondrial DNA (mtDNA), which encodes 13 mitochondrial proteins in humans, and nine in yeast (77). The OMM is involved in many signaling pathways and the initiation of fission and fusion events (78). The IMM harbours the proteins that build the electron transport chain (ETC) and forms the mitochondrial cristae.
The ETC is composed of complexes I-V, with Complex V being the site of ATP synthesis within oxidative phosphorylation where ADP is phosphorylated to generate ATP (75). Mitochondria generate approximately 30 molecules of ATP per molecule of glucose, compared to only two molecules of ATP per glucose produced by glycolysis or fermentation (74). However, the ETC regularly releases reactive oxygen species (ROS), such as superoxide, as a byproduct. Increased levels of ROS (oxidative stress) damages nucleic acids, proteins, and lipids, which can lead to cellular dysfunction and death (79). To counteract the production of ROS that accompanies oxidative phosphorylation, the cell employs various antioxidants, such as SOD2, which localizes to the mitochondria and converts superoxide to hydrogen peroxide and diatomic oxygen (80). Increased ROS production and decreased antioxidant function are associated with the negative effects of ageing as well as many neurodegenerative diseases (78).
encephalopathy (80). Diseases with secondary mitochondrial dysfunction include many neurodegenerative diseases, such as Huntington’s disease, Amyotrophic Lateral Sclerosis (ALS), Alzheimer’s disease and PD (83). Mitochondrial dysfunction in PD is a relatively recent finding, yet there is now abundant evidence suggesting a causal role in PD pathology.
First, there is strong evidence for high levels of oxidative stress in the neurons affected by PD. These neurons show heightened levels of oxidized lipids, DNA, and carbonylated proteins (73). As the main producer of ROS in neurons are mitochondria, this suggests mitochondrial dysfunction. Much evidence has also linked mitochondrial dysfunction and oxidative stress to PD. For example, MPTP is a toxin, which after conversion to MPP+, inhibits complex I of the ETC in DAergic neurons and causes Parkinsonism. Further, patient samples from people suffering from PD show decreased complex I activity. Interestingly, this mitochondrial defect has been found in skeletal muscle and platelets, suggesting global mitochondrial dysfunction beyond neurons is concordant with PD (84). Moreover, complex I dysfunction can cause both increased ROS and apoptosis (85).
Other evidence for mitochondrial dysfunction in PD comes from both patient samples and PD models, which often show mitochondrial fragmentation, complex I deficiency and mtDNA mutations (86). Mitochondrial fragmentation is generally associated with pro-apoptotic signaling, yet it can also be a result of general cell stress or defects in the process of mitochondrial fusion (87).
1.8
Mitochondrial Homeostasis
Mitochondrial homeostasis describes all cellular processes involved in the proper biogenesis, maintenance, and degradation of mitochondria, such as mitochondrial fusion and fission, de novo mitochondrial synthesis, degradation of mitochondria via autophagy (i.e. mitophagy), and the communication between mitochondria and other cellular organelles, such as peroxisomes and the endoplasmic reticulum (ER).
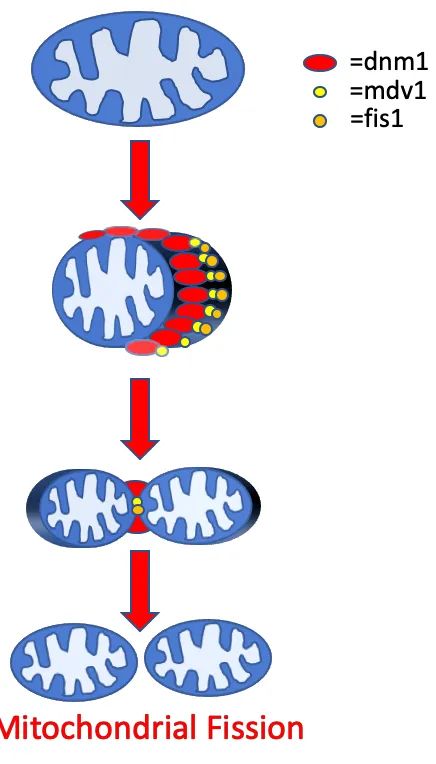
1.8.1
Mitochondrial Fission and Fusion
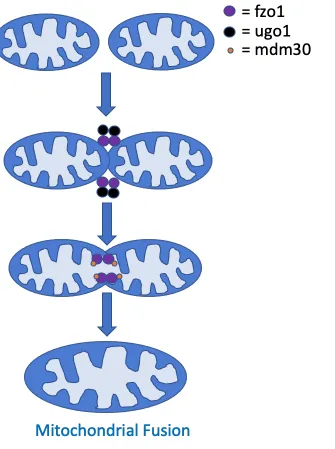
Figure 6: Schematic displaying some of the key proteins involved in mitochondrial fusion.
The protein machinery used to facilitate mitochondrial fission in mammalian cells contains the proteins Drp1, Fis1, Mff, MiD49 and MiD51. In budding yeast, the key players are Dnm1, the yeast homolog to Drp1, Fis1 and Mdv1 (87). Dnm1, a dynamin-related GTPase, begins the fission process by clustering on mitochondrial microtubules and initiating membrane constriction and excision (90). Microscopy shows Dnm1 is recruited to and clusters around select areas of mitochondria before fission occurs (91). Fis1 binds to the outer mitochondrial membrane and then, facilitated by Mdv1, binds to Dnm1, which together initiate mitochondrial membrane constriction and fission (89).
Mitochondrial fission is involved in processes, such as mitochondrial transport, mitophagy, and programmed cell death. Rodent knockout models have shown that fission is necessary for proper development, as Drp1 knockout studies in mice show prenatal lethality (92). In yeast, deletion of genes responsible for fission, such as DNM1 or FIS1 results in increased resistance to cell death, while cells also show defects in oxidative phosphorylation and mitophagy (87, 88).
The protein machinery necessary for mitochondrial fusion in mammalian cells contains the proteins Opa1 and the mitofusins Mfn1 and Mfn2. In yeast, the homolog for Opa1 is Mgm1, while Fzo1 is a conserved mitofusin. Two further crucial fusion machinery proteins are Ugo1 and Mdm30 (93). Studies suggest that Fzo1 is necessary to initiate the initial docking stage between two OMMs. Mgm1 mediates fusion of the IMM, which occurs separately, yet in temporal coordination with the fusion of the OMM (91). Ugo1 links Mgm1 and Fzo1 together to coordinate both IMM and OMM fusion. Mdm30 is required for Fzo1 ubiquitination, which initiates mitochondrial fusion (88, 91).
is necessary for both oxidative phosphorylation and mitochondrial biogenesis (94). Concordantly, cells that are deficient in mitochondrial fusion are unable to respire, have increased mtDNA mutations, decreased total mtDNA, and increased heterogeneity of mitochondrial content (87, 91). Mitochondrial content mixing was shown to be crucial as mitochondria that are unable to fuse their outer membranes have severe defects. Similar defects are observed for mitochondria that are able to fuse only their outer membranes and but not the inner membranes (95).
To conclude, both mitochondrial fission and fusion are opposing, necessary processes that work in concert to maintain mitochondrial homeostasis and general cellular health.
1.8.2
Mitochondrial Biogenesis and Mitophagy
Figure 7: Simplified Depiction of Mitophagy
mitochondrial biogenesis, or mitobiogenesis (96). Mitophagy is the selective degradation of mitochondria by autophagy, which can occur independently of general autophagy (94). Although the exact mechanisms and pathways of mitophagy are not completely understood, much progress has been made using both yeast and mammalian cell models (94).
Mitophagy occurs in three stages, starting with the initial fission of the mitochondrion to be degraded, followed by the engulfment into an autophagosome, and finally inclusion into the lysosome or vacuole (97). In yeast, the receptor Atg32 is required for the initiation of mitophagy. Mitophagy is initiated after Atg32 is phosphorylated and subsequently binds to the mitochondrial outer membrane (95). Atg32 then recruits various fission proteins to induce mitochondrial fission, and autophagy-related (ATG) proteins, such as Atg8, which facilitate the binding to isolation membranes. These isolation membranes fuse around the mitochondrion, resulting in an autophagosome that engulfs the mitochondrion targeted for degradation. The autophagosome then fuses with the lysosome or vacuole where the mitochondria are degraded (94, 95).
Mitophagy in mammalian cells occurs through a similar pathway, yet there are additional modes of mitophagy, which appear to be particular to mammalian cells. For example, there is no known parallel to PINK1/parkin-mediated mitophagy in yeast (98). In mammalian cells, loss of mitochondrial membrane potential causes the accumulation of the protein PINK1 at the OMM. PINK1 then recruits the protein parkin, an E3-like ubiquitin ligase, to the mitochondria where it is proposed to facilitate ubiquitination of the proteins in the OMM. Parkin is also believed to recruit various other downstream actors in mitophagy, such as LC3, the homolog of yeast Atg8, which is necessary for lysosome formation (99).
Mitophagy has been proposed to protect the cell against ROS and pro-apoptotic factors that mitochondria increasingly release during the course of ageing (100). In line with this theory, yeast cells deficient in mitophagy that are grown in non-fermentable carbon sources have a decreased chronological lifespan, increased ROS accumulation, and increased mtDNA mutations (101).
protein 1) to begin expressing proteins necessary for mitochondrial biogenesis. Paramount to this process is the protein mTFA (mitochondrial transcription factor A), which is imported into the mitochondria where it activates expression of the proteins encoded by mtDNA (100). Mitochondrial biogenesis can be activated by many factors, such as cytosolic Ca+2 concentration,
nitric oxide (NO), AMPK, SIRT1, and mitophagy. Generally, mitobiogenesis is upregulated in response to greater energetic demands (103). This can be a result of increased exercise in animals or decreased mitochondrial content on a cellular level (104).
While mitophagy relies solely on mitochondrial fission, mitobiogenesis relies on a concert of both fusion and fission (100, 101, 102). Mitofusins, for example, are downstream effectors of mitobiogenesis, while fission-related proteins, such as Drp1, are upregulated during mitobiogenesis (105). Mitochondrial fission may provide an increase in the number of individual mitochondria, which can be used as templates for mitobiogenesis (103). Mitochondrial fusion, however, appears necessary for the fusing of newly synthesized mitochondrial membranes (100). Indeed, mitophagy and mitobiogenesis appear to complement each other, with high levels of mitophagy often leading to an increase in mitobiogenesis (106).
Dysfunctions in mitiobiogenesis have been implicated in numerous diseases and cell-death pathways (107). Overactivation of PGC-1a has been postulated as a cause of frataxin deficiency in Friedreich's Ataxia (108). Yet many disorders relating to mitobiogenesis appear to be decreased
1.8.3
Prohibitins
Figure 8: Simplified Representation of Prohibitin Proteins. IMM= inter mitochondrial membrane and IMS= inter-membrane space.
Deletion of either PHB1 or PHB2 inhibit prohibitin complex assembly and the deletion of one prohibit encoding gene results in the reduction of proteins levels of the other prohibitin. This appears to be due to increased degradation of the remaining prohibitin protein as it can no longer form the prohibitin complex (107). Prohibitins have been purported to participate in a wide variety of functions, such as cell cycle regulation, transcriptional regulation, and apoptosis (111). However, prohibitins are best known for their role in mitochondrial homeostasis.
Prohibitins are involved in mitochondrial biogenesis, in establishing mitochondrial cristae morphology, and chaperone activity for mitochondrial proteins (109). As the exact molecular mechanisms by which prohibitins exert their functions remain somewhat unclear, most information relating to their function comes from knock-down, knockout, or gene deletion studies. For example, knock-down studies in mice and C. elegans reveal that prohibitins are necessary for embryonic development (112). In HeLa cells, knockdown of prohibitins results in fragmented mitochondria (109). Mouse embryonic fibroblasts revealed that a knockdown of either prohibitin resulted in abnormal mitochondrial cristae morphology (109).
Perhaps the most relevant finding to PD research is that Phb2 is a necessary receptor in parkin-mediated mitophagy (108). Phb2 binds to LC3 (ATG8 in yeast) following proteasomal-dependent OMM rupture. As Phb2 binds to LC3, then phagophores form around the mitochondrion eventually leading to mitophagy.
1.9
Sphingolipids
Sphingolipids are lipids that regulate many different cellular processes. Sphingolipids include ganglioside, cerebroside, sphingomyelin, ceramide, and sphingosine. In terms of cellular structures, sphingolipids form lipid-rafts as parts of the cellular membranes (113). Sphingolipids are implicated in cell-cycle proliferation and regulation, ageing, endocytosis, stress responses, pro-survival and apoptotic pathway (114).
events is not completely clear. One hypothesis is that aberrant sphingolipid levels physically change the permeability of the OMM leading to MOMP (115). Other studies have suggested that aberrant sphingolipid levels cause morphological errors in the ER as well as disrupt Ca2+
homeostasis, which then leads to mitochondrial-mediated apoptosis (116). Sphingolipids’ pro-survival and pro-apoptotic functions depends on their relative cellular levels, yet the regulation of sphingolipid metabolism is not fully understood. For example, in yeast, overexpression of the ceramidase-encoding gene YDC1 leads to decreased chronological lifespan and increased apoptosis (113). Mitochondrial fragmentation and dysfunction is also symptomatic of YDC1 overexpression. Conversely, reduced lifespan can be rescued by exogenous addition of ceramide, suggesting low ceramide levels as the cause for increased cell death (113).
Recent data from PD patient samples shows abnormal sphingolipid and sphingolipid enzyme levels in neurons. More specifically, Murphy et al (117) found that glucocerebrosidase levels and its enzymatic activity are reduced in brain regions with aSyn accumulation in early stages of PD. The enzyme glucocerebrosidase, which cleaves the beta-glucoside linkage of glucocerebroside (or glucosylceramide) is encoded by the gene GBA1. Mutations in the GBA1 gene result in the most common genetic risk factor for PD. Moreover, decreased lysosomal glycocerebrosidase levels correlated with increased aSyn accumulation and decreased ceramide levels.
1.10
Rationale, Hypothesis and Significance
1.10.1
Rationale
Mitochondrial dysfunction is clearly a major hallmark of PD and a major phenotype in many PD models, and aSyn is known as a key disease protein in PD. However, model systems have not yet shown conclusive evidence that causally links aSyn-toxicity to mitochondrial dysfunction. Furthermore, previous yeast-aSyn models have not implicated genes related to mitochondrial dysfunction as key players in aSyn-toxicity. We argue that this shortcoming is due to the metabolic profile of the yeast models and other experimental models used for aSyn research. Most of these cell models produce the majority of their ATP through either glycolysis or fermentation, while neurons produce the majority of their ATP through oxidative phosphorylation. Thus, we postulate that if the metabolic profile of the PD models were more similar to that of the neurons affected by PD, i.e. high levels of oxidative phosphorylation, mitochondrial dysfunction would be unmasked as a key pathologically relevant route of aSyn toxicity. This will allow us to assess the link between aSyn toxicity and mitochondrial function and mitochondrial homeostasis, by fission, fusion, ER-mitochondria communications, mitophagy, prohibitin function, and ceramide levels.
1.10.2
Hypothesis
We hypothesize that aSyn induces cellular toxicity by disrupting mitochondrial homeostasis. In order to test our hypothesis, I have pursued three specific aims.
1) To establish an aSyn-yeast model with low aSyn expression and high levels of oxidative phosphorylation.
2) To determine how mitochondria are affected by aSyn expression under growth conditions that elicit high oxidative phosphorylation activity.
1.10.3
Significance
Chapter 2
2 Materials and Methods
2.1 Materials
2.1.1 Yeast strains and media
Yeast strain BY 4742 (MAT a his3Δ1 leu2Δ0 lys2Δ0 ura3Δ0) was used in this study. Yeast deletion strains were obtained from the Saccharomyces Genome Deletion Library, which was in turn purchased through ThermoFisher Scientific. The Genome Deletion Library is a collection of single yeast gene deletion strains which collectively, correspond to every non-essential gene deleted. Essential genes cannot be deleted as their deletion is nonviable.
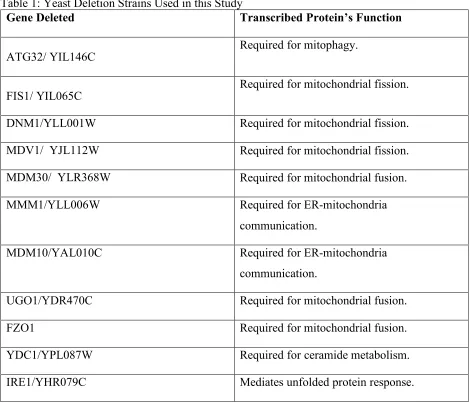
Table 1: Yeast Deletion Strains Used in this Study
Gene Deleted Transcribed Protein’s Function
ATG32/ YIL146C Required for mitophagy.
FIS1/ YIL065C Required for mitochondrial fission.
DNM1/YLL001W Required for mitochondrial fission.
MDV1/ YJL112W Required for mitochondrial fission.
MDM30/ YLR368W Required for mitochondrial fusion.
MMM1/YLL006W Required for ER-mitochondria
communication.
MDM10/YAL010C Required for ER-mitochondria
communication.
UGO1/YDR470C Required for mitochondrial fusion.
FZO1 Required for mitochondrial fusion.
YDC1/YPL087W Required for ceramide metabolism.
HAC1/YFL031W Mediates unfolded protein response.
SAC2/ YDR484W Component of golgi-associated retrograde
protein complex.
PEX2/ YJL210W Functions in peroxisomal matrix protein
import.
OPI3/ YJR073C Enzyme used in phosphatidylcholine
biosynthesis.
ARL3/YPL051W GTPase that regulates membrane traffic to
Golgi apparatus.
VPS28/ YPL065W Involved in protein sorting into endosomes.
COG6/ YNL041C Involved in fusion of transport vesicles to
Golgi membrane.
MIP1/ YOR330C Mitochondrial DNA polymerase.
PHB1/ YGR132C Forms prohibitin complex in
inner-mitochondrial membrane
PHB2/ YGR231C Forms prohibitin complex in
inner-mitochondrial membrane
SOD2/ YHR008C Localizes to mitochondria and protects
against oxidative stress.
All descriptions are modified versions of the descriptions available on the SGD website. A more detailed description is found in the introduction.
2.1.2 Yeast Media
L-histidine-monohydrate) depending on the selectivity maker of the plasmid. Yeast media was also made with the same formula above yet using different carbon sources. These alternate carbon sources are listed below:
Glycerol Media: 2% glycerol
Oleic Acid Media: 0.1 % oleic acid + 0.05% Tween 40
Myristic Acid Media: 0.1% oleic acid + 0.05% Tween 40.
Oleic and myristic acid media was made according to the formula described by Ralf Erdmann et al, 1989.
2.1.3 E. coli strains and media
Escherichia coli strain DH5a Genotype F–F80lacZΔM15 Δ(lacZYA-argF) 169 recA1 endA1 hsdR17 (rK–, mK+) phoA supE44 λ– thi-1 gyrA96 relA1 was used in this study. Subcloning Efficiency DH5a Competent Cells (Invitrogen, Cat. No. 18265-017) were used for the cloning work in this study. E. coli cultures were grown in Lysogeny Broth (LB) media (10 g/L NaCl, 10g/L tryptone, and 5 g/L yeast extract) with antibiotic resistance (100 µg/mL ampicillin or kanamycin, depending on selectivity markers) for transformations and cloning. 2x Yeast-tryptone (2xYT) media (16 g/L tryptone, 10 g/L yeast extract, and 5 g/L NaCl) was used for recovery of E. coli cells after transformation.
2.1.4 DNA Plasmids
Table 2: Plasmids created using Gateway Cloning in this study
Template Destination Vector
Alpha-Synuclein pAG413GPD-ccdB
Alpha-Synuclein pAG416GPD-ccdB-EGFP
Alpha-Synuclein pAG304Gal-ccdB-EGFP
2.1.5 Antibodies
The antibodies used in this study are shown in Table 3.
Table 3: Antibodies used in this study.
Antigen Supplier Use Concentration
GFP Sigma Western Blot 1:2500
Alpha-Synuclein Abcam Western Blot 1:2500
RFP Thermo Fisher Western Blot 1:2500
Histone Abcam Western Blot 1:2500
PGK-1 Antibodies-online Western Blot 1:2500
Rabbit (Alexa 680) Life Technologies Western Blot 1:2500
Mouse (Alexa 680) Life Technologies Western Blot 1:2500
2.2 Methods
2.2.1 High-Efficiency Yeast Transformation
Yeast transformations were performed according to standard PEG/lithium acetate method. A single colony of yeast cells are inoculated into 3 mL of YPD liquid or SD media and incubated at 30° C with shaking overnight. The liquid culture is then combined with 27 mL of YPD liquid to
make a 30 mL liquid culture and incubated at 30° C shaking till the cells have reached log phase
(an OD600 of 0.4 to 0.5). The culture is then centrifuged at 2000 x g for 5 minutes. The supernatant
is aspirated off and the pellet is washed with 3 mL of sterile water. The cells are centrifuged again at the same speed and time. The pellet is resuspended in 2 mL of 100 mM Li-Acetate in TE buffer after the wash step and incubated at 30° C shaking for 10 minutes. The culture is centrifuged again
Each transformation is composed of 100 µL cell suspension, 250 µl transformation (1 X TE, 40% PEG, and 100mM Li-Acetate), 12µl salmon sperm DNA, 1µl (0.3~0.5 µg) plasmid DNA, and 25µl DMSO and in the order listed and vortexed thoroughly. The cells were then allowed to recover at 30° C shaking for 30 minutes, following a 20-minute heat shock at 42° C shaking. After recovery,
the cells are centrifuged for 1 minute at 2000 xg, the supernatant aspirated, and the pellet resuspended in 100 µl TE buffer. The cells are then plated onto selective agar plates.
2.2.2 E. Coli Transformation
We perform E. coli transformations to replicate and amplify plasmid DNA, resulting in abundant amounts of DNA. 100 µl aliquots of transformation competent DH5α cells are thawed on ice from storage at -80° C; 1-5 µl (0.1~0.5 µg) of plasmid DNA is added to the cells and mixed thorough by
gently flicking the tubes (the competent cells should not be vortexed). The cells are allowed to recover on ice for about 30 mins and heat shocked at 42° C for 45 seconds. The cells rest on ice for
2 mins before 1 mL of 2xYT is added and the cells allowed to recover at 37° C in a shaking
incubator for at least 1 hour. Following recovery, the cells are centrifuged at 10,000 xg for one minute, the supernatant aspirated off, and resuspend in 100 µl of 2xYT. The suspension is plated on LB agar plates with selective antibiotic depending on the antibiotic resistance of the vector.
2.2.3 Gateway Cloning
The alpha-synuclein constructs were created through the standard procedures of Gateway cloning and consists of three steps, Polymerase Chain Reaction (PCR) amplification, BP recombination, and LR recombination following the Gateway cloning protocol developed by Invitrogen (117).
2.2.3.1 PCR
In brief, PCR was performed to obtain a template for the BP recombination reaction. We used an adapted version of the touchdown PCR program in order to avoid non-specific proliferation as a side-product of the reaction. The reaction cycle for PCR program protocol includes two cycles. The first cycle is repeated 10 times with an annealing temperature of 60° C; the second cycle is
of 2 µl of template DNA (~200 ng), 2µl of 100 mM forward primer, 2µl of 100 mM reverse primer, 2 µl of 100 mM dNTPs, 1µl of Q5 polymerase (New England BioLabs), and 20µl of 5x Q5 buffer (New England BioLabs). The forward and reverse primers are created using the Custom Primers - OligoPerfect™ Designer (Thermo Fisher).
Agarose Gel Electrophoresis of PCR Products
PCR products were then loaded into a 1% agarose gel and run in TAE buffer for approximately 30 min at 120 V. The PCR products were then cut out and purified using the Bioneer Pacific Acuprep Gel Purification Kit according to the provided protocol.
2.2.3.2 BP Reaction
The BP recombination reaction was performed by combining 2 µl of destination vector plasmid DNA (about 100- 200 ng of DNA) or PCR product, 1 µl of pDONR vector (150 ng/µl), and 2 µl of 5X BP Clonase (Invitrogen). The mixture is vortexed and centrifuged twice to ensure thorough mixing and then allowed to incubate overnight at 37° C. 1 µl of Proteinase K (Invitrogen) solution
is added to the reaction following incubation and left to react at 37° C for 10 minutes. 2 µl of this
reaction mixture is then used to transform into Subcloning Efficiency DH5α Competent Cells (Invitrogen, Cat. No. 18265-017) following the protocol provided by the manufacturer. The cells are plated in LB kanamycin (kan) resistant agar plates and incubated overnight at 37° C. Colonies
are picked from the plates and inoculated into LB kan liquid overnight at 37° C. The plasmids are
then extracted from the E. coli cells by using the High-Speed Plasmid Mini Kit (Qiagen); the resulting DNA is in pDONR vector backbone.
2.2.3.3 LR Reaction
The LR recombination reaction uses 1 µl of the product (100-300 ng) from the BP reaction, i.e. the pDONR vector, in combination with 2 µl of destination vector (150 ng/µl), 13 µl of TE buffer, and 4 µl of LR Clonase (Invitrogen). The destination vectors used are listed in section 2.1.4. The mixture is vortexed and centrifuged twice and allowed to incubate overnight at 37° C. The resulting
the mixture, incubated, and transformed into competent cells. The destination vectors are ampicillin (amp) resistant and therefore must be plated on LB amp agar plates and then inoculated in LB amp liquid media.
DNA Analysis
Once Gateway Cloning was completed, we would verify successful cloning with a diagnostic restriction digest at regions flanking the gene. If necessary, we would also send constructs to the Robarts Research Institute at the University of Western Ontario for DNA sequencing to verify its identity using pDONR and specifically designed sequencing primers.
2.2.4 Yeast Spotting Assays
Spotting assays are performed by first inoculating yeast cells in 3 mL in SD media and incubated overnight in a shaking incubator at 30° C shaking at 220 rpm. 100 µl of the cells are then taken in
an Eppendorf tube to be diluted 1:10 in water to measure the OD600, which indicates cell density.
In a 96-well plate, we dilute our cell cultures to a cell density normalized to OD600 =1 in the first
row of wells, followed by five serial dilutions of 1:5 in the subsequent 5 wells. We then use a 48-prong Frogger (V&P Scientific) to spot the samples on YPD, SD, and SGal, Raf, glycerol, oleic acid, and myristic acid plates lacking selective amino acid markers. The YPD plates are used as growth and spotting controls, whereas the SD, SGal, Raf, glycerol, oleic acid, and myristic acid plates reflect the toxicity (e.g. of aSyn) of the induced yeast cells. The incubation period varies with the type of plate; YPD plates are incubated 2 days; SD plates 2 days; glycerol, oleic acid, and myristic acid plates 3-5 days. The plates are all incubated at 30° C. The plates are documented
during the entire test period to monitor the growth of the yeast colonies by taking photographs using a digital camera. Images of the spotting assays grown on YPD plates are available in the supplementary figures.
2.2.4.1 Spotting Assay Quantification
selection that covered an area slightly smaller than the average single spot was used to gather measurements. For SD plates, the third dilution was used for quantification after 2 days of growth. The mean gray value was used to represent densitometry, where a value of 0 was indicative of the background, while a value of 255 was representative of complete growth. For SGal and Raf plates, the same protocol was used but quantifications were taken at day 3. For glycerol, oleic acid, and myristic acid plates, quantifications were taken on day 4, yet they included both dilution 3 and 4, as this results in consistent maximal densitometry values. Vector controls were then normalized to produce a value of 1, and the alpha-synuclein expressing strain then normalized accordingly.
2.2.5 Fluorescent microscopy
Microscopy imaging of GFP or RFP tagged constructs was performed by first inoculating yeast cells in SD media at 30° C overnight. The cells are then washed twice with sterile water, resuspended in SD media, and separately in other growth media of interest (i.e. glycerol or oleic acid) and incubated at 30° C. After incubating for time frames ranging from 6-24 hours, small samples of the culture are placed on a microscope slide. The cells are imaged on Olympus BX-51 Bright Field/Fluorescence Microscope and images were captured using an equipped CCD camera (Spot Pursuit). Exposure and magnification settings were kept consistent for each microscopy session unless specified otherwise.
2.2.6 Western Blot
2.2.6.1 Protein Extraction
2.2.6.2 Normalization of Protein Concentrations
We perform a BCA Protein Assay to determine the concentration of protein in the sample. The assay was performed according to the Thermo Scientific Pierce BCA Protein Assay Kit Instructions. After obtaining the concentration and normalizing the total protein amount in each sample per blot, we dilute the samples with 4x reducing SDS buffer (0.25M Trisma Base pH 6.8, 8.0% SDS, 40% sterile glycerol, 10% β-mercaptoethanol, 0.04% bromophenol blue).
2.2.6.3 SDS-PAGE
We run SDS-PAGE with the samples on an 8-16% gradient gel (Bio-Rad Criterion TGX Stain-Free Precast Gels) or 12% acrylamide gels at 220 V for about 50 mins. The gel is then transferred onto a Nitrocellulose or PVDF membranes (BioRad) using the Bio- Rad Trans-Blot Turbo machine following the manufacturer’s protocol.
2.2.6.4 Immunoblotting and Analysis
Following the gel transfer, we block the membrane using 5% skim milk powder (Carnation) in Phosphate Buffered Saline with 0.01 % (v/v) Tween (PBST) and incubate for 1 hr on a shaker. The membrane is then incubated in primary antibody overnight on a shaker at 4° C. Following
incubation with the primary antibody, we wash the membrane with 50 ml aliquots of PBST at 10 min intervals for an hour on a shaker and then incubate in the secondary antibody for 1 h on a shaker. The membrane is washed again with 50 ml aliquots of PBST in 10 min intervals on a shaker for an hour. The membrane is then documented using the ChemiDoc MP System (Bio-Rad) and analyzed using Image Lab (Bio-Rad) and Prism 6 (Graph Pad).
2.2.7 Sedimentation Assay
2.2.7.1 Protein Extraction
The sedimentation assay was adapted from Theodoraki et al. (2012) and Shiber et al. (2013). A 4 mL yeast culture is first inoculated in SD media overnight. The culture is then spun down at 2000 xg, washed twice, and resuspended in 5 mL SD or glycerol media overnight. We use OD600=1
once with water. The supernatant is discarded and the pellet is resuspended in 200 µl of lysis (100 mM Tris, pH 7.5, 200 mM NaCl, 1 mM EDTA, 1mM DTT, 5% glycerol, 0.5% TritonX-100, 50 mM NEM, 2mM PMSF, and 1X Sigma protease inhibitor tablet) and transferred into an Eppendorf tube. Acid-washed glass beads (425-600 µm, Sigma) are then added to physically lyse the cells by vortexing them 6 times for 30 secs intervals and cooling it on ice for 30 secs between the intervals. The tubes were pierced with a 16-gauge needle and the lysates (both pellet and supernatant) are collected in a fresh Eppendorf tube by centrifugation in pulses to separate lysates and glass beads.
Normalization of Protein Concentrations - See Section 2.2.6.2
Protein Extraction Continued
50 µl of the lysate was taken out and mixed with equal volume of SUMEB Buffer (8M Urea, 1% SDS, 10 mM MOPS, 10 mM EDTA, and 0.01% bromophenol blue) in a new tube, this aliquot represents total lysates. The rest of the lysate was spun down at 500 xg for 15 min at 4oC. 100 µl
of the supernatant was transferred into a new tube and mixed with 100 µl of SUMEB buffer, this represents the supernatant portion of the lysate. The remaining supernatant from the lysate was aspirated off. The pellet was resuspended with 100 µl of the lysis buffer (without protease inhibitors) and 100 µl of SUMEB buffer, this represents the pellet portion of the lysate. The samples were boiled at 80° C for 5 min and 25 µl of the samples were loaded onto a 12%
acrylamide gel. The gel is then run according to the SDS-PAGE and immunoblotting procedures described in sections 2.2.6.3 and 2.2.6.4
2.2.8 Semi-Denaturing Detergent Agarose Gel Electrophoresis (SDD-AGE)
2.2.8.1 Protein Extraction
We then use a 20G syringe to puncture the bottom of the tube and spin the culture at 5000 xg for 1 min and collect the lysate in a fresh tube below.
Normalization of Protein Concentrations - See Section 2.2.6.2
2.2.8.2 Agarose Gel Electrophoresis
We use 1.8% agarose gels with 0.1% SDS running at 80 V for about 2 hours in TAE buffer with 1% SDS. The gel is then transferred onto a Nitrocellulose or PVDF membranes (BioRad) according to the Whatman: Turboblotter Rapid Downward Transfer Systems protocol overnight.
Immunoblotting and Analysis - Following transfer, we follow the same protocols for immunoblotting and analysis as described in section2.2.6.4.
2.2.9 Reactive Oxygen Species Assay
The reactive oxygen species (ROS) assay was carried out following the protocol described by Joel James et al, 2015. A 4 mL yeast culture is first inoculated in SD media overnight. The culture is then spun down at 2000 xg, washed twice, and resuspended in 5 mL of SD or glycerol media,
treated or untreated with 100 µM H2O2 overnight. The OD of the cells is then measured (as described in section 2.2.4) and the samples are accordingly normalized to have equal amounts of cells. H2DCF-DA was then added to the cultures at a concentration of 10 µM and the cells were incubated in the dark for 30 min. Cells were then pelleted and resuspended in 2M Lithium acetate for 2 minutes with light agitation. Cells were again pelleted and resuspended in 0.1% SDS with a drop of chloroform and shaken vigorously for 2 minutes. Cells were then pelleted, and the supernatant was loaded into a 96 well plate and the fluorescence was measured using the Cytation 5 Cell Imaging Multi-Mode Reader fluorescence protocol.
2.2.10 Creation of Petite Yeast Strains
The creation of rho0 yeast, or petite yeast strains was achieved by following the protocol described
saturation and inoculated in fresh ethidium bromide-containing media as described above and grown overnight. We then performed spotting assays on selective media (as described in section 2.2.4) to allow for isolation of single colonies. Single colonies were then restreaked on a new plate of selective media and replicative plating was used to confirm the yeast were petite and respiratory deficient.
2.2.11 Replica Plating
Replica plating was achieved by first streaking out the yeast strains of interest onto a new plate of selective media. This plate was then incubated at 30° C for two days. We then transferred the yeast
onto a sterile velvet cloth draped over a sterile transfer block. Next, we pressed our new plates of interest onto the velvet cloth to allow for transfer of the yeast. These plates were then incubated at 30° C for 2-4 days, depending on the carbon source used.
2.2.12 Statistical Analysis
Chapter 3
3 Results
3.1 Expansion of the Alpha-Synuclein (aSyn) Yeast Model – Aggregation and
Toxicity in Respiring Cells
The previously established alpha-synuclein (aSyn) yeast model focused on growth in fermentable carbon sources, such as glucose and galactose. In yeast, these sugars are mostly metabolized through glycolysis and cells are rapidly dividing until they reach stationary phase. In contrast, neurons, including those affected in Parkinson’s disease (PD), mostly metabolize sugar trough oxidative phosphorylation and mature neurons usually do not divide. To mimic this metabolic activity and lack of cell division in yeast, we determined aSyn toxicity and aggregation in non-fermentable carbon sources, such as glycerol and potassium acetate.
When grown on the fermentable carbon source glucose, spotting assays reveal only a mild toxicity in yeast cells expressing moderate levels of aSyn, with the aSyn-expressing yeast cells showing 12% reduced growth compared to the vector control (Figure 10A, B). However, when the carbon source is switched to glycerol, toxicity increases and the aSyn-expressing shows 40% reduced growth compared to the vector control (Figure 10A, B).
Western blots probing for aSyn reveal no significant change in aSyn expression when cells are grown with either glucose or glycerol as a carbon source (Figure 10C). This shows that the increase in aSyn toxicity is not merely due to increased expression or stability of aSyn in glycerol, as changing the carbon source did not change aSyn protein levels.
We then performed a sedimentation assay to test whether aSyn aggregation is increased in cells grown in glycerol. The sedimentation assay was performed in parallel with cells grown in glucose or glycerol as a carbon source. We find that growth in glycerol results in a 46% increase of insoluble aSyn compared to growth in glucose (Figure 10C).
In order to visualize aSyn conformational changes, we analyzed aSyn carboxy-terminally fused to the green fluorescent protein (aSyn-GFP) in wild-type (WT) yeast cells using fluorescent microscopy with cells grown with either glucose or glycerol as a carbon source. Cells grown in glucose did not contain any aSyn aggregation at moderate expression levels, yet approximately 20% of cells grown in glycerol did contain aggregates (Figure 11A), which confirms the sedimentation analysis of aSyn aggregation.
We next explored how aSyn affects mitochondrial morphology during both growth in glucose and glycerol. We therefore transformed the reporter protein mtGFP (mitochondria targeted GFP) into WT aSyn expressing an empty vector control yeast cells. Microscopy revealed no noticeable difference in mitochondrial morphology between the vector and aSyn-expressing strain when grown in glucose. However, the mtGFP signal is much less intense in the aSyn-expressing strain grown in glycerol compared to the vector control grown in glycerol (Figure 11B). Western blots probing for mtGFP confirmed the microscopy results as mtGFP levels are reduced by 36% in the aSyn-expressing strain grown in glycerol compared to the vector control (Figure 11C).
3.2 aSyn toxicity and aggregation depend on metabolic activity
While most of our work below was completed using either glucose or glycerol as a carbon source, we also characterized aSyn aggregation and toxicity under conditions with diverse metabolic profiles. To this end, we performed both spotting assays and microscopy using seven different carbon sources: glucose, raffinose and galactose are fermentable carbon sources, whereas potassium acetate, oleic acid and myristic acid are non-fermentable. Potassium acetate is metabolized primarily through oxidative phosphorylation, yet oleic acid and myristic acid undergo beta-oxidation prior to oxidative phosphorylation.
Figure 12: aSyn toxicity in yeast cells grown in different carbon sources: A Different carbon sources and the predominant type of metabolism used by WT yeast cells to generate ATP. B
3.3 Previously established enhancers of aSyn toxicity do not alter toxicity in our
model
3.4 Petite-cells show no difference in aSyn toxicity and aggregation
Figure 15: Spotting assays of WT and petite yeast cells expressing aSyn-GFP. A Spotting assays of WT, △ mip1 and rhoo yeast cells expressing a vector control or aSyn, grown in glucose.
3.5 Oxidative stress does not exacerbate aSyn toxicity and aggregation
Oxidative stress is a hallmark of PD, yet whether it is a result or cause of PD remains unknown (63). Here, we tested the connection between oxidative stress and aSyn toxicity by expressing aSyn in yeast cells deleted for SOD2 and by exposing WT yeast cells expressing aSyn to H2O2 treatment.
SOD2 encodes the gene for mitochondrial superoxide dismutase, which acts as an antioxidant that converts superoxide, a byproduct of oxidative phosphorylation, to H2O2 and diatomic oxygen.
Yeast cells lacking Sod2 activity are unable to grow on non-fermentable carbon sources (124). H2O2 treatment is a well-established method of exposing yeast cells to oxidative stress (125).
Spotting assays revealed no change in aSyn toxicity in WT yeast treated with 100µM H2O2, and
in the Dsod2 strain (Figure 16A, B) grown in glucose. Furthermore, aSyn aggregation was
unchanged after 6 hours of 100µM H2O2 treatment and in the Dsod2 strain grown in glucose
(Figure 16C). These results indicate that oxidative stress alone that not increase aSyn toxicity and aggregation. Also, when we combine H2O2 treatmentwith growth on glycerol plates, we detect no