Copyright © 1998, American Society for Microbiology
Immune Function in Healthy Adolescents
JACQUELINE A. BARTLETT,1* STEVEN J. SCHLEIFER,1MELISSA K. DEMETRIKOPOULOS,1,2
BEVERLY R. DELANEY,1SAMUEL C. SHIFLETT,1ANDSTEVEN E. KELLER1,2
Department of Psychiatry, UMDNJ-New Jersey Medical School,1and Department of Neuroscience,
UMDNJ-Graduate School of Biomedical Science, Newark,2New Jersey
Received 12 March 1997/Returned for modification 20 May 1997/Accepted 23 September 1997
In the present study, we examine immunological functioning in normal healthy African-American and Latino/Latina adolescents recruited from an inner-city high school and an inner-city clinic. A battery of tests was performed with enumerative and functional measures which encompassed both innate and adaptive immunity. We found immune differences related to age, gender, and race on both the enumerative and the functional immune measures. This data expands the available body of information concerning normal immu-nity in healthy adolescents.
The immune system has most often been studied in relation to disease, and much of the normative data has been compiled by considering various control groups in different studies. Fur-ther, while there is considerable data on immune parameters in Caucasian adults, there is much less data available for other age groups, such as adolescents, and for other ethnic groups. Some researchers have reported normative immune data when studying disease processes in adolescent populations (3, 11, 31, 35). However, since the focus of these studies was not normal subjects, the description of the normal controls as well as the small number of subjects limit the usefulness of this work for providing normative data. More recent studies have begun to provide some selective normative immunological data with normal, healthy adolescent subjects. For example, in one study enumerative (cell phenotype) data from 112 predomi-nantly Caucasian (74%) healthy adolescents (ages 12 to 19) (40) was examined, while in another study the functioning of polymorphonuclear leukocytes in 58 children (aged 6 months to 15 years) (15) was examined. Although these studies are limited by the fact that they were focused on a single immu-nological variable, they are a useful beginning in understanding normal adolescent immune status.
The present study was part of a longitudinal study of behav-ior, mood, and immunity in inner-city minority adolescents. We evaluated 206 healthy African-American and Hispanic ad-olescents, utilizing fresh blood cells and a battery of immune assessments which provides data on enumerative and func-tional immunological measures. The measures included total leukocyte count, counts of both granulocytes and lymphocytes, and counts of subsets of the lymphocyte populations, including those shown to have implications in certain disease states such as human immunodeficiency virus illness. The functional mea-sures that were chosen involve in vitro assays only. Therefore, no exposure to antigen or other invasive procedure was nec-essary. This was thought to decrease subject risk and increase participation of subjects.
This data is characterized in terms of the relationships to age, gender, and race within this selected population of healthy inner-city youth. Normative data from this type of under-stud-ied population has become increasingly important with regard
to immune-related diseases. Since the advent of diseases such as AIDS, the need for knowledge of immunity in adolescents as well as the need for following the progression of this or other disease states in this population has increased.
MATERIALS AND METHODS
Subjects. This study was approved by the Institutional Review Board of UMDNJ-New Jersey Medical School. Informed consent from subjects 18 years of age and informed assent from subjects under 18 years of age with informed consent from a parent or guardian were obtained. A total of 331 adolescents ranging from 12 to 18 years of age participated in the present study. All subjects were recruited as part of a project assessing behavior, immunity, and health. Two hundred thirteen subjects were randomly recruited from a local public high school. One hundred eleven consecutive adolescents who were attending an adolescent medicine clinic for a routine physical examination or follow-up for a minor medical condition were also recruited. Seven subjects were peer referrals. All psychosocial (e.g., age and race) and substance use (e.g., alcohol and to-bacco) data were obtained in an interview format.
A medical history, review of systems, and vital signs were obtained. Potential subjects were excluded if they had chronic diseases likely to have substantial effects on immunity (e.g., neoplastic, endocrine, or immune disorders) or if they were taking medications with known immunologic effects. Subjects with acute infections were deferred from study until their symptoms were resolved. Subjects presenting with other medical conditions, such as recently resolved minor infec-tions, or with other past disorders with possible immune effects (e.g., asthma) were studied but not included in these analyses. The occasional adolescent with clinically apparent mental retardation, significant neurologic deficits, schizophre-nia, or substance abuse or dependence disorders was excluded.
Medical group evaluation.Each subject was screened by a trained research assistant with the Health Symptoms Checklist (18). Vital signs were collected at the time of venipuncture. All medically relevant data was reviewed by the phy-sicians (J.A.B., S.J.S., and B.R.D.) who made the final consensual determination of the subjects’ medical status. Subjects were classified into one of the following three medical groups: (i) healthy (subject had no medical problems and was not taking any medication); (ii) minor medical problem (subject had mild medical symptoms such as a cough or runny nose, had had fever within the past week [venipuncture was deferred in subjects with current fever], or had taken medi-cation for a cold within the past 2 weeks); or (iii) medical problem (subject was found to have more significant chronic or current medical problems considered likely to be associated with altered immunity). This last group consisted mainly of asthmatics who, in the past year, had had an asthmatic attack or utilized antiasthmatic medication and of adolescents with a history of a recent infection requiring antibiotic therapy. Of the total 331 adolescents studied, 206 were classified in the healthy group prior to the analysis of any data. Only the subjects in the healthy group were included in the analyses to be described.
Immunological evaluation.All assays were carried out blind to the subjects’ medical status. Blood samples were collected in a heparinized syringe (preser-vative-free heparin). All the results herein were obtained from the same veni-puncture for each subject. Total leukocyte and differential counts were per-formed by standard techniques. Phenotypic analysis of lymphocytes, monocytes, and granulocytes was performed with heparinized whole blood. Mononuclear cells were separated from whole blood by centrifugation on a Ficoll-Hypaque gradient. These cells were used to assess mitogen-induced lymphocyte stimula-tion and natural killer (NK) cell funcstimula-tion. Addistimula-tionally, granulocytic funcstimula-tion was
* Corresponding author. Mailing address: Department of Psychia-try, Administration Complex, Bldg. 14, UMDNJ, New Jersey Medical School, 30 Bergen St., Newark, NJ 07107-3000. Phone: (201) 972-6385. Fax: (973) 972-8305. E-mail: [email protected].
105
on August 17, 2020 by guest
http://cvi.asm.org/
determined from granulocytes which were isolated from the remaining erythro-cytes by a percoll gradient.
Cell phenotypes.Cell phenotypes were assessed by flow cytometry with the Epics 1 Profile Plus (Coulter Immunology, Hialeah, Fla.). All monoclonal anti-bodies were directly conjugated and obtained from Coulter Immunology. The antibodies were all used in concentrations of 10ml per 0.10 ml of whole blood. Q-prep technology was then utilized to process the samples for cytometry. Briefly, 50ml of heparinized whole blood was added to 200ml of the appropriate antiserum or antiserum combination. Samples were incubated on ice for 45 min, and then the erythrocytes were lysed and the preparation was suspended in paraformaldehyde and sheath fluid. The monoclonal antibodies utilized for the following cells are indicated in parentheses: lymphocytes (CD45) (KC56-fluo-rescein isothiocyanate), monocytes (CD14) (MO2-RDI), and granulocytes (CD11b) (forward and side scatter, no antibodies), T cells (CD3), B cells (CD19), NK cells (CD56), T helper cells (CD4), T-cell suppressor/cytotoxic T cells (CD8), T-cell suppressor inducer (CD4 plus CD45RA), T helper cell in-ducer (CD4 plus CD29), and activated T cells (CD3 plus HLA-DR, DP, and DQ).
Appropriate filter combinations were used to simultaneously measure emis-sions from fluorescein isothiocyanate and phosphatidylethanolamine. Gates were selected with forward and 90°-angle light scatter to select the cell population of interest. A minimum of 1,000 cells were included in each analysis. The color compensation was performed by examining the percentage of Fl1 (green) seen in the Fl2 (red) and, conversely, the percentage of Fl2 seen in the Fl1 channel. For this determination, CD4FITCI and CD8RD were utilized as staining control lymphocytes. Routinely, F11 had 0 to 3% of F12, while F12 had 3 to 5% of F11. Both the percentage and the absolute number of each cell type were determined.
Mitogen-induced lymphocyte stimulation.Mitogen-induced lymphocyte stim-ulation was performed according to the techniques modified by Keller et al. (19) with dose-response curves for concanavalin A (ConA; Calbiochem, San Diego, Calif.), phytohemagglutinin (PHA; Welcome Reagents, Ltd., Beckenham, En-gland), and pokeweed mitogen (PWM; GIBCO BRL Products). The doses per well were as follows: for ConA, 3.75, 7.5, and 15mg/well; for PHA, 0.05, 0.25, and 2.0mg/well; and for PWM, 0.25, 0.5, and 5.0mg/well. All lymphocyte stimulation data were expressed as counts per minute in the stimulated cultures minus the counts per minute in the unstimulated cultures. To approximate homogeneity of variance, all counts were log transformed. The mean of the two higher doses was utilized as a single dependent variable for regression analyses. (The lowest dose was used to establish a basal response for the dose-response curve.)
NK cell activity.NK cell activity was assessed with K562 target tumor cells according to standard methods modified by Georgescu and Keller (12, 13). Target K562 cells were maintained by passaging every 2 to 3 days. Cell viability was always.98%. On the day of assay, target cells are collected, washed, and labeled with 500mCi of51Cr for 2 h at 37°C. Target cells are then washed three times, and 104cells are plated in microtiter plate wells. The NK cells are isolated from the whole blood as described above and prepared in 3 dilutions in RPMI with 15% normal human serum. The final concentrations of NK cells are 253
104, 503104, and 1003104. This provides three effector-to-target ratios (25:1, 50:1, and 100:1). The mixture of target cells and NK cells is then incubated for 4 h at 37°C. The microtiter plates are then centrifuged, and the supernatant from each well is assessed for51Cr activity. The NK data is presented as percentage of specific cytotoxicity (see Data Analyses).
Granulocyte activity.Granulocyte activity was assessed by examining both the phagocytic and killing ability of granulocytes according to the method described by Weir (41), with the following modifications. After separation of the lympho-cytes from the peripheral blood by a Ficoll-Hypaque gradient, the granulolympho-cytes were separated from the erythrocytes by a percoll gradient. The granulocytes were incubated with opsonized Staphylococcus aureus for 20 min. The incubation mixture was centrifuged, and the unphagocytized S. aureus was washed out with cold RPMI medium. Granulocytes were resuspended in RPMI, and aliquots were prepared for further processing. One aliquot was processed immediately to assess the phagocytic ability of the granulocytes. Two aliquots were incubated at 37°C to assess killing ability, and two aliquots were incubated on ice as controls. At time 0, 1-h, and 2-h postincubation with S. aureus, the granulocytes were lysed with 0.5% bovine serum albumin in distilled water and plated on blood agar plates. The plates were incubated at 37°C for 24 h. The number of colonies was counted; each represents an ingested S. aureus bacterium. Differences between the numbers of colonies at 37 and 0°C represent specific killing of bacteria.
Data analyses.Data were first examined descriptively for distribution, means, and variance. Multivariate models, defined a priori, were tested by regression analyses. For each analysis of the enumerative measures, we examined the contribution of age, gender, or race, controlling for the other two variables and for the total leukocyte count (WBC) (simultaneous, not hierarchical), with num-ber of leukocytes covaried. For the mitogen response, NK cell activity, and granulocyte activity, WBC was not included in the model. All tests were two-tailed.
The mean of the highest two responses to each of the mitogens and the mean of the two highest effector-to-target killing ratios for NK cell activity were utilized to form dependent variables for these regression analyses. Also, while we examined the NK cell activity results both as specific killing and as the number of lytic units, we have presented the data as percentage of killing for several reasons. First, the use of specific killing was closer to the raw data and less
manipulated and allows direct inspection of the levels of specific cytotoxicity. Secondly, not all of our data fits the assumptions required for lytic unit trans-formation and requires either the dropping of particular data points, the drop-ping of particular cases, or the truncation of the data. None of the options seems preferable to the presentation of the data as percentage of killing.
The granulocyte activity assay was initiated in the latter part of the study. However, sufficient numbers of adolescents were studied to permit analysis of this data (n596).
RESULTS
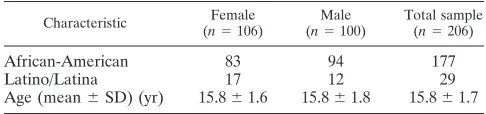
Demographics.As shown in Table 1, there were 100 males
and 106 females in this sample of healthy subjects (n5206). The sample was comprised of 177 (83 female) African-Amer-icans and 29 (17 female) Latinos/Latinas. The mean age 6 standard deviation for the entire sample was 15.861.7 years. The mean age of the males was 15.7561.81, and that of the females was 15.8361.59. The age distribution is presented as a function of gender in Fig. 1. The age, gender, and race distributions provided sufficient power to allow us to meaning-fully assess their contributions to the variance of the immune measures.
Immune measures.The findings for the entire sample are
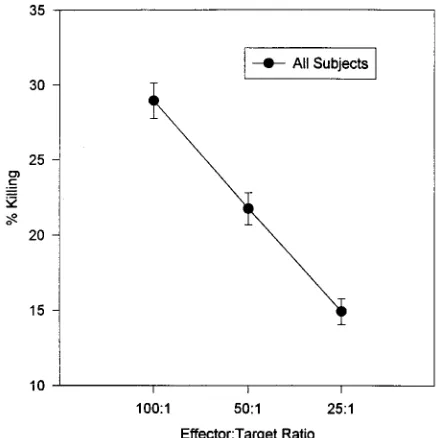
presented in Table 2 and Fig. 2 through 4. The enumerative measures are presented in Table 2 both as absolute number of cells present and as a percentage of the total WBC. The dose-response curves for each of the three mitogens are shown in Fig. 2. In Fig. 3, the dose-response curve of NK cell activity at the three effector-to-target ratios utilized is shown. In Fig. 4, the killing of S. aureus (at 37°C and on ice) by granulocytes is presented.
FIG. 1. Age distribution as a function of gender (n5206).
TABLE 1. Demographic data for subjects in this study
Characteristic (nFemale5106) (nMale5100) Total sample(n5206)
African-American 83 94 177
Latino/Latina 17 12 29
Age (mean6SD) (yr) 15.861.6 15.861.8 15.861.7
on August 17, 2020 by guest
http://cvi.asm.org/
Effects of age, gender, and race.We examined the contribu-tions of age, gender, and race on the various immune param-eters.
Age effects. (i) Cell phenotypes.WBC was positively
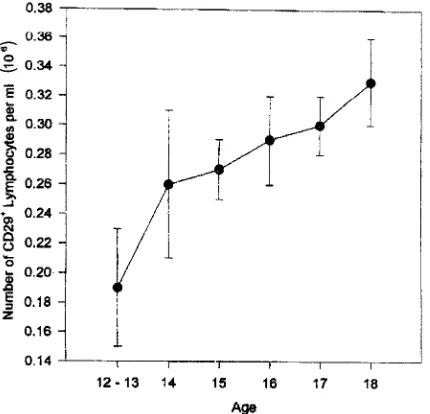
corre-lated with age (partial r50.25, P,0.001) (Fig. 5). Age also contributed to the percentage of CD291cells (F53.25, P,
0.002) (Fig. 6), with older subjects having a higher percentage; to the number (F52.31, P,0.03) and percentage (F52.14,
P , 0.04) of B cells, with younger subjects having higher values; and to the percentage of NK cells (F52.34, P,0.03), with older subjects having higher percentages.
(ii) Mitogen-induced lymphocyte stimulation.For the
pro-liferation assays, there were no significant effects of age on the mean lymphocyte responses to the mitogens ConA (F50.56,
P.0.10), PWM (F51.17, P.0.10), or PHA (F51.60, P. 0.10).
(iii) NK cell activity.There were no relationships between
age and mean NK cell cytotoxicity (F50.62, P.0.10). When the number of NK cells was also controlled, this relationship did not change substantively.
(iv) Granulocyte activity. This assay was initiated in the
latter part of the study. However, sufficient numbers of ado-lescents were studied to permit the analysis of this data (n5 96). As seen in Fig. 7, there was a significant decrease in the phagocytosis of S. aureus with increasing age (F53.33, P, 0.01). In addition, after peaking when the subjects were age 14,
FIG. 2. Dose-response curves of the lymphocytes to each of the three mito-gens (ConA, PHA, and PWM). Data has been log transformed and is presented as the mean6the standard error of the mean (n5206).
FIG. 3. Dose-response curves of the NK cell killing at the three effector-to-target ratios. Data is presented as the mean6the standard error of the mean (n5206).
FIG. 4. Killing of S. aureus by polymorphonuclear granulocytes. Data is pre-sented as the mean6the standard error of the mean (n5206).
TABLE 2. Totals for peripheral leukocyte measures for entire sample
Variable No. of cells (10(mean6SD)6)/ml % Leukocytes(mean6SD)
Leukocytes 7.1162.82
Lymphocytes 1.5760.54 37.2569.71
Granulocytes 2.6361.18 55.39610.35
Monocytes 0.2960.12 6.6862.38
T lymphocytes 1.2260.46 76.5568.48
B lymphocytes 0.2360.13 15.2965.94
CD41lymphocytes 0.6960.27 42.9867.38
CD81lymphocytes 0.3360.16 20.9565.46
Helper-to-suppressor ratio 2.3160.07
CD291lymphocytes (inducers
of help) 0.2960.15 17.4466.63
CD45RA1lymphocytes
(inducers of suppression) 0.3460.17 21.1266.67 CD561lymphocytes (NK cells) 0.0760.08 4.1964.32
HLA-DR1lymphocytes
(activated T cells) 0.1060.06 5.8763.79
on August 17, 2020 by guest
http://cvi.asm.org/
the percentage of bacteria killed at 1 h (F52.13, P,0.04) and 2 h (F52.95, P,0.005) declined with age (Fig. 8).
Gender effects. (i) Cell phenotypes.As shown in Table 3, no
difference in total WBC or in numbers of lymphocytes, gran-ulocytes, monocytes, or NK cells was found between males and females. There was a significantly lower percentage (but not number) of T cells in males than in females (F55.85, P , 0.0001). The number of B cells (F 53.43, P ,0.0009) was higher in males, as was the percentage (F52.14, P,0.04). There were significantly lower numbers of CD41cells in the
male adolescents than in the female adolescents (F52.24, P, 0.03). Similarly, there was a lower percentage of CD41cells
among males than among females (F 5 5.85, P , 0.0001).
Additionally, the percentage but not the number of CD291
cells (inducers of help) was lower among males than among females (F52.54, P,0.02). Further, the helper-to-suppres-sor ratio was higher in females than in males (F52.44, P, 0.02). No other differences in numbers or percentages of cells were found.
(ii) Mitogen-induced lymphocyte stimulation.For the
pro-liferation assays, there were no significant effects of gender on the mean lymphocyte responses to ConA (F50.40, P.0.10), PWM (F51.50, P.0.10), or PHA (F51.27, P.0.10). FIG. 5. WBC (mean6standard error) as a function of age; partial r, 0.25; P,
,0.001.
FIG. 6. Percentage of CD291(inducer of help) as a function of age (mean6
standard error); partial r, 0.31, P, 0.001.
FIG. 7. Number of S. aureus cells phagocytized as a function of age (P,
0.04). Data is presented as the mean6standard error of the mean (n5206). The 12- and 13-year-old subjects were combined due to the small number of subjects in these two groups.
FIG. 8. The percentage of S. aureus cells killed as a function of age (P,
0.01). The data is presented as the mean6standard error of the mean (n5206). The 12- and 13-year-old subjects were combined due to the small number of subjects in these two groups.
on August 17, 2020 by guest
http://cvi.asm.org/
(iii) NK cell activity.There was no significant relationship between gender and mean NK cell cytotoxicity (F51.08, P. 0.10). When number of NK cells was controlled, these results were not altered (F50.82, P.0.10).
(iv) Granulocyte activity.There were no gender-based
dif-ferences in granulocyte phagocytosis (F50.74, P.0.10) or killing activity at 1 (F50.15, P.0.10) or at 2 h (F50.78, P. 0.10) of incubation.
Race effects. (i) Cell phenotypes.The associations between
race and cell numbers are presented in Table 4. WBC differed with race, being lower for African-Americans than for Latinos/ Latinas (F53.85, P,0.0002). African-Americans had a lower number of granulocytes than Latinos/Latinas (F52.02, P, 0.05) and tended to have a lower percentage of granulocytes (F 5 1.72, P 5 0.09). African-Americans also had a lower percentage (F52.10, P,0.04) but not a lower number (F5 1.48, P.0.10) of HLA-DR1lymphocytes (activated T cells)
than did Hispanics.
(ii) Mitogen-induced lymphocyte stimulation.For the
pro-liferation assays, there were no significant effects of race on the mean lymphocyte responses to ConA (F 5 0.22, P. 0.10), PHA (F 5 1.51, P. 0.10), or PWM (F5 1.27, P. 0.10). However, for PWM, African-American adolescents differed from Latino/Latina youth in their dose-response curve (F 5
9.39, df52 and 320, P,0.0001) (Fig. 9). While the African-Americans seemed to show higher proliferative response at the lowest dose, the Latino/Latina adolescents showed higher pro-liferation at the two higher doses.
(iii) NK cell activity.There were no relationships between
race and NK cell cytotoxicity (F 5 0.51, P . 0.10). With number of NK cells also in the model, the relationship re-mained nonsignificant.
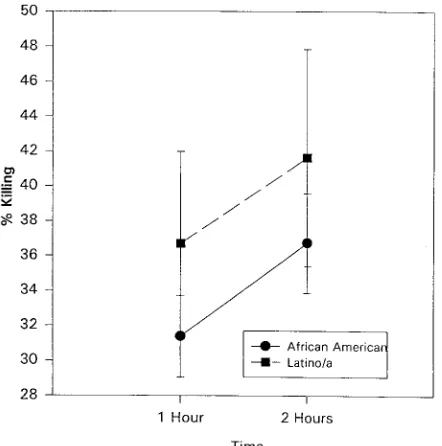
(iv) Granulocyte activity. As seen in Fig. 10, race affected
granulocytic activity. Hispanic adolescents showed a higher percentage of killing than did African-American adolescents at 1 h (F 5 2.32, P , 0.03) and at 2 h (F 5 1.87, P , 0.07) incubation.
Substance use effects. As adolescence is a time of
psycho-social as well as physical change, with frequent experimenta-tion, including substance use, which can affect immunity, we did preliminary analyses to assess possible effects of alcohol and drug use on the immune parameters herein. Behavioral data consisted of a self-report of alcohol and drug use during the day and week preceding venipuncture and a self-report of the average number of cigarette packs the subject smoked during the past year. As substance abuse was an exclusion criterion, and as these students were either in school or actively seeking health care, the incidence of substance use was quite
TABLE 3. Peripheral blood leukocyte measures by sex
Variable
No. of cells (106)/ml (mean6SD) Mean % leukocytes6SD Male
subjects subjectsFemale F P Male subjects subjectsFemale F P
Leukocytes 6.9262.86 7.2862.80 1.44 .0.10
Lymphocytes 1.5560.52 1.5860.53 0.83 .0.10 38.45610.11 36.2069.45 1.66 .0.10 Granulocytes 4.2561.91 4.5462.01 1.45 .0.10 54.05610.56 56.35610.30 1.78 0.08 Monocytes 0.5160.23 0.4960.21 1.20 .0.10 6.8762.07 6.7162.72 1.00 .0.10 T lymphocytes 1.1760.44 1.2760.45 0.77 .0.10 73.6869.01 79.5066.74 5.08 0.0001 B lymphocytes 0.2660.14 0.2160.11 3.43 0.0009 16.8366.54 13.7165.01 2.14 0.04 CD41lymphocytes 0.6360.25 0.7460.27 2.24 0.03 40.1667.09 45.6466.71 5.85 0.0001
CD81lymphocytes 0.3360.16 0.3260.14 0.75 .0.10 20.7865.31 20.8865.53 0.23 .0.10
Helper-to-suppressor ratio 2.1260.84 2.4760.93 2.44 0.02
CD291lymphocytes (inducers of help) 0.2760.15 0.3060.14 1.17 .0.10 16.2666.76 18.8666.13 2.54 0.02
CD45RA1lymphocytes (inducers of
suppression) 0.3360.17 0.3560.17 0.60 .0.10 20.3066.65 21.8866.63 1.34 .0.10 CD561lymphocytes (NK cells) 0.0860.10 0.0660.06 1.56 .0.10 4.8165.12 3.7363.56 1.72 0.09
HLA-DR1lymphocytes (activated T cells) 0.1160.07 0.0960.06 1.79 0.08 6.4764.48 5.5063.29 1.48 .0.10
TABLE 4. Peripheral leukocyte measures by race
Variable
No. of cells (106)/ml (mean6SD) Mean % leukocytes6SD
African-American subjects
Latino/Latina
subjects F P
African-American
subjects
Latino/Latina
subjects F P
Leukocytes 6.7562.71 9.0762.69 3.85 0.0002
Lymphocytes 1.5460.54 1.7060.46 1.71 0.09 38.2369.80 32.2268.28 1.61 .0.10 Granulocytes 4.1261.84 5.7862.01 2.02 0.05 54.14610.43 61.0768.63 1.72 0.09 Monocytes 0.4860.19 0.5860.32 0.23 .0.10 6.9062.44 6.1862.39 0.48 .0.10 T lymphocytes 1.2060.45 1.3460.39 1.20 .0.10 76.4668.46 78.0368.16 1.10 .0.10 B lymphocytes 0.2360.12 0.2360.13 2.33 0.03 15.3965.82 14.1866.89 1.52 .0.10 CD41lymphocytes 0.6760.26 0.7560.29 1.01 .0.10 43.0267.25 43.0968.31 0.35 .0.10
CD81lymphocytes 0.3260.16 0.3560.11 1.21 .0.10 20.8465.43 20.8065.43 0.57 .0.10
Helper-to-suppressor ratio 2.3160.84 2.3261.18 0.44 .0.10
CD291lymphocytes (inducers of help) 0.2760.14 0.3560.16 0.19 .0.10 17.1766.63 19.8665.75 1.38 .0.10
CD45RA1lymphocytes (inducers of suppression) 0.3360.15 0.3960.21 0.07 .0.10 20.9066.33 22.2968.23 0.90 .0.10
CD561lymphocytes (NK cells) 0.0660.06 0.1160.14 1.79 0.08 4.0664.41 5.3064.27 0.70 .0.10
HLA-DR1lymphocytes (activated T cells) 0.0960.06 0.1360.06 1.48 .0.10 5.6263.95 7.8263.23 2.10 0.04
on August 17, 2020 by guest
http://cvi.asm.org/
low in our sample. No subject had used alcohol or drugs in the 24-h period prior to venipuncture. In the preceding week, 8% of the subjects had used alcohol, varying from one to two glasses of wine or hard liquor to 1 to 40 beers (one subject had had 40 beers more than 24 h previously, while the next highest number of beers that had been drunk that week was 4). The only drug the subjects reported using was marijuana, with only one subject reporting this in the week prior to venipuncture. No other substance use (except that of cigarettes) was reported for the week.
The only immune measure affected by any of the reported substance use was the killing of S. aureus, which was inversely
associated with alcohol use during the week prior to the veni-puncture (data not shown).
DISCUSSION
This study of immunity represents the largest reported sam-ple of normal healthy adolescents to date. This data demon-strates differences in total WBC related to age and race; dif-ferences in lymphocyte subtype counts related to gender, race, and age; differences in PWM response related to race; differ-ences in granulocyte phagocytic ability related to age; and differences in granulocyte bactericidal activity related to both age and race. These findings contribute to the literature con-cerning normative data on adolescent immunology. Further, these findings provide information on enumerative and func-tional measures of both lymphoid and myeloid cells as they relate to age, gender, and race. We found almost no effects of alcohol or tobacco (when reported use was minimal) on im-munity in these healthy adolescents. This data provides impor-tant descriptive information on adolescent minority popula-tions who are represented only minimally in the normative data available to date. This data will be a useful measure of comparison when minority adolescents with immune-related problems or disease are to be assessed.
This data expands upon the work of Tollerud and coworkers (40), who assessed lymphocyte subset numbers in 112 healthy, predominantly Caucasian adolescents (mean age, 15.46 1.9; range, 12 to 19 years). Our mean age and age range were almost identical to those of Tollerud et al. (15.861.7 and 12 to 18 years). The populations investigated were different as far as racial mix. With respect to the immunologic measures in-vestigated, we included functional as well as enumerative mea-sures. However, our enumerative findings are similar to those of Tollerud et al. With regard to gender differences, in both studies there were greater numbers of B cells (in the peripheral circulation) in males. Both studies also suggest racial differ-ences in enumerative measures. Tollerud and coworkers re-ported increased numbers of B cells in black males compared to those in Caucasians, similar to our finding of higher num-bers of B cells in African-Americans compared to those in Latinos/Latinas. Further, Tollerud et al. reported that their older adolescent female subjects had a higher proportion of CD41cells than the older adolescent males (ages 17 to 19),
similar to our finding that females (12 to 18 years of age) had a greater number and percentage of CD41cells than males.
There were also differences between the present study and that of Tollerud et al. While Tollerud et al. found gender differences in CD81cell counts, we did not (nor did we find
racial differences in CD81counts). Further, Tollerud and
co-workers found that the CD41-to-CD81 ratio was higher in
males, while we found that it was higher in females. Addition-ally, the data of Tollerud et al. suggest that this ratio was higher in blacks than in Caucasians, while we found no differences between blacks and Hispanics. These differences may reflect gender-race interaction effects which might be quite different due to the difference in racial composition between the two samples.
Studies of populations much more diverse than that in the present study also report enumerative differences related to age. For example, Comans-Bitter and colleagues (8) also re-ported on cell numbers in subjects from infancy to adulthood. These researchers’ sample included 23 children from ages 10 to 16 years as part of a study of age-related differences in cell counts and percentages. While the subjects studied were not comparable to ours, Comans-Bitter et al. reported that the percentage of NK cells increases with age, while the actual FIG. 9. Lymphocyte proliferation in response to PWM by race (P,0.0001).
Data has been log transformed and is presented as the mean6standard error of the mean (n5206).
FIG. 10. The percentage of S. aureus cells killed as a function of race (P,
0.05). The data is presented as the mean6standard error of the mean (n5206).
on August 17, 2020 by guest
http://cvi.asm.org/
number of cells appears to remain stable. In our more re-stricted age range, we found a similar trend for an increased percentage but not an increased number of NK cells. While Comans-Bitter et al. reported no statistical findings, their ob-servations that age may affect the percentage but not the num-ber of NK cells are similar to ours in that numnum-bers and/or percentages of lymphocytes can vary with age independently of each other.
Ihara and colleagues (15) assessed polymorphonuclear leu-kocyte functioning (H2O2 generation, which suggests killing
activity) in 58 children and adolescents and reported increased H2O2production by polymorphonuclear leukocytes exposed to
S. aureus or Escherichia coli with increased age (6 months to 15
years). Further, Ihara et al. found that adolescents’ (ages 10 to 15 years) granulocyte function (H2O2production) was similar
to that of adults, while children’s H2O2production was lower.
We found that bacterial killing peaked when the subjects were 14 years old and then declined with age to values lower than those seen in the 12- to 13-year-old adolescents by age 18. The results from our study seem different in that we would predict decreased H2O2production in adults compared to early
ado-lescents, while Ihara et al. found that H2O2 production in
young adolescents and adults was quite similar. These differ-ences may relate to the differdiffer-ences in study design, making the comparability of these two data sets difficult to assess (Ihara and colleagues measured hydrogen peroxide generation, an indirect measure of bactericidal activity, while we measured directly the number of bacteria that were ingested and killed). Further, the data presented by Ihara encompassed a much greater age range, with infants, prepubescent children, and pubescent or postpubescent adolescents, while our only sub-jects were postpubescent adolescents. However, despite these large methodological differences, both studies support the hy-pothesis that granulocyte function changes with age in young people.
Having demonstrated age-, gender-, and race-related differ-ences in immunity during adolescence, one may speculate as to mechanisms possibly involved. Hormonal factors, especially those present during adolescence, may have influenced our results and offer venues for future investigation. For example, hormonal changes associated with growth and development may affect immunity. Indeed, peripheral blood lymphocytes have receptors for hormones such as growth hormone (GH) (20), GH releasing factor (GRF), and somatostatin (5), and some peripheral blood lymphocytes have been found to pro-duce GH, somatostatin, and a GRF-like peptide (5). Some of the age-related differences we found might be related to GH or GRF, but it is possible that the majority of the 12- to 18-year-old subjects we studied were actively growing with similar lev-els of growth hormones.
The possibility that other growth-related hormonal factors account for some of the age-related differences we describe is suggested by the literature concerning the secretion of insulin-like growth factor (21), which is produced in response to se-cretion of GH. The sese-cretion of insulin-like growth factor increases in both male and female adolescents, peaks higher and earlier in girls, and decreases during the latter half of adolescence to adult levels (1). This finding may help explain the age differences and suggests that age effects may be sub-sumed in gender findings, as girls have the most rapid growth during early puberty (before the onset of menses), while boys grow more during midpuberty (25). We undertook age by gender interaction tests to explore this and found only one significant measure (age by sex test for B-cell numbers, P, 0.04). Future studies comparing adolescents to same-sex fully mature adults may further delineate this issue.
Sex steroids, which also change significantly during pubertal development and continue to fluctuate in diurnal or monthly rhythms, may also have influenced our findings. Estrogen and/or progesterone may affect immunity directly or indirectly (2, 10, 23, 24, 27, 30, 32, 33, 37). Enumerative (34, 38) and functional myeloid (16, 17, 29, 36) and lymphoid (7, 28, 37, 39, 42) measures have been reported to be affected by sex steroids. Enumerative immune measures may be affected by sex ste-roids. Casson and colleagues (6) reported that the percentage of CD41cells was decreased, while that of NK cells was
in-creased, when postmenopausal women were treated with de-hydroepiandrosterone. Kiess and coworkers (22) reported lower percentages of CD41cells in untreated males with
hy-pogonadism compared to those in normal healthy men and those in subjects with treated hypogonadism, which resulted in normal testosterone levels. Our finding of lower numbers of CD41cells in males is consistent with Casson and coworkers’
(6) findings suggesting that circulating androgens (in post-menopausal women) are associated with decreased numbers of CD41cells.
Concerning sex steroid effects on mitogen stimulation, Yron and colleagues (42) found that neither 17 beta-estradiol nor progesterone altered the response to ConA. We found no gender differences in T- or B-cell response to mitogen stimu-lation (PHA, PWM, or ConA). Therefore, our findings are consistent with those of Yron et al. and suggest that response to mitogen stimulation is not significantly affected by gender differences in gonadal hormones.
Contradictory findings for effects of sex steroids on NK ac-tivity have been reported. For example, Sorachi and coworkers (37) reported that 17 beta-estradiol (E2) enhances NK activity, while progesterone and testosterone do not. Liu and Hansen (26) reported that NK cytotoxic activity was inhibited by pro-gesterone. Mandler and coworkers (27) reported that NK cell depolarization is affected by progesterone but not by estrogen. Contrarily, Callewaert and coworkers (4) reported that NK cell activity was not affected by high concentrations in vitro of testosterone, progesterone, or estradiol. We did not find any gender (or age3sex)-related differences in NK cell activity, and therefore our findings are more in keeping with the im-plications of the results reported by Callewaert and colleagues. However, we did not control for stage of menstrual cycle, which at peaks of estrogen or progesterone might have yielded very different results.
In addition to age and gender effects, we found significant racial differences in some enumerative measures and in gran-ulocyte function (African-Americans compared to Latino/ Latina youth). Tollerud and coworkers also found racial dif-ferences in enumerative measures (percentage of HLA-DR1)
(Caucasians versus blacks). Ihara and colleagues (15) did not indicate their subjects’ race, but presumptively their sample was all Japanese, thereby precluding any investigation of racial differences. The biological basis of racial differences remains to be explored. However, this data suggests the existence of racial differences in immunity which must be addressed whenever immune-related disease processes are investigated.
The potential for selection bias in this data must be ad-dressed. The subjects in the present study were recruited from an inner-city high school and an inner-city adolescent general medical clinic. Students were members of randomly selected 10th grade English classes, and greater than 90% of the stu-dents in each targeted class agreed to participate. Similarly, in the adolescent clinic, consecutive patients were approached for participation in the study, and greater than 80% of these ad-olescents agreed to participate. Results from studies with high school dropouts or children with academic problems requiring
on August 17, 2020 by guest
http://cvi.asm.org/
special education services might be dissimilar to those of the present study.
Concerning the physical well-being of the subjects in the present study, all were categorized as healthy by physicians, based on both history and physical examination. Since these subjects were part of a larger study on behavioral and biolog-ical AIDS risk factors, we also collected a large, intimate be-havioral and psychological data set on the same day as veni-puncture. The subjects had no reason to misrepresent their health, and they were asked much more personal information than when they had most recently been ill. The time frame for recall of intercurrent health problems was short (2 weeks) and thus should not have represented a problem in recall. The random selection of the subjects, the physical assessment by physicians, the collection of intimate psychobehavioral data and venipuncture on the same day, as well as the immediate processing of the blood for each of the multiple immune assays were important factors in assuring the quality of this normative data.
The effects of demographic factors on a wide range of im-munological variables demonstrate the importance of having normative data representative of particular patient popula-tions. Even though our subjects were randomly sampled from the same general population, there were marked immunolog-ical differences in subgroups defined by age, gender, and race. If the stability of these factors over time is addressed in these types of studies, researchers will have an even clearer picture of the normative values of immunological functioning in ado-lescents.
REFERENCES
1. Allen, D. B., A. J. Johanson, and R. M. Blizzard. 1996. Growth hormone treatment. In F. Lifshitz (ed.), Pediatric endocrinology. Marcel Dekker, Inc., New York, N.Y.
2. Athreya, B. H., J. Pletcher, F. Zulian, D. B. Weiner, and W. V. Williams. 1993. Subset specific effects of sex hormones and pituitary gonadotropins on human lymphocyte proliferation in vitro. Clin. Immunol. Immunopathol.
66:210–211.
3. Birmaher, B., B. S. Rabin, M. R. Garcia, U. Jain, T. L. Whiteside, D. E.
Williamson, M. al-Shabbout, B. C. Nelson, R. E. Dahl, and N. D. Ryan.1994. Cellular immunity in depressed, conduct disorder, and normal adolescents: role of adverse life events. J. Am. Acad. Child Adolesc. Psychiatry 33:671– 678.
4. Callewaert, D. M., V. K. Moudgil, G. Radcliff, and R. Waite. 1991. Hormone specific regulation of natural killer cells by cortisol. Direct inactivation of the cytotoxic function of cloned human NK cells without an effect on cellular proliferation. FEBS Lett. 285:108–110.
5. Campbell, R. M., and C. G. Scanes. 1995. Endocrine peptides ‘moonlighting’ as immune modulators: roles for somatostatin and GH-releasing factor. J. Endocrinol. 147:383–396.
6. Casson, P. R., L. C. Faguin, F. B. Stentz, A. B. Staughn, R. N. Andersen,
G. E. Abraham, and J. E. Buster.1993. Replacement of dehydroepiandro-sterone enhances T-lymphocyte insulin binding in postmenopausal women. Fertil. Steril. 63:1027–1031.
7. Clerici, M., L. DePalma, E. Roilides, R. Baker, and G. Shearer. 1993. Analysis of T helper and antigen-presenting cell function in cord blood and peripheral blood leukocytes from healthy children of different ages. J. Clin. Invest. 91:2829–2836.
8. Comans-Bitter, W. M., R. deGroot, R. van de Beemd, H. J. Neijens, W. C.
Hop, K. Groeneveld, H. Hoojikaas, and J. J. M. van Dongen.1997. Immu-nophenotyping of blood lymphocytes in childhood. J. Pediatr. 130:388–393. 9. Daynes, R. A., and B. A. Araneo. 1992. Natural regulators of T-cell
lympho-kine production in vivo. J. Immunother. 12:174–179.
10. Evagelatou, M., and J. Farrant. 1994. Effect of 17 beta-estradiol on immu-noglobulin secretion by human tonsillar lymphocytes in vitro. J. Steroid Biochem. Mol. Biol. 48:171–177.
11. Gemou-Engesaeth, V., A. B. Kay, A. Bush, and C. J. Corrigan. 1994. Acti-vated peripheral blood CD4 and CD8 T-lymphocytes in child asthma: cor-relation with eosinophilia and disease severity. Pediatr. Asthma Allergy Immunol. 5:170–177.
12. Georgescu, R., and S. E. Keller. 1987. Overnight storage at 1°C does not affect NK cytotoxicity. J. Immunol. Methods 103:151.
13. Georgescu, R., and S. E. Keller. 1987. Decreasing the spontaneous release in
NK cell assays. J. Immunol. Methods. 103:143.
14. Gillis, S., M. M. Ferm, et al. 1978. T cell growth factor: parameters of production and a quantitative microassay for activity. J. Immunol. 120:2027– 2032.
15. Ihara, T., K. Yamawaki, T. Fujiwara, K. Kitamura, M. Sakurai, and H.
Kamiya.1994. A flow cytometric method for measurement of hydrogen peroxide generation by pediatric polymorphonuclear leukocytes stimulated by Staphylococcus aureus and Escherichia coli. Acta Paediatr. Jpn. 36:244– 249.
16. Ito, I., T. Hayashi, K. Yamada, M. Kuzuya, M. Naito, and A. Iguchi. 1995. Physiological concentration of estradiol inhibits polymorphonuclear leu-kocytes chemotaxis via a receptor mediated system. Life Sci. 56:2247– 2253.
17. Jansson, G. 1991. Oestrogen-induced enhancement of myeloperoxidase ac-tivity in human polymorphonuclear leukocytes—a possible cause of oxidative stress in inflammatory cells. Free Radical Res. Commun. 14:195–208. 18. Jenkins, C. D., B. E. Kreger, R. M. Rose, and M. Hurst. 1980. Use of monthly
health review to ascertain illness and injuries. Am. J. Public Health 70:82–84. 19. Keller, S. E., S. J. Schleifer, J. Sherman, M. Camerino, H. Smith, Jr., and M.
Stein.1981. Comparison of a simplified whole blood and isolated lymphocyte stimulation technique. Immunol. Commun. 10:417–431.
20. Kelley, K. W. 1989. Commentary—growth hormone, lymphocytes and mac-rophages. Biochem. Pharmacol. 35:705–713.
21. Kelley, K. W., S. Arkins, and M. Y. Li. 1992. Growth hormone, prolactin, and insulin-like growth factors: new jobs for old players. Brain Behav. Immun.
6:317–326.
22. Kiess, W., L. L. Liu, and N. R. Hall. 1991. Lymphocytes subset distribution and natural killer cell activity in men with idiopathic hypogonadotropic hypogonadism. Acta Endocrinol. 124:399–404.
23. Kincade, P. W., K. L. Medina, and G. Smithson. 1994. Sex hormones as negative regulators of lymphopoiesis. Immunol. Rev. 137:119–134. 24. Li, Z. G., V. A. Danis, and P. M. Brooks. 1993. Effects of gonodal steroids in
the production of IL-1 and IL-6 by blood mononuclear cells in vitro. Clin. Exp. Rheumatol. 11:157–162.
25. Lifshitz, F., and C. D. Cervantes. 1996. Short stature. In F. Lifshitz (ed.), Pediatric endocrinology. Marcel Dekker, Inc., New York, N.Y.
26. Liu, W. J., and P. J. Hansen. 1993. Effects of the progesterone-induced serpin-like proteins of the sheep endometrium on natural-killer cell activity in sheep and mice. Biol. Reprod. 49:1008–1014.
27. Mandler, R. N., L. C. Seamer, M. D. Domalewski, and A. D. Bankhurst. 1993. Progesterone but not estrogen depolarizes natural killer cells. Nat. Immun. 12:128–135.
28. Manyonda, I. T., R. S. Pereira, V. Makinde, M. Brincat, and R. T. Varma. 1992. Effect of 17 beta-oestradiol on lymphocyte subpopulations, delayed cutaneous hypersensitivity responses and mixed lymphocyte reactions in post menopausal women. Maturitas 14:201–210.
29. Miyagi, M., H. Aoyama, M. Morishita, and Y. Iwamoto. 1992. Effects of sex hormones on chemotaxis of human peripheral polymorphonuclear leuko-cytes and monoleuko-cytes. J. Periodontol. 63:28–32.
30. Moldofsky, H. 1994. Central nervous system and peripheral immune function and the sleep-wake system. J. Psychiatry Neurosci. 19:368–374.
31. Novo, E., M. I. Garcia, and J. Lavergne. 1993. Nonspecific immunity in Down syndrome: a study of chemotaxis, phagocytosis, oxidative metabolism, and cell surface marker expression of polymorphonuclear cells. Am. J. Med. Genet. 46:384–391.
32. Oner, P., S. Bekpinar, F. Cinar, and A. Argun. 1994. Relationship of some endogenous sex steroid hormones to leukocyte arylsulphatase A activities in pre and post menopausal healthy women. Horm. Metab. Res.
26:301–304.
33. Pacifici, R., J. L. Vannice, L. Rifas, and R. B. Kimble. 1993. Monocytic secretion of interleukin-1 receptor antagonist in normal and osteoporotic women: effects of menopause and estrogen/progesterone therapy. J. Clin. Endocrinol. Metab. 77:1135–1141.
34. Piccinni, M. P., M. G. Giudizi, R. Biagiotti, L. Beloni, L. Giannarini, S.
Sampognaro, P. Parronchi, R. Manetti, F. Annunziato, and C. Livi, et al.
1995. Progesterone favors the development of human T helper cells produc-ing Th2-type cytokines and promotes both IL-4 production and membrane CD30 expression in establish Th1 cell clone. J. Immunol. 155:128–133. 35. Rabin, R. L., M. Roederer, Y. Maldonado, A. Petru, L. A. Herzenberg, and
L. A. Herzenberg.1995. Altered representation of naive and memory CD8 T cell subsets in HIV-infected children. J. Clin. Invest. 95:2054–2060. 36. Shibuya, T., K. Izuchi, A. Kuroiwa, H. Harada, A. Kumamoto, and K.
Shirakawa.1991. Study on nonspecific immunity in pregnant women. II. Effects of hormone on chemiluminescence response of peripheral blood phagocytes. Am. J. Reprod. Immunol. 26:76–81.
37. Sorachi, K., S. Kumagai, M. Sugita, J. Yodoi, and H. Imura. 1993. Enhanc-ing effects of 17 beta-estradiol on human NK cell activity. Immunol. Lett.
36:31–35.
38. Sridama, V., S. Limpongsanurak, S. Sritippayawan, and S.
Youngprapa-korn.1992. Decreased suppressor T-lymphocytes in women who received progesterone injections. J. Med. Assoc. Thail. 75:479–482.
39. Suzuki, T., N. Suzuki, R. A. Daynes, and E. G. Engleman. 1991.
on August 17, 2020 by guest
http://cvi.asm.org/
epiandrosterone enhances IL-2 production and cytotoxic effector function of human T cells. Clin. Immunol. Immunopathol. 61:202–211.
40. Tollerud, D. J., S. T. Ildstad, L. M. Brown, J. W. Clark, W. A. Battner, D. L.
Mann, C. Y. Neuland, L. Pankiw-Trost, and R. N. Hoover.1990. T-cell subsets in healthy teenagers: transition to the adult phenotype. Clin. Immu-nol. Immunopathol. 56:88–96.
41. Weir, D. M. (ed.). 1978. Handbook of experimental immunology, 3rd ed. Blackwell Scientific Publications Ltd., Oxford, England.
42. Yron, I., A. Langer, T. Weinstein, E. Sahar, Y. Lidor, Y. Pardo, I. Katz, L.
Shohat, Y. Kalechman, J. Ovadia, et al.1991. Effects of sex hormones in human T cell activation by concanavalin A. Nat. Immun. Cell Growth Regul.
10:32–44.