Available Online atwww.ijcsmc.com
International Journal of Computer Science and Mobile Computing
A Monthly Journal of Computer Science and Information Technology
ISSN 2320–088X
IMPACT FACTOR: 6.017
IJCSMC, Vol. 5, Issue. 10, October 2016, pg.69 – 80
Impact of Node Mobility on
MANET Routing Protocols Models
Lokeswari.S
1, Saravanan.P
21
MPhil Scholar, Dept.of Computer Science, Sengunthar Arts &Science College, Tamil Nadu, India
2
Asst.Prof., Dept.of Computer Science, Sengunthar Arts &Science College, Tamil Nadu, India
1
[email protected], 2 [email protected]
_____________________________________________________________________________________________
Abstract- A Mobile Ad-Hoc Network (MANET) is a self-configuring network of mobile nodes connected by wireless links to form an arbitrary topology without the use of existing infrastructure. In this paper, we have studied the effects of various mobility models on the performance of two routing protocols Dynamic Source Routing (DSR-Reactive Protocol) and Destination-Sequenced Distance-Vector (DSDV-Proactive Protocol). For experiment purposes, we have considered four mobility scenarios: Random Waypoint, Group Mobility, Freeway and Manhattan models. These four Mobility Models are selected to represent possibility of practical application in future. Performance comparison has also been conducted across varying node densities and number of hops. Experiment results illustrate that performance of the routing protocol varies across different mobility models, node densities and length of data paths.
Keywords- MANET, DSR-Reactive Protocol, DSDV-Proactive Protocol, Routing Protocol
______________________________________________________________________________________________
_________________________
_
I. Introduction
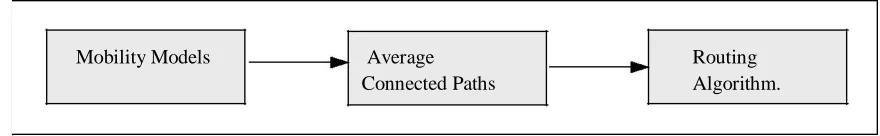
Mobility Models Average Routing
Connected Paths Algorithm.
Figure 1. Relationship between protocol performance and mobility model.
The mobility of the nodes affects the number of average connected paths, which in turn affect the performance of the routing algorithm. We have also studied the impact of node density on routing performance. With very sparsely populated network the number of possible connection between any two nodes is very less and hence the performance is poor. It is expected that if the node density is increased the throughput of the network shall increase, but beyond a certain level if density is increased the performance degrades in some protocol. We have also studied the effect of number of hops on the protocol performance [5] [6] [7] [8].
II. Description of Routing Protocol A. Destination-Sequenced Distance-Vector (DSDV)
Destination-Sequenced Distance-Vector Routing protocol is a proactive table driven algorithm based on classic Bellman -Ford routing. In proactive protocols, all nodes learn the network topology before a forward request comes in. In DSDV protocol each node maintains routing information for all known destinations. The routing information is updated periodically. Each node maintains a table, which contains information for all available destinations, the next node to reach the destination, number of hops to reach the destination and sequence number. The nodes periodically send this table to all neighbors to maintain the topology, which adds to the network overhead. Each entry in the routing table is marked with a sequence number assigned by the destination node. The sequence numbers enable the mobile nodes to distinguish stale routes from new ones, there by avoiding the formation of routing loops [9].
B. Dynamic Source Routing (DSR)
Dynamic Source Routing protocol is a reactive protocol i.e. it determines the proper route only when a packet needs to be forwarded. The node floods the network with a route-request and builds the required route from the responses it receives. DSR allows the network to be completely self-configuring without the need for any existing network infrastructure or administration. The DSR protocol is composed of two main mechanisms that work together to allow the discovery and maintenance of source routes in the ad hoc network. All aspects of protocol operate entirely on-demand allowing routing packet overhead of DSR to scale up automatically.
Route Discovery: When a source node S wishes to send a packet to the destination node D, it obtains a route
to D. This is called Route Discovery. Route Discovery is used only when S attempts to send a packet to D
and has no information on a route to D.
Route Maintenance: When there is a change in the network topology, the existing routes can no longer be
used. In such a scenario, the source S can use an alternative route to the destination D, if it knows one, or
invoke Route Discovery. This is called Route Maintenance [10] [11].
III. Mobility Models
Different mobility models can be differentiated according to their spatial and temporal dependencies.
Spatial dependency: It is a measure of how two nodes are dependent in their motion. If two nodes are moving in same direction then they have high spatial dependency.
Temporal dependency: It is a measure of how current velocity (magnitude and direction) are related to
previous velocity. Nodes having same velocity have high temporal dependency
.
visual representation of node movement in the model. NAM is a graphical simulation display tool. It has a GUI similar to that of a CD player (play, fast forward, rewind, pause and so on), and also has a display speed controller. All the simulations are performed on Network Simulator Version 2.27 which generates an output NAM file.
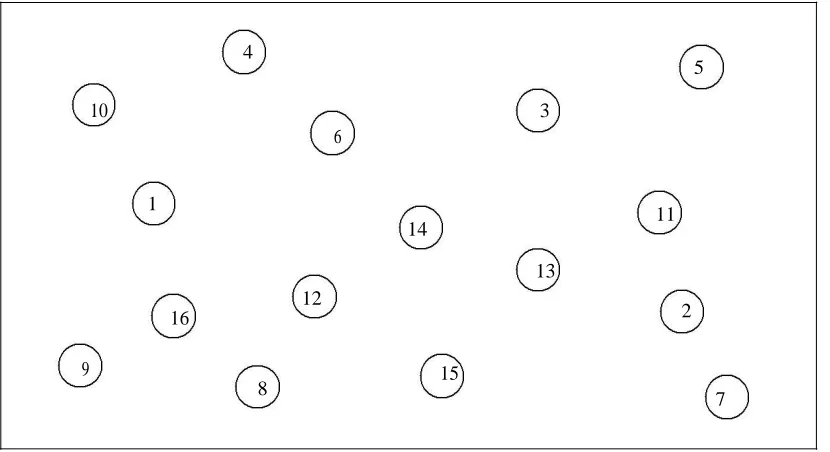
A. Random Waypoint
The Random Waypoint model is the most commonly used mobility model in research community. At every instant, a node randomly chooses a destination and moves towards it with a velocity chosen randomly from a uniform distribution [0,V_max], where V_max is the maximum allowable velocity for every mobile node. After reaching the destination, the node stops for a duration defined by the 'pause time' parameter. After this duration, it again chooses a random destination and repeats the whole process until the simulation ends. Figures 2-5 illustrate examples of a topography showing the movement of nodes for Random Mobility Model.
4
5
10 3
6
1
14 11
13
16
12
2
9
8 15
7
Figure 2. Topography showing the movement of nodes for Random mobility model.
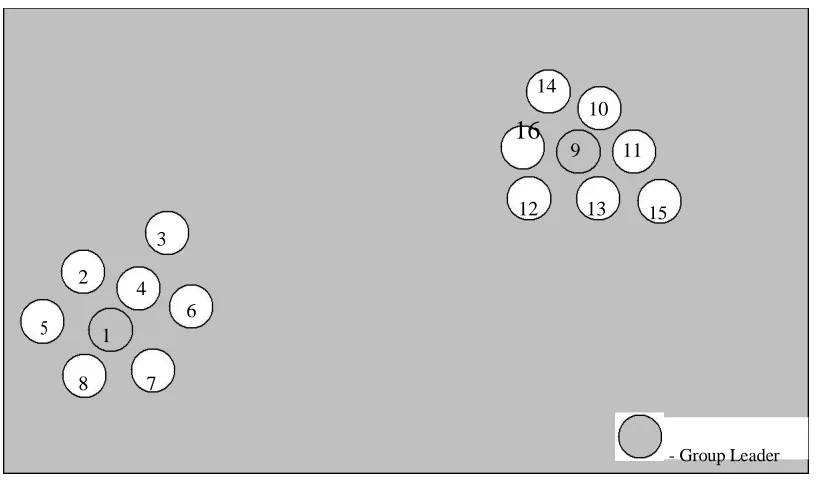
B. Random Point Group Mobility (RPGM)
14 10
16
9 11
12 13 15
3
2 4
5 6 1
8 7
- Group Leader
Figure 3. Topography showing the movement of nodesRandom point group mobility
Important Characteristics: Each node deviates from its velocity randomly from that of the leader. The movement in group mobility can be characterized as follows:
| Vmember (t) | = | Vleader (t) | + random () * SDR * max_speed (1)
| Өmember (t) | = | Өleader (t) | + random () * ADR * max_angle (2)
where 0 <<ADR, SDR<< 1. SDR is the Speed Deviation Ratio and ADR is the Angle Deviation Ratio. SDR and ADR are used to control the deviation of the velocity (magnitude and direction) of group members from that of the leader. Since the group leader mainly decides the mobility of group members, group mobility pattern is expected to have high spatial dependence for small values of SDR and ADR [12].
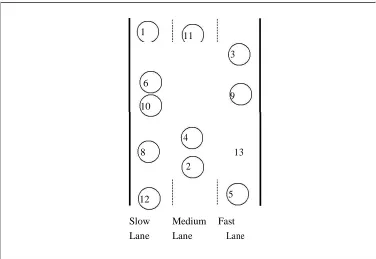
C. Freeway Mobility Model
This model emulates the motion behavior of mobile nodes on a freeway. It can be used in exchanging traffic status or tracking a vehicle on a freeway. Each mobile node is restricted to its lane on the freeway. The velocity of mobile node is temporally dependent on its previous velocity.
1 11
3
6
9 10
4
8 13
2
12 5
Slow Medium Fast
Lane Lane Lane
Figure 4. Topography showing the movement of nodes forFreeway mobility model.
Important Characteristics: In this model we use maps. There are several freeways on the map and each freeway has lanes in both directions. The differences between Random Waypoint and Freeway are the
following
:
(a)Each mobile node is restricted to its lane on the freeway.
(b)The velocity of mobile node is temporally dependent on its previous velocity. Formally,
|Vi (t+1)| = | Vi (t) | + random () * | ai (t) | (3)
(c) If two mobile nodes on the same freeway lane are within the Safety Distance (SD), the velocity of the following node cannot exceed the velocity of preceding node. Formally,
∀ i ,∀ j ,∀ t ,D ij (t)<SD ⇒|V i (t) |<|Vj(t) | (4)
if j is ahead of i in its lane.
Due to the above relationships, the Freeway mobility pattern is expected to have high spatial dependenceand
high temporal dependence. It also imposes strict geographic restrictions on the node movement by not allowing a node to change its lane.
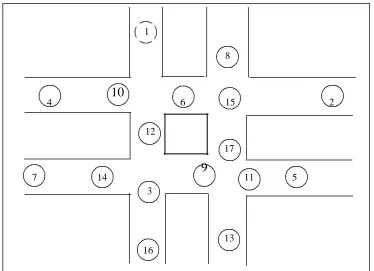
D.Manhattan Mobility Model
We introduce the Manhattan model to emulate the movement pattern of mobile nodes on streets. It can be useful in modeling movement in an urban area .The scenario is composed of a number of horizontal and vertical streets.
1
8
4
10
6 15 212
17
7 14
9
11 53
13 16
Figure 5. Topography showing the movement of nodes forManhattan mobility model
Important Characteristics: Maps are used in this model too. However, the map is composed of a number of horizontal and vertical streets. The mobile node is allowed to move along the grid of horizontal and vertical streets on the map. At an intersection of a horizontal and a vertical street, the mobile node can turn left, right or go straight with certain probability. Except the above difference, the inter-node and intra-node relationships involved in the Manhattan model are the same as in the Freeway model. It too imposes geographic restrictions on node mobility. [13]
IV. Simulation and Results
A. Scenario for Different Speed in Mobility Models
We have compared the performance of DSDV and DSR for different mobility models namely (Random Waypoint, Freeway, RPGM and Manhattan) in terms of data rate (Bytes per second) for varying speeds [14]. The routing protocol used for the simulation is available with NS-2 (version 2.27). For each of these
scenarios, movements were generated using a software called Mobility Generator [15] which is based on a
frame work called Important (Impact of Mobility Patterns On Routing in Ad -hoc NeTworks, from
University of Southern California) which upon inputs of number of nodes, mobility model and scale (area)
generates the TCL script for mobility. Background traffic, using TCL script is also employed along with the
In Random Waypoint mobility is defined as Vmax. Thus scenario having higher Vmax is highly mobile. To calculate the performance, 10 data connections are monitored and averaged.
In RPGM mobility model mobility is defined as Vmax of leader’s, because the leader is highly mobile, other
nodes in the group are spatially and temporally correlated to the motion of the leader. In RPGM four groups were formed randomly with 10 nodes each. Randomly one node in each group was elected as leader. All the nodes in the group remain within 100 mtr radius the leader. To calculate the performance, 10 data connections are monitored and averaged, irrespective of group membership.
In Freeway mobility model the mobility is defined as maximum allowed velocity of medium lane and fast and slow lane velocity +10 mtr/sec and -10 mtr/sec of medium lane velocity. Thus increasing velocity of middle lane the velocity of whole scenario can be increased. Initially all the nodes were distributed randomly in all the three lanes. To calculate the performance, 10 data connections are monitored and averaged.
In case of Manhattan mobility model each node can have any velocity from 0 to Vmax and moves with this
velocity whole time thus Vmax is defined as mobility parameter of the scenario. To calculate the performance, 10 data connections are monitored and averaged.
B. Scenario for Different Number of Nodes
Performance of DSDV and DSR is also tested in terms of data rate (Bytes per second) for different number of nodes in the system, namely (20, 40, 60, 80, 100) nodes. The mobility model selected in this scenario is Random Waypoint and background traffic is also added. Standard 802.11 MAC layer was used and transmission range in each simulation was 250 mtr. All the nodes in simulation had omni directional antennas. Standard CMUPri model for queue of buffer size 50 was used. Simulation has varying number of nodes and is run for 500 secs. Flat 700x700 mtr scenario was created in all the mobility cases. No motion in z-direction was allowed thus whole topology was two-dimensional. Trace generated was UDP type trace.
C. Scenario for Different Number of Hops
As it is very difficult to predict exact number of hops the route will take, we have compared the performances of DSDV and DSR in terms of data rate (bytes per second) and averaged it for less than 5 hops and more than 5 hops. We have used Random Mobility model with 50 mobile nodes for this comparison. In such a scenario, maximum number hops for any data path is around 10. If we consider a larger scenario with higher number of nodes then we can compare the performance for an even higher number of hops. Standard 802.11 MAC layer was used and transmission range in each simulation was 250 mtr. All the nodes in simulation had omni directional antennas. Standard CMUPri model for queue of buffer size 50 was used. Simulation is run for 500 secs in all the cases.
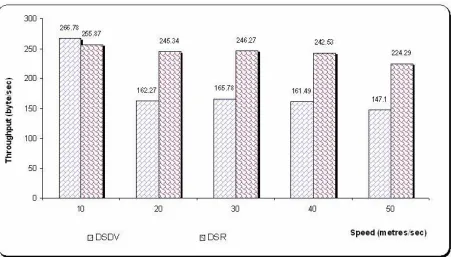
V. Experiment Results and Discussions A. Random Waypoint mobility model:
Figure 6. Variation in UDP throughput with increase in mobility for Random Waypoint Mobility model.
B. Random Point Group Mobility:
C. Freeway mobility model:
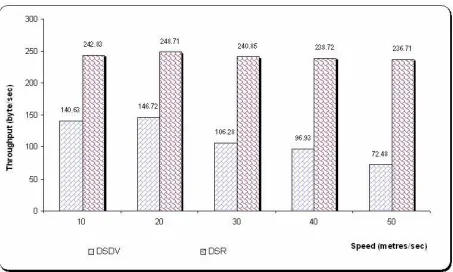
Figure 8. Variation in UDP throughput with increase in mobility for Freeway Mobility Model.
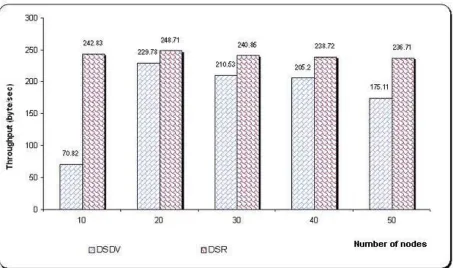
E. DSR Vs DSDV for different number of nodes
Figure 10. Variation in UDP throughput with increase in node density for Random Waypoint Mobility model.
F. DSR Vs DSDV for different number of hops
Table 1.Variation in UDP throughput with increase in number of hops for Random Waypoint
Mobilitymodel
DSR DSDV
(Bytes per Unit Time) (Bytes Per Unit Time)
Less than 5 Hops 254.08 123.84
More than 5 Hops (less than 9) 193.92 24.96
A. Performance of DSR and DSDV for varying speed on different mobility models
In all the four mobility models we have increased the mobility and recorded the performance. We did this simulation for 500 secs with 10 udp connections. Readings were taken for different mobility (Max speed 10, 20, 30, 40, 50 mtrs/sec). The total throughput of the system was averaged. From the results it is evident that as the mobility increases; the performance of both DSR and DSDV deteriorates. But in all the four cases, DSR performs better then DSDV. High mobility nature suggests that rather looking for a shorter
path in routing, we must stress on more stable path to reduce overheads
.
B. Performance of DSR and DSDV for varying node density:
of topology. As the number of nodes is increased the performance becomes more or less constant but if density is too large, more and more of nodes try to access the common medium, thus number of
collisions increase therebyincreasing packet loss and decreasing the throughput. DSR performs better
than DSDV because of its adaptive nature. Also from the graph we can see that performance of DSR does not deteriorate too much even after increase in number of nodes.
C. Performance of DSR and DSDV for varying number of hops:
In our simulation for varying number of hops, we see that the performance of DSDV deteriorates very badly for higher number of hops. But performance of DSR is much better than DSDV for both the cases considered. Here the maximum number of hops for any data path is nine. If we consider a larger scenario with higher number of nodes then we can compare performance for larger routes (higher hops). From the results we can see that if we compare the performance for higher number hops it will deteriorate in both the cases but much faster in case of DSR than DSDV. Route maintenance is much better in DSR as compared to DSDV. The reduction in performance may be attributed to link breakage, which is more probable as the length of the route increases. In case of DSDV re-establishment of new routes does not take place till there is a route table information packet coming from its neighbor nodes. But in case of DSR, when route breakage takes place, packets are cached and route repair takes place. This improves the overall through put of the system.
VI. Conclusions
Empirical results illustrate that the performance of a routing protocol varies widely across different mobility models and hence the study results from one model cannot be applied to other model. Hence we have to consider the mobility of an application while selecting a routing protocol. DSR gives better performance for highly mobile networks than DSDV. DSR is faster in discovering new route to the destination when the old route is broken as it invokes route repair mechanism locally whereas in DSDV there is no route repair mechanism. In DSDV, if no route is found to the destination, the packets are dropped.
Future study should be conducted to compare protocols in low mobility environment, where routes do not break to too often. Proactive protocols may give better performance for near stable environment. Performance of other routing protocol can be evaluated over various mobility models taking in to consideration number of average connected paths to gain greater insights into the relationship between them. Designing scenarios which depict real world applications more accurately can be designed through in-depth study of the application.
References
[1] S. Corson and J. Macker, Mobile Ad hoc Networking (MANET): Routing Protocol Performance Issues and Evaluation Considerations, RFC: 2501, January 1999.
[2] Carlo Kopp, “Ad Hoc Networking”, Systems Journal, pp 33-40, 1999.
[3] Guolong Lin, Guevara Noubir and Rajmohan Rajaraman, "Mobility Models for Ad hoc Network Simulation", In Proceedings of IEEE INFOCOM 2004, Volume 1, pp. 7-11, 2004. [4] Tracy Camp, Jeff Boleng and Vanessa Davies, “A Survey of Mobility Models for Ad Hoc
Network” Special issue on Mobile Ad Hoc Networking: Research, Trends and Applications, vol. 2, no. 5, pp. 483-502, 2002.
[5] F. Bai and A. Helmy, "The IMPORTANT Framework for Analyzing and Modeling the Impact of Mobility in Wireless Adhoc Networks", in Wireless Ad Hoc and Sensor Networks, Kluwer Academic Publishers, 2004.
[6] F. Bai, A. Helmy, “A Survey of Mobility Modeling and Analysis in Wireless Adhoc Networks” in Wireless Ad Hoc and Sensor Networks, Kluwer Academic Publishers, 2004. [7] F. Bai, G. Bhaskara and A. Helmy," Building the Blocks of Protocol Design and Analysis --
Micro-analyze the Impact of Mobility on Performance of Routing protocols for Adhoc Networks, IEEE INFOCOM, pp. 825-835, 2003.
[9] Charles E Perkins and Pravin Bhagwat, “Highly Dynamic Destination Sequenced Distance Vector Routing (DSDV) for Mobile Computers”, SIGCOMM 94, pp. 234-244, 1994.
[10] David B. Johnson, David A. Maltz, Yih-Chun Hu, The Dynamic Source Routing (DSR) Protocol for Mobile Ad Hoc Networks.draft-ietf-manet-dsr-10.txt, July 2004.
[11] David B. Johnson and David A. Maltz. “Dynamic Source Routing in Ad Hoc Wireless Networks”. In Mobile Computing, edited by Tomasz Imielinski and Hank Korth, Chapter 5, pages 153-181, KluwerAcademic Publishers, 1996.
[12] Biao Zhou, Kaixin Xu and Mario Gerla, “Group and Swarm Mobility Models for Ad Hoc Network Scenarios Using Virtual Tracks, In Proceedings of MILCOM’2004, Volume 1, pp. 289- 294, 1994.
[13] User Manual for IMPORTANT Mobility Tool Generator in NS-2 Simulator. http://nile.usc.edu/important/software.htm , Release Date February 2004.
[14] Mobility Generator (version 1.0) from the site, http://nile.usc.edu/important/software.htm, February 2004.