Acceleration of Very Large Reflectarray Radiation Pattern
Computation Using an Adaptive Resolution Spectral Grid
Daniel R. Prado1, *, Manuel Arrebola2, Marcos R. Pino2, Jos´e A. Encinar3, and Fernando Las-Heras2
Abstract—In this work, a novel use of the Non-Uniform Fast Fourier Transform (NUFFT) in reflectarray antenna analysis is proposed to greatly accelerate the computation of radiation patterns using a non-uniform, reduced and adaptive grid in the spectral domain. The proposed methodology is very useful for very large reflectarrays, which have very narrow beamwidths due to their large directivity, and shaped-beam reflectarrays for satellite applications such as Direct Broadcast Satellite (DBS), which might require a compliance analysis in very small angular regions. In those cases, high resolution in the radiation pattern is required, while a low resolution could be enough elsewhere to account for side lobes. However, current analysis techniques for such reflectarrays present limitations regarding large memory footprints or slow computations. The methodology presented in this work allows to overcome those limitations by performing computations in a non-uniform, reduced and adaptive grid in the transformed UV domain, achieving faster computations using considerably less memory. Numerical examples for current applications of interest are provided to assess the capabilities of the technique. In particular, the use of the NUFFT allows to compute efficiently the radiation pattern in any principal plane with improved resolution for multibeam applications. Also, compliance analyses for DBS applications may be improved with the use of a reduced, multiresolution grid and the NUFFT. The proposed technique is thus suitable to greatly accelerate optimization algorithms.
1. INTRODUCTION
The most common use of the Non-Uniform Fast Fourier Transform (NUFFT) in array antenna analysis is the efficient computation of the radiation pattern of aperiodic arrays [1, 2], which may be applied to the process of thinning arrays with reduced side lobes [3, 4], multi-objective optimization of aperiodic arrays using evolutionary algorithms [5], secondary lobe [6] or grating lobe [7] suppresion, maximum reduction of the interference in wireless communication systems [8], amplitude controlled reflectarrays using non-uniform frequency selective surfaces [9], and electronically steerable arrays with evolutionary algorithms [10], among others. In particular, we will focus on a particular type of array antennas, i.e., reflectarray antennas, since current applications demand very large reflectarrays composed of thousands of elements, requiring efficient computational techniques for their analysis, where the NUFFT may be applied to improve the performance of current analysis techniques.
Reflectarray antennas have been proposed for applications that require very large, high gain aperture antennas, such as multibeam [11], Synthetic Aperture Radar (SAR) [12–14] or Direct Broadcast Satellite (DBS) [1, 15–17]. Such reflectarrays are composed of thousands of elements and present very narrow beamwidths. For instance, the reflectarray in [15] has 7 000 elements while the one in [16] has close to 13 500 elements with an aperture size of 78λ×74λat central frequency. In both cases, there are
Received 16 October 2018, Accepted 25 November 2018, Scheduled 5 December 2018
* Corresponding author: Daniel R. Prado ([email protected]).
coverage zones with an angular range smaller than 1 in the spectral grid. Even larger reflectarrays have been proposed for multibeam [11] with more than 20 000 elements with an aperture size of 120λ×120λ at 20 GHz, providing a beam spacing smaller than 0.6 . In [13] two rectangular reflectarrays composed of 51 750 and 61 650 elements were proposed for SAR with a beamwidth smaller than 0.4 in azimuth, while in [14] an extremely large elliptical reflectarray composed of 180 000 elements and 52.8 dBi of gain was also considered for SAR applications. The radiation pattern computation of such reflectarrays is a challenging task since they require a high spectral resolution to properly capture their features, but prevailing analysis techniques present certain limitations that make this computation a challenge from the point of view of computing time and memory footprint.
Currently, there are two methods for the computation of radiation pattern: an analysis using the Fast Fourier Transform (FFT) and the direct evaluation of the equations. Both present some limitations when dealing with very large reflectarrays such as the ones mentioned above. On the one hand, the analysis with the FFT [18] allows to efficiently compute the array factor, or more generally the spectrum functions. However, one limitation of the analysis with the FFT is that the spectral grid where the far field is computed and fixed, usually has M = 2n×2n points [19], with n ∈N controlling the far field resolution. Thus, memory usage grows exponentially as n increases linearly. Due to the high gain of those reflectarray antennas, this might become an issue when performing reliable compliance analyses in very small coverage zones, or when computing the radiation pattern of reflectarrays with very narrow beamwidths. On the other hand, the memory issue may be circumvented by a direct evaluation of the equations, since there is flexibility to choose the spectral grid in that case, for instance with a grid with high resolution in the region of interest, and sparse elsewhere, so the total number of points in the spectral domain is considerably reduced [20, 21]. However, this approach is extremely slow due to the high number of reflectarray elements involved, which must be evaluated one by one. Until now, there has not been any technique which is able to compute the radiation pattern of such large reflectarrays with high resolution in an efficient fashion while having a low memory footprint, since they either employ a large amount of memory for a high resolution far field [19] or are very slow if using a direct evaluation of the equations [20, 21].
In this paper, we propose a novel use of the Non-Uniform FFT (NUFFT) [22] which has not been considered previously in the literature by the antenna community. It allows to efficiently compute the radiation pattern of very large reflectarrays with high resolution in the area of interest while keeping a low memory footprint, thus solving the aforementioned limitations of current analysis techniques (FFT and direct evaluation). It is based on the use of a non-uniform, adaptive grid in the spectral domain for the computation of the far field with the NUFFT. Unlike the common approach of the NUFFT in the antenna literature, only employed for an efficient analysis of aperiodic arrays [1, 20, 23], here we exploit the fact that the NUFFT allows to have non-uniform grids in both domains, the physical element coordinates (x, y) and, in particular, the spectral grid (u, v). A number of practical scenarios where this technique may be employed to overcome the computing time and memory footprint issues are presented. In all cases, the proposed technique is compared with the FFT analysis and direct evaluation of the equations, showing superior performance. Thus, its use in optimization schemes would allow to greatly accelerate computations while reducing memory footprint, since the analysis routine is called hundreds or thousands of times.
2. FAR FIELD COMPUTATION OF LARGE REFLECTARRAYS 2.1. Analysis with the FFT and Limitations
The most time-consuming operation when computing the radiation pattern of a bidimensional planar aperture is the computation of the spectrum functions. If the aperture has the tangential field uniformly discretized inN =NxNy samples, a generic spectrum function may be expressed as [20]:
P(u, v) =K
N
i=1
Ei(xi, yi) expjk0(u xi+v yi)
, (1)
where Ei is one generic component of the tangential field, (xi, yi) the coordinates of the center of the
to [20]:
K(u, v) =a b sinc
k0u a 2
sinc
k0v b 2
, (2)
a, b being the periodicity of the samples and u = sinθcosϕ, v = sinθsinϕ (see Figure 1). Although Figure 1 shows a general case in which both domains, physical and spectral, are non-uniform, in this work we will focus on periodic reflectarrays with a non-uniform spectral grid, since the aperiodic reflectarray case is studied elsewhere [1, 20].
θ ϕ
θ ϕ r ∞
Figure 1. Sketch of an aperiodic array with a non-uniform UV domain, with high resolution in the regions of interest and a sparse grid elsewhere. The NUFFT allows to perform efficiently this kind of computations.
When both domains, (x, y) and (u, v), are uniformly discretized, Eq. (1) can be efficiently evaluated by means of the FFT [19]. For this purpose, the number of points in the source domain (x, y) is extended in order to obtain a high resolution in the transformed domain (u, v). This is done by setting Ei = 0 to those elements which do not belong to the actual aperture or array. If (a, b) is the periodicity in (x, y) andM =MuMv the number of points in the (u, v) domain, the spectral variables are discretized according to a fixed grid as follows:
u= 2π p
Mua k0 −
π a k0
; p= 0, 1, . . . , Mu−1, (3a)
v= 2π q
Mvb k0 −
π b k0
; q = 0,1, . . . , Mv−1, (3b)
where a shift in the indices p and q was applied to center the UV grid [19]. As a result of Eq. (3), the range of the UV coordinates for the FFT analysis is:
−λ0
2a ≤u <
λ0
2a and −
λ0 2b ≤v <
λ0
2b, (4)
v
u 1
v
u
1
(b) (a)
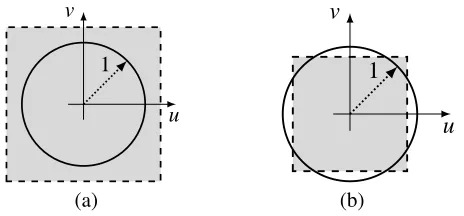
Figure 2. Influence of the periodicity of the source domain (x, y) in the UV grid for the FFT analysis. The grey area represents the grid where the FFT computes the array factor or spectrum function. (a) Periodicity smaller than half a wavelength. (b) Periodicity larger than half a wavelength.
domain is usuallyM = 2n×2n. Common values aren= 8,9 or 10, which give (u, v) grids of 256×256, 512×512 and 1024×1024 points. However, for very large arrays with high directivity, the main beam is very narrow, and higher values might be needed, such asn= 11,12. Although computing time is still fast since the FFT is employed, memory usage grows exponentially with higher (u, v) resolutions.
2.2. Computation of the Radiation Pattern with the NUFFT
The NUFFT efficiently evaluates Eq. (1) when either or both domains are non-uniform [22], as depicted in Figure 1. In this way, aperiodic reflectarrays whose radiation pattern is computed in a non-uniformly sampled UV grid may be efficiently analyzed [21]. This allows to greatly reduce the number of points in the side lobes region while increasing resolution in the main beam, reducing memory usage and accelerating computations.
More specifically, the NUFFT is a generalization of the FFT to allow for non-regular grids in either or both domains [24], reducing the time cost of evaluating Eq. (1) fromO(MN) of the inefficient direct evaluation to O(MlogM). This is achieved by approximating the complex exponential with different interpolating schemes, for instance based on the Gaussian bell or the fast multipole method [24], so the FFT can be applied in an oversampled uniform grid. The main difference of the NUFFT with regard to traditional interpolation methods is that the NUFFT has a complete control on the obtained accuracy. There are many algorithms for the implementation of the NUFFT [22–27], and here we employ one based on a fast Gaussian interpolation, in which the oversampled uniform grid is obtained through a convolution with Gaussian functions, and after applying the FFT, the desired function is obtained by deconvoluting the result of the FFT. Specific details may be found in [22, 25].
Unlike other works in the literature regarding reflectarray analysis, where the NUFFT is applied only to analyse aperiodic antennas [1, 20], here we provide the insight that by considering a non-uniform spectral grid, and a more powerful analysis technique may be employed, for either periodic or aperiodic reflectarrays. Thanks to the NUFFT, the computation of the far field with Eq. (1) becomes more flexible, since it can be obtained only in a region of interest, since the UV grid is not fixed using the NUFFT, in contrast as with the FFT by virtue of Eq. (3); or in a multiresolution grid, with low accuracy for the sidelobes and high accuracy in the region of interest; and even to compute only the principal planes, which is equivalent to perform a 2D to 1D transformation, as it will be later shown.
Finally, even though the NUFFT achieves the same computational complexity scaling as the FFT, it is slower and precision dependent. There is a parameterξ that controls the accuracy of the obtained results. For the two-dimensional case, its time complexity is [20, 24]:
O(MlogM+Mlog2ξ−1), (5)
where M > N, and ξ is the desired accuracy, which can be set to obtain an arbitrarily low error, such that [28]:
||P˜−P||
whereP is the exact value and ˜P the computed spectrum function by the NUFFT. However, this comes at the expense of slower computations. Indeed, compared with the FFT in the same conditions (same number of points in the UV grid as in [20]), the NUFFT is slower. Here, the UV grids employed with the NUFFT will have considerably fewer points than the fixed grid employed by the FFT, which will allow to achieve faster computations with a smaller memory footprint while obtaining higher resolutions in the areas of interest.
3. VALIDATION
To evaluate and validate the proposed technique, numerical examples are provided for two current applications of interest. First, a high gain antenna is considered, which is required for satellite multibeam applications [11], with high resolution and very narrow beamwidth for which only the principle planes are of interest. Due to the high gain and large number of elements, the use of the FFT requires great amounts of memory for an adequate spectral resolution, which limits the application of the FFT. The second example corresponds to a reflectarray for DBS application [15] with coverage zones with different sizes and covering a very small solid angle in some cases, which makes it difficult to carry out reliable compliance analyses with the FFT.
In all cases, computations are performed in a laptop with an Intel i7-4712MQ CPU at 2.3 GHz and 8 GB of memory. Computing time refers to the evaluation of eight spectrum functions, required to obtain the radiation patterns with the first principle of equivalence for dual-polarized antennas.
3.1. Efficient Evaluation of a Principal Plane for Improved Resolution
The extremely large reflectarrays proposed for applications such as multibeam or SAR complicate the analysis and synthesis due to the elevated number of elements and the narrow beams, since a high resolution is required. Thus, it is proposed to use the NUFFT to compute the radiation pattern only in one cut in the UV grid, so the gain, beamwidth and side lobes may be readily characterized. This technique can be applied to any other plane by repeating the process. However, this approach is not possible using the FFT, since it computes the radiation pattern in a fixed 2D grid, employing high amounts of memory. In addition, a direct evaluation in just the principal plane is possible, but it requires more computing time than the NUFFT, as it will be shown later.
As an example of a reflectarray for multibeam application similar to [11], an elliptical reflectarray with 247×241 elements in its main axes is chosen, with a total of 46 751 unit cells. The working frequency is 19.7 GHz, and the periodicity is 7.5×7.5 mm2. The feed is placed at (−661, 0, 2 726) mm from the reflectarray center and is modeled as a cosqθ function with q = 24, which produces an illumination taper of−11 dB at the reflectarray edges. The reflectarray produces a phase-shift such that it generates a pencil beam at (θ, ϕ) = (13,0 ) in the far field.
11 11.5 12 12.5 13 13.5 14 14.5 15 10 15 20 25 30 35 40 45 50
θ( o)
Gain
(dBi)
NUFFT (multi-resolution) FFT (n = 9)
FFT (n = 10) FFT interp. (n = 10)
12.7 12.8 12.9 13 13.1 13.2 13.3
47 48 49 50
13.6 13.7 13.8 13.9 14 14.1
18 20 22 24 26 28
-9 -6.75 -4.5 -2.25 0 2.25 4.5 6.75 9
10 15 20 25 30 35 40 45 50
ϕ( o)
Gain
(dBi)
NUFFT (multi-resolution) FFT (n = 9)
FFT (n = 10) FFT intep. (n = 10)
-1.35 -0.9 -0.45 0 0.45 0.9 1.35
47 48 49 50
2.7 3.5 4.3 5.1 5.9 6.7
16 18 20 22 24 26 (b) (a)
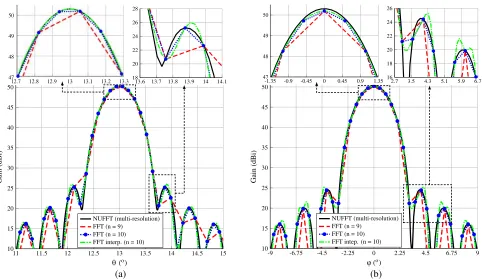
Figure 3. Comparison of the principal planes computed in an adaptive grid with multi-resolution using the NUFFT (ξ= 10−8) and two typical values ofnusing the FFT plus spline interpolation. (a)ϕ= 0 . (b)θ= 13 .
500 1,000 1,500 2,000 2,500 3,000 3,500 4,000 4,500 5,000 5,500 0
1 2 3 4
# points in main cut
Computing
time
(s)
Direct evaluation NUFFT ξ= 10- 2 NUFFT ξ= 10- 4 NUFFT ξ= 10- 6 NUFFT ξ= 10- 8
Figure 4. Comparison of computing time between the direct evaluation and NUFFT when computing the radiation pattern only in the main cut.
Table 1. Different discretizations to test the adaptive multi-resolution grid in a principal plane with the NUFFT.
# of points Step in u
[0.15, 0.30] [0, 0.15]∪[0.30, 0.45] [-1, 0]∪[0.45, 1]
5276 2−14 2−12 2−10
3433 2−13 2−11 2−10
1718 2−12 2−10 2−9
860 2−11 2−9 2−8
with the smallest number of points in the tested cut. In any case, ξ = 10−2 provides enough accuracy for the computation of radiation patterns [20].
3.2. Reduced Grid and Multiresolution in the Spectral Domain
To further demonstrate the capabilities of the technique, the large reflectarray for DBS described in [15] is considered here. It is a 1.2 m elliptical periodic reflectarray composed of 6944 elements with a periodicity of 13 mm in both dimensions. The coverage zone divides the South American continent in several areas with different specifications (see Figures 5 and 6). The solid angle covering some of these areas is very small, so a good far field resolution is required to properly analyse the compliance. Typical values for n employed in the analysis and synthesis of very large arrays are n = 9,10 [29], which might not provide enough points to analyse certain regions for this coverage, such as SC1 or SC2. Nevertheless, as n increases linearly to improve the resolution, the number of points in the FFT grid grows exponentially. Although for a single analysis the FFT is still fast, the memory footprint might become an issue since eight spectrum functions are required using the first principle of equivalence. In addition, in optimization processes where the analysis routine is called thousands of times, computing time might increase considerably. The use of the NUFFT with a reduced, adaptive grid solves both the computing time and memory issues.
A study was carried out for a uniform reduced grid using direct evaluation and NUFFT for different resolutions. The considered reduced grid is the same region as employed in [15] for the representation of the results, which roughly isu∈[0.05,0.35] and v∈[−0.22,0.12]. Points outside that region are not
- 0.10 - 0.05 0.00 0.05 0.10 0.15 0.20
- 0.35 - 0.30 - 0.25 - 0.20 - 0.15 - 0.10 - 0.05
-v
-u SA1
SA2 SB SC1 SC2 SD Isolation Transition
Figure 5. Adaptive grid for the coverage of the Amazonas satellite [15]. The grid presents a similar number of points in each coverage zone for an improved compliance analysis.
21 22 23 24 25 26 27 28 29 30 31
Gain (dBi)
-0.16
-0.18
-0.20
-0.22
-0.24
-0.26
-0.30
-0.32
-0.34 -0.28
-u
-v
-0.06 -0.04 -0.02 0.00 0.02 0.04 0.06 0.08 0.10 0.12 SA1
SA2
SC1
SC2 SB
SD
Table 2. Number of points considered for the computing time and memory studies of Figure 7. The NUFFT and direct evaluation employ a reduced grid based on that of the FFT.
n FFT points NUFFT and direct evaluation points
9 218 7110
10 220 28620
11 222 114798
12 224 458556
13 226 1836939
14 228 7350642
considered in the computation of the radiation pattern with the NUFFT or direct evaluation. For the FFT the same resolution is employed, but in the whole visible region due to its limitations. Table 2 summarizes the number of points employed by each method for different values of n. The results for computing time and memory usage are shown in Figure 7. As can be seen, the direct evaluation of the equations is the slowest method and should be avoided. The NUFFT was evaluated with several values of the precision parameter, and in all instances it was faster than the FFT for n ≥ 11, even for the highest accuracy considered in the study (ξ = 10−8). For values ξ = 10−2,10−4 the NUFFT is faster than the FFT even for n = 9, which is only faster for smaller resolutions and high precisions of the NUFFT. This is possible due to the use of the reduced UV grid, and forn= 9 it has ∼2.6·105 points for the FFT, while it has only 7110 for the NUFFT. Apart from faster computations, the memory used by the NUFFT is reduced by more than one order of magnitude, as can be seen in Figure 7(b).
9 10 11 12 13 14
10 - 2
10 - 1
100
101
102
n
Computing
time
(s)
Direct evaluation NUFFT ξ= 10-2
NUFFT = 10-4
NUFFT = 10-6
NUFFT = 10-8
FFT 9 10 11 12 13 14
10 - 1
100
101
102
103
104
n
Memory
(MB)
NUFFT FFT
(b) (a)
ξ ξ ξ
Figure 7. For different analysis methods and reduced UV grid around the coverage area: (a) computing time for eight spectrum functions, and (b) memory usage per spectrum function (NUFFT with
ξ= 10−10).
Table 3. Number of points in each zone for the Amazonas coverage for different FFT spectral grid resolutions and an adaptive grid for the NUFFT taking into account overlapping among zones.
SA1 SA2 SB SC1 SC2 SD
n = 9 138 102 261 50 14 328
n = 10 567 428 1015 211 49 1301
n = 11 2261 1709 4074 837 194 5212
n = 12 9024 6859 16269 3355 775 20864
Table 4. Surface resolution in percentage of each coverage zone for the cases shown in Table 3.
SA1 SA2 SB SC1 SC2 SD n = 9 0.72 0.98 0.38 2.00 7.14 0.30
n = 10 0.18 0.23 0.10 0.47 2.04 0.08
n = 11 0.04 0.06 0.02 0.12 0.52 0.02
n = 12 0.01 0.01 <0.01 0.03 0.13 <0.01
Adaptive grid 0.12 0.12 0.05 0.13 0.13 0.12
DBS applications also require an analysis of the copolar and crosspolar discrimination (XPD) compliances in the coverage zones, which must be carried out point by point [15]. Each zone has a minimum copolar gain that must be met (copolar compliance). The XPD is defined as the difference, point by point, of the copolar and crosspolar gain values. When a coverage area is discretized with more points, the granularity or resolution to perform the compliance analyses is better. In this regard, another issue with the Amazonas coverage shown in Figure 5 is the difference in surface extension of each coverage zone. When being analyzed with the FFT, the step in the spectral grid is fixed [19]. Thus, each zone will have a different number of points, and the disparity will be large between large and small surfaces. As an example, Table 3 shows the number of points for each zone for some values of n. As can be seen, the disparity in the number of points between zones grows as n increases. In addition, small zones such as SC2 require large values of n to have a good number of points to use for compliance analysis, which results in a slower analysis and high memory footprint using the FFT. Table 4 shows the surface resolution for the data presented in Table 3. The variation in resolution between the smallest (SC2) and largest (SD) surfaces is more than one order of magnitude. In addition, the surface resolution for SC2 is 7.14% and 2.04% for n = 9 and 10, which is not enough to perform reliable compliance analyses.
To solve this issue, a spectral grid as the one shown in Figure 5 could be used. In this grid, each coverage zone has roughly 800 points (a surface precision better than 0.2%) with the exception of SB. This is caused by the overlapping of SA1 and SA2 with SB. (In fact, since SA1 and SA2 are completely included in SB, the minimum number of points of SB would be the points of SA1 plus SA2.) To achieve something similar with the FFT, values n ≥ 12 are required (see Table 3), demanding more computational time and memory, as shown in Figure 7.
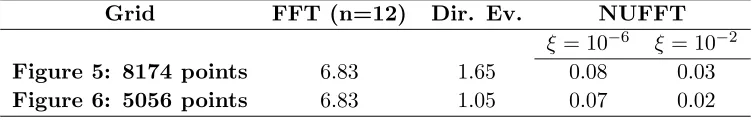
Table 5. Computing time in seconds of a multiresolution grid in the spectral domain using different methods of analysis.
Grid FFT (n=12) Dir. Ev. NUFFT ξ= 10−6 ξ= 10−2
Figure 5: 8174 points 6.83 1.65 0.08 0.03
Figure 6: 5056 points 6.83 1.05 0.07 0.02
4. CONCLUSIONS
This paper has presented a novel use of the NUFFT for an efficient analysis of very large reflectarrays using a non-uniform adaptive grid in the spectral domain. The purpose is to overcome some limitations of current analysis techniques when dealing with very large reflectarrays with high gain. Specifically, the use of the FFT leads to a high memory footprint and a direct evaluation of the equations is computationally inefficient. By using the NUFFT to obtain the radiation pattern, those limitations are overcome, achieving faster computations and a smaller memory footprint thanks to the use of a reduced spectral grid. Several examples for practical applications such as multibeam and DBS were provided to demonstrate the capabilities of the proposed technique. First, the NUFFT is employed to perform a 2D to 1D transformation in order to efficiently compute the radiation pattern of some extremely large reflectarrays in a principal plane, doing so faster than the FFT and direct evaluation with negligible memory usage for the correct prediction of gain, beamwidth and sidelobes. Then, a large reflectarray for DBS application is considered, using a multiresolution grid for better gain and XPD compliance analyses as well as faster computations of the radiation pattern. Memory usage is also reduced by more than one order of magnitude with regard to the FFT. Due to the superior performance of the proposed technique with regard to the usual analysis techniques, it is very useful for the optimization of very large reflectarrays, for instance using multiresolution grids such as the one in Figure 5, since it also includes a transition zone, copolar isolation and non-coverage areas to control side lobes.
ACKNOWLEDGMENT
This work was supported in part by the European Space Agency (ESA) under contract ESTEC/AO/1-7064/12/NL/MH; by the Ministerio de Ciencia, Innovaci´on y Universidades, under project TEC2017-86619-R (ARTEINE); by the Ministerio de Econom´ıa, Industria y Competitividad under project TEC2016-75103-C2-1-R (MYRADA); and by the Gobierno del Principado de Asturias through Programa “Clar´ın” de Ayudas Postdoctorales / Marie Courie-Cofund under project ACA17-09.
REFERENCES
1. Capozzoli, A., C. Curcio, A. Liseno, and G. Toso, “Phase-only synthesis of at aperiodic reflectarrays,” Progress In Electromagnetics Research, Vol. 133, 53–89, 2013.
2. Prado, D. R., M. Arrebola, M. R. Pino, and F. Las-Heras, “Application of the NUFFT to the analysis and synthesis of aperiodic arrays,”2017 International Conference on Electromagnetics in Advanced Applications (ICEAA), 708–711, Verona, Italy, Sep. 11–15, 2017.
3. Haupt, R. L., “Thinned arrays using genetic algorithms,”IEEE Trans. Antennas Propag., Vol. 42, No. 7, 993–999, Jul. 1994.
4. Mahanti, G. K., N. N. Pathak, and P. K. Mahanti, “Synthesis of thinned linear antenna arrays with fixed sidelobe level using real-coded genetic algorithm,”Progress In Electromagnetics Research, Vol. 75, 319–328, 2007.
5. Panduro, M. A., C. A. Brizuela, D. Covarrubias, and C. Lopez, “A trade-off curve computation for linear antenna arrays using an evolutionary multi-objective approach,” Soft Comput., Vol. 10, No. 2, 125–131, Jan. 2006.
6. Gabrielli, L. H. and H. E. Hernandez-Figueroa, “Aperiodic antenna array for secondary lobe suppression,”IEEE Photon. Technol. Lett., Vol. 28, No. 2, 209–212, Jan. 2016.
7. Su´arez, S., G. Le´on, M. Arrebola, L. F. Herr´an, and F. Las-Heras, “Experimental validation of linear aperiodic array for grating lobe suppression,” Progress In Electromagnetics Research C, Vol. 26, 193–203, 2012.
9. Li, J., Q. Chen, K. Sawaya, and Q. Yuan, “Amplitude controlled reflectarray using non-uniform FSS reflection plane,”IEEE International Symposium on Antennas and Propagation (APSURSI), 2180–2183, Spokane, Washington, USA, Jul. 3–8, 2011.
10. Panduro, M. A., C. A. Brizuela, and D. H. Covarrubias, “Design of electronically steerable linear arrays with evolutionary algorithms,”Appl. Soft. Comput., Vol. 8, No. 1, 46–54, Jan. 2008. 11. Mart´ınez-de-Rioja, E., J. A. Encinar, A. Pino, B. Gonz´alez-Vald´es, S. V. Hum, and C. Tienda,
“Bifocal design procedure for dual reflectarray antennas in offset configurations,”IEEE Antennas Wireless Propag. Lett., Vol. 17, No. 8, 1421–1425, Aug. 2018.
12. Rengarajan, S. R., “Reflectarrays of rectangular microstrip patches for dual-polarization dual-beam radar interferometers,”Progress In Electromagnetics Research, Vol. 133, 1–15, 2013.
13. Tienda, C., M. Younis, P. L´opez-Dekker, and P. Laskowski, “Ka-band reflectarray antenna system for SAR applications,” The 8th European Conference on Antennas and Propagation (EUCAP), 1603–1606, The Hague, The Netherlands, Apr. 6–11, 2014.
14. Patyuchenko, A., C. Tienda, M. Younis, S. Bertl, P. L´opez-Dekker, and G. Krieger, “Concept of a multi-beam reflectarray digital-beam forming synthetic aperture radar,” IEEE International
Symposium on Phased Array Systems and Technology, 346–351, Waltham, Massachusetts, USA,
Oct. 15–18, 2013.
15. Encinar, J. A., M. Arrebola, L. F. de la Fuente, and G. Toso, “A transmit-receive reflectarray antenna for direct broadcast satellite applications,”IEEE Trans. Antennas Propag., Vol. 59, No. 9, 3255–3264, Sep. 2011.
16. Zornoza, J. A. and M. E. Bialkowski, “Australia and New Zealand satellite coverage using a microstrip patch reflectarray,” Microw. Opt. Technol. Lett., Vol. 37, No. 5, 321–325, Jun. 2003. 17. Legay, H., D. Bresciani, E. Labiole, R. Chiniard, and R. Gillard, “A multi facets composite panel
reflectarray antenna for a space contoured beam antenna in Ku band,”Progress In Electromagnetics Research B, Vol. 54, 1–26, Aug. 2013.
18. Cooley, J. W. and J. W. Tukey, “An algorithm for the machine calculation of complex Fourier series,”Math. Comp., Vol. 19, No. 90, 297–301, Apr. 1965.
19. Huang, J. and J. A. Encinar,Reflectarray Antennas, John Wiley & Sons, Hoboken, NJ, USA, 2008. 20. Prado, D. R., M. Arrebola, M. R. Pino, and F. Las-Heras, “An efficient calculation of the far field radiated by non-uniformly sampled planar fields complying Nyquist theorem,” IEEE Trans. Antennas Propag., Vol. 63, No. 2, 862–865, Feb. 2015.
21. Prado, D. R., M. Arrebola, M. R. Pino, F. Las-Heras, and J. A. Encinar, “Efficient computation of the reflectarray far fields in adaptive grids for speed improvement,”IEEE International Symposium on Antennas and Propagation (APSURSI), 1181–1182, San Diego, California, USA, Jul. 9–14, 2017. 22. Lee, J.-Y. and L. Greengard, “The type 3 nonuniform FFT and its applications,”J. Comput. Phys.,
Vol. 206, No. 1, 1–5, Jun. 2005.
23. Bucci, O. M. and M. D. Migliore, “A novel Non Uniform Fast Fourier Transform algorithm and its application to aperiodic arrays,”IEEE Antennas Wireless Propag. Lett., 1472–1475, 2017.
24. Dutt, A., “Fast Fourier transforms for nonequispaced data,” Ph.D. dissertation, Yale University, Aug. 1993.
25. Greengard, L. and J.-Y. Lee, “Accelerating the nonuniform fast fourier transform,” SIAM Rev., Vol. 46, No. 3, 443–454, Jul. 2004.
26. Fessler, J. A. and B. P. Sutton, “Nonuniform fast Fourier transforms using min-max interpolation,”
IEEE Trans. Signal Process., Vol. 51, No. 2, 560–574, Feb. 2003.
27. Liu, Q. H. and N. Nguyen, “An accurate algorithm for nonuniform fast Fourier transforms (NUFFT’s),” IEEE Microw. Guided Wave Lett., Vol. 8, No. 1, 18–20, Jan. 1998.
28. Dutt, A. and V. Rokhlin, “Fast fourier transforms for nonequispaced data,”SIAM J. Sci. Comput., Vol. 14, No. 6, 1368–1393, Nov. 1993.
![Figure 1 shows a general case in which both domains, physical and spectral, are non-uniform, in this workwe will focus on periodic reflectarrays with a non-uniform spectral grid, since the aperiodic reflectarraycase is studied elsewhere [1, 20].](https://thumb-us.123doks.com/thumbv2/123dok_us/1914573.1251060/3.612.171.448.192.389/figure-physical-spectral-periodic-reectarrays-spectral-aperiodic-reectarraycase.webp)