R E S E A R C H
Open Access
Reproducible LTE uplink performance analysis
using precomputed interference signals
Volker Pauli, Muhammad Danish Nisar
*and Eiko Seidel
Abstract
The consideration of realistic uplink inter-cell interference is essential for the overall performance testing of future cellular systems, and in particular for the evaluation of theradio resource management(RRM) algorithms. Most beyond-3G communication systems employ orthogonal multiple access in uplink (SC-FDMA in LTE and OFDMA in WiMAX), and additionally rely on frequency-selective RRM (scheduling) algorithms. This makes the task of accurate modeling of uplink interference both crucial and non-trivial. Traditional methods for its modeling (e.g., via additive white Gaussian noise interference sources) are therefore proving to be ineffective to realistically model the uplink interference in the next generation cellular systems.
In this article, we propose the use of realistic precomputed interference patterns for LTE uplink performance analysis and testing. The interference patterns are generated via an LTE system-level simulator for a given set of scenario parameters, such as cell configuration, user configurations, and traffic models. The generated interference patterns (some of which are made publicly available) can be employed to benchmark the performance of any LTE uplink system in both lab simulations and field trials for practical deployments. It is worth mentioning that the proposed approach can also be extended to other cellular communication systems employing OFDMA-like multiple access with frequency-selective RRM techniques.
The proposed approach offers twofold advantages. First, it allows for repeatability and reproducibility of the performance analysis. This is of crucial significance not only for researchers and developers to analyze the behavior and performance of their systems, but also for the network operators to compare the performance of competing system vendors. Second, the proposed testing mechanism evades the need for deployment of multiple cells (with multiple active users in each) to achieve realistic field trials, thereby resulting in significant cost (and time) savings in the field trails.
1 Introduction
A crucial phase, before the successful deployment of a technology is its testing and validation under realistic operating conditions. To this end, tests are typically designed and conducted in lab as well as in actual deployment scenarios. Tests conducted in a lab environ-ment allow for a quick and cost-efficient evaluation of various algorithms and techniques. However, it is hard to mimic the real-life environment in a lab. On the other hand, tests conducted on actual deployment scenarios– often referred to as field trials–allow for an exact emula-tion of real-life scenarios, in which a system is expected to operate. On the downside, field trials are generally time consuming and expensive.
In terms of the mode of evaluation, the testing mechan-isms can be grouped into two categories, namely, confor-mance and perforconfor-mance testings. Conforconfor-mance testing refers to a sequence of pass/fail tests laid down typically by the standardization body itself, to certify the developed products being compliant or non-compliant with the various modes of operation in the given standard [1,2].
Performance testing–often referred to as‘beyond con-formance testing’[3]–is an extension of conformance testing to a more sophisticated quantitative evaluation of commercial products. This allows network operators to compare different products from different vendors against each other. Although, the purpose of all the test-ing methodologies is different, all share some common desirable features.
* Correspondence: [email protected]
Eiko Seidel Nomor Research GmbH, Munich, Germany
•Realistic: The environment used for testing should mimic the actual network deployments as closely as possible. This is of significance for the relevance of both conformance and especially performance test results. In terms of closeness to reality, field tests enjoy an edge over lab testing where the real-life conditions are only artificially modeled.
•Reproducible: It is highly desirous of all the testing methodologies to be reproducible. This allows for repeatability of tests at a later time, and also to com-pare the performance of various competing techni-ques over an exact same set of conditions. While lab tests can be made reproducible, field trials, in part, suffer from non-reproducibility because of the ran-domness effects that are inherent in the environment.
•Time and cost efficient: All the testing methodolo-gies are required to be time efficient and of low cost, but this often conflicts with the requirement of being realistic. For instance, field testing, while offering the most realistic test environment, has the drawback of being most expensive and time consuming.
In this article, we propose a novel testing mechanism that combines the desirable features of being realistic and reproducible, besides being time and cost efficient. The proposed mechanism can be effectively applied to lab test-ing as well as field trials, and not only for conformance testing, but also more importantly perhaps for the perfor-mance testing. The approach can be used by developers (vendors) to debug and benchmark the performance of their alternative algorithms, and also by network operators in arriving at better technically informed decisions about the selection from multiple vendors.
Although the proposed testing mechanism is generic and applicable to a broad set of scenarios and standards, in this article, we discuss it in the context of LTE uplink inter-cell interference modeling. Inter-cell interference is a major bottleneck in the performance of current and future cellu-lar systems, which are gradually pushing toward diminish-ing frequency reuse factors and dense deployments. In LTE, the consideration of realistic uplink cell inter-ference is essential for testing radio resource management (RRM) algorithms as well as for overall performance test-ing. Traditional methods for interference modeling (e.g., viaadditive white Gaussian noise(AWGN) interference sources) are no longer able to realistically model the uplink interference, especially in the orthogonal uplink scenarios employing frequency-selective RRM algorithms as in the SC-FDMA-based multiple access in LTE uplink [4,5].
We employ a reconfigurable system-level LTE simula-tor to model the typical deployment scenarios outlined in the 3GPP specifications and implementation guide-lines [6,7]. Depending on the various system parameters, the behavior of uplink inter-cell interference from
neighboring cells is recorded in trace files, and a post-processing of these simulator trace files leads to realistic time-domain uplink interference signals for the given system settings. These precomputed uplink interference signals can be employed in a variety of ways.
•Simulations: System-level simulators with only iso-lated cell capabilities can benefit from the generated interference signals by adding to it the interference-free uplink-received signal, thereby effectively model-ing a multi-cellular scenario.
•Lab testing: In lab testing environments, it has been quite difficult (if not impossible) to accurately model a multi-cellular deployment. The precom-puted interference signals offer the possibility to rea-listically model the uplink interference, and thus provide a more realistic test environment for LTE uplink, even in a lab.
•Field testing: Deploying a multi-cellular system, with multiple users active in each cell, is an expen-sive, non-flexible exercise. The precomputed interfer-ence signals, in combination with commercially available vector signal generators (VSGs), can be used to effectively create a virtual multi-cell interference environment without the need of actually deploying multiple cells (see the illustration in Figure 1). In addition, the proposed approach offers the advantage of reproducible interference signals which can be used to compare the performance of competing algo-rithms or products in field trials.
The remainder of this article is organized as follows: Section 2 describes the system-level simulator employed to obtain the interference power patterns. In Section 3, the approach used for converting these into time-domain interference signal is presented. Section 4 presents the details of scenarios used for the generation of the publicly available LTE uplink interference signal files. Section 5 contains some simulation results to illustrate the impor-tance of using realistic interference modeling for LTE uplink performance analysis. Section 6 outlines the usage of the proposed interference patterns, and Section 7 con-cludes this article.
2 System-level simulator for LTE networks
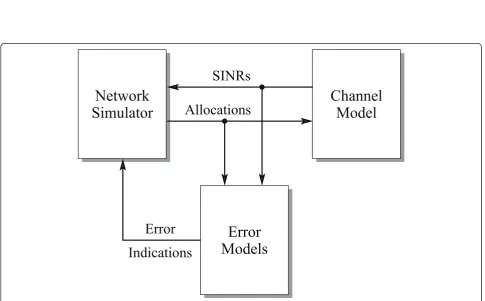
Figure 2 illustrates the structure of the system-level simulator employed in this study. Apart from a graphi-cal user interface that is not shown here, it consists of three major entities: the network simulator itself, a channel model block, and a block for modeling the link-level transmission errors.
(a) Traditional approach: deploying multiple cells with active users in each cell.
(b) Proposed approach: employing pre-computed interference patterns to virtually create a multi–cell interference environment.
Figure 1Illustration of cost/complexity/time savings of the proposed approach to uplink performance analysis.(a)Traditional approach: deploying multiple cells with active users in each cell.(b)Proposed approach: employing pre-computed interference patterns to virtually create a multi-cell interference environment.
Allocations
SINRs
Error
Indications
Network
Simulator
Error
Models
Channel
Model
sources and protocol stacks of different network elements. With regard to this study, the simulator mod-els the traffic sources at each user equipment (UE), ensures that appropriate time and frequency resources are assigned to them via realistic scheduling algorithms at eachenhanced-nodeB (eNB) and takes into account the realistic availability of information, e.g., regarding channel state, buffer status, etc.
The network simulator sends information about the scheduled uplink and downlink transmissions of different cells simulated to the channel model block. The latter uses these to computesignal-to-interference and noise ratios(SINR) for the different links between base stations and UEs, taking into account the geographical informa-tion about the network, path-loss, shadowing, fast fading, inter-cell interference, etc. The SINRs are computed at a resolution of one sample perphysical resource block (PRB) and pertransmission time interval(TTI). These SINRs are passed back to both the network simulator and the error models. The network simulator uses them to, e.g., computechannel quality indicatorinformation at the UEs, or extract uplink channel state information at the base station based on some configured channel sounding mode or simply in-band pilots.
The error models’blockaaccepts the SINRs computed by the channel model at PRB resolution and the alloca-tion informaalloca-tion sent out by the network simulator. Using the so-called mutual information effective SINR metric method [8], it computes effective SINRs for each active transmission link in the whole network. The effec-tive SINR is then used in conjunction with the precom-puted link-level results for the AWGN channel to determine the error indications for the individual trans-missions. This efficient link-to-system level modeling [9] allows us to bypass the actual link-level processing such as channel en-/decoding, (de-)modulation, layer (de-) mapping, precoding, and equalization, with minimal complexity during system-level simulations.
3 Post-processing of simulator output
The system-level simulator as a whole has the capability to write various quantities that appear in the simulation to trace files for offline evaluation. This ranges from
throughput or delay atpacket data convergence protocol (PDCP) layer, down to uplink and downlink SINRs at PRB resolution, and in particular–as used in this study– the aggregated uplink inter-cell interference power as received by the base station at the center of the simulated network. The aggregated uplink interference power com-puted by taking into account the geographical informa-tion about the network, path-loss, shadowing, fast fading, antenna gains, etc., is stored at a resolution of one sample per PRB along the frequency direction, and per TTI along the time direction.
It shall be noted here that the system-level simulator, used for the generation of the uplink interference power trace, does not make any assumptions on the synchron-ism between interfering users. Thus, the interference powers and the resulting aggregate time-domain interfer-ence signal represent a scenario where the interfering signals arrive from different users with arbitrary (non-identical) delays, as in a real-life deployment.
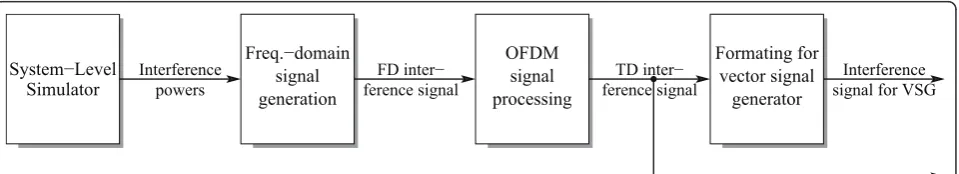
We post-process the trace files associated with the uplink interference power to generate realistic interfer-ence signals in time domain. The process is depicted by the flow chart in Figure 3. In the first step, the interfer-ence trace file containing the uplink interferinterfer-ence powers is used to generate a random frequency-domain DFT-Spread-OFDM signal [10,11] with the appropriate power levels for each PRB over each TTI. This is achieved by increasing the resolution of the interference power from per PRB to per sub-carrier via interpolation. Then, either a Gaussian random signal or a random DFT-Spread-OFDM LTE uplink signal, of length corresponding to one TTI, is generated for each sub-carrier with the given power level. The process is repeated for each TTI.
In the second step, the frequency-domain signal is transformed to the time-domain signal using the typical OFDM processing. This involves carrying out an IFFT of the samples across the various sub-carriers of an OFDM block, and then inserting a cyclic prefix of appropriate duration. The signal is then parallel-to-serial converted for each OFDM block, leading finally to the realistic time-domain uplink interference signal which would be experienced by an uplink receiver in a multi-cell deploy-ment with the given system settings.
Interference powers
FD inter− ference signal
TD inter− ference signal
Interference signal for VSG
System−Level Simulator
Freq.−domain signal generation
OFDM signal processing
Formating for vector signal
generator
As a last step, the interference signal may additionally be transformed into the proprietary formats of the com-monly available commercial VSGs, as explained in Sec-tion 6. To accurately model the uplink interference, the resulting VSG signal is supposed to be coupled into the path between the antenna and the receiver (e.g., MRC) with prescribed power settings.
4 Interference scenarios under consideration
For the generation of the different uplink interference patterns, we considered a homogeneous LTE uplink deployment with multiple cells. The parameters for sys-tem layout and simulation scenarios have been adopted from [[6], Appendix A]. These are, however, mostly
identical to those found in other 3GPP specifications like [7], and in the NGMN evaluation scenarios [12]. Although many more system configurations are concei-vable, the adopted parameters have been defined as being representative of future LTE networks by the industry and are being widely used in research and standardization.
4.1 Cell layout
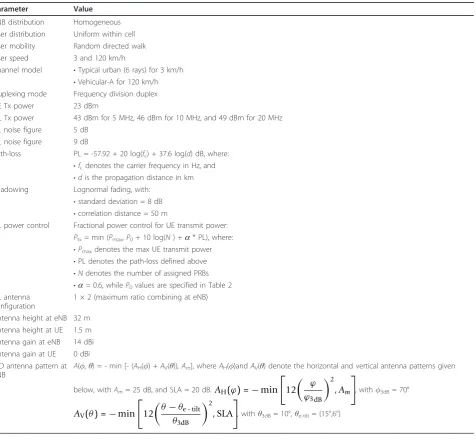
Table 1 lists the main parameters affiliated with the eNB, the UE, and those that characterize the cell layout and system configuration. As mentioned above, the parameters are based on the 3GPP prescribed system deployments as outlined in [[6], Appendix A].
Table 1 System configuration parameters
Parameter Value
eNB distribution Homogeneous User distribution Uniform within cell User mobility Random directed walk User speed 3 and 120 km/h
Channel model •Typical urban (6 rays) for 3 km/h
•Vehicular-A for 120 km/h Duplexing mode Frequency division duplex UE Tx power 23 dBm
DL Tx power 43 dBm for 5 MHz, 46 dBm for 10 MHz, and 49 dBm for 20 MHz UL noise figure 5 dB
DL noise figure 9 dB
Path-loss PL = -57.92 + 20 log(fc) + 37.6 log(d) dB, where: •fcdenotes the carrier frequency in Hz, and •dis the propagation distance in km Shadowing Lognormal fading, with:
•standard deviation = 8 dB
•correlation distance = 50 m
UL power control Fractional power control for UE transmit power: Ptx= min (Pmax,P0+ 10 log(N) +a* PL), where: •Pmaxdenotes the max UE transmit power •PL denotes the path-loss defined above
•Ndenotes the number of assigned PRBs
•a= 0.6, whileP0values are specified in Table 2
UL antenna configuration
1 × 2 (maximum ratio combining at eNB)
Antenna height at eNB 32 m Antenna height at UE 1.5 m Antenna gain at eNB 14 dBi Antenna gain at UE 0 dBi 3-D antenna pattern at eNB
A(,θ) =-min [- (AH() +AV(θ)), Am], whereAH()andAV(θ) denote the horizontal and vertical antenna patterns given
below, withAm= 25 dB, and SLA = 20 dB.AH(ϕ) =−min
12
ϕ
ϕ3dB
2
,Am
, with3dB= 70°
AV(θ) =−min
12
θ −θ
e - tilt
θ3dB
2
, SLA
4.2 Traffic types
For the simulation results in this article, we consider two fundamentally different traffic models for the uplink user traffic. As will be shown later, these have a profound impact on the characteristics of the resulting interference patterns.
•Full buffer traffic
- Full transmit buffers.
- Scheduling: In time domain, all the active UEs are scheduled in each TTI. In frequency domain, proportional fair scheduling [[11], Chapter 7] with periodic wideband channel sounding is employed, with 5 PRBs per UE per TTI.
- Number of UEs inradio resource control (RRC)-connected state depends upon the configured cell load and the system bandwidth. For instance, 70% load in a 10-MHz system (with 50 PRBs) is obtained via seven active UEs each being assigned five PRBs in every TTI.
•VoIP traffic
- VoIP calls, 14 kbps, real-time transport protocol.
- Scheduling: In order to avoid limitations from the associated control signaling, we aggregate a minimum of two VoIP packets for each UE before it is eligible for scheduling. In time domain, a round robin scheduler is employed, which lets a maximum of 10 UEs to be assigned resources by the frequency-domain scheduler in the current TTI, with preference being given to UEs with retransmissions. In frequency domain, propor-tional fair scheduling with adaptive transmission bandwidth (e.g., [13]) is employed for the 10 UEs assigned in each TTI.
- Number of UEs in RRC-connected state depends upon the configured cell load and the system bandwidth. The maximum number of supportable VoIP calls is determined empirically for each sce-nario. A VoIP user is in outage if more than 2% of its packets in a 8-s call cannot be correctly received within 80 ms. The system capacity is defined as the maximum load in which more than 95% of the users are not in outage (see, for instance, [[14], Appendix A.2]). Lower cell loads, such as 30 and 70%, correspond, respectively, to 30 and 70% of the maximum number of supportable UEs.
4.4 Selected scenarios
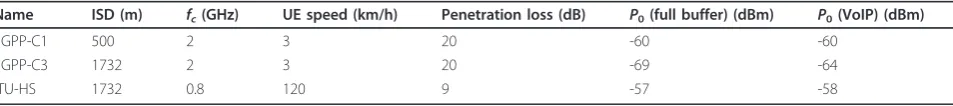
Based on the reference system deployments recom-mended in [[6], Appendix A], three system layouts are selected for the generation of LTE uplink interference signals. These scenarios, along with their associated parameters, are specified in Table 2, where fc denotes the carrier frequency, andP0is the power control
para-meter, as introduced in Table 1. Each of the three inter-ference scenarios defined in the table is configured with
•one of the two traffic types (full buffer and VoIP),
•a prescribed load level (30 and 70% for 3GPP-C1 and ITU-HS, while 70 and 100% for 3GPP-C3), and
•one of the three system bandwidths (5, 10, and 20 MHz).
Thus, in total, there are 36 uplink interference scenarios with different parameter combinations. These selected interference scenarios are partitioned intostandardand extendeduplink interference packages. The standard pack-age consisting of 3GPP-C1 with 70% load is publicly avail-able free of charge under a temporary evaluation license that can be obtained via [15].
5 Simulation results
5.1 Snapshots of interference patterns
In this sub-section, we discuss the nature and character-istics of LTE uplink interference via two sample interfer-ence snapshots below.
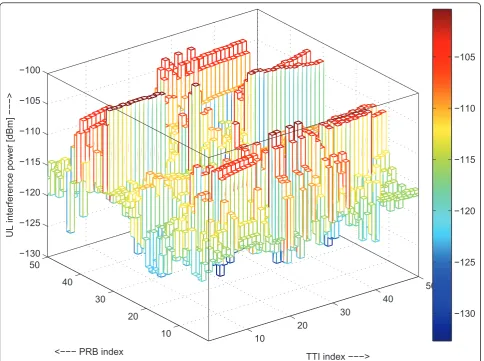
5.1.1 Full buffer scenario
Figure 4 shows a sample interference snapshot for the 3GPP-C1 scenario with full buffer traffic, at a 70% load level, for a 10-MHz system. The snapshot shows interfer-ence power at TTI and PRB resolution, for a time interval of 50 ms (50 TTI) and across the whole 10-MHz band-width (50 PRBs).
For the full buffer traffic, there is a limited number of high-rate users (seven active users in this scenario) config-ured in each cell. Since the configconfig-ured cell load is 70% for all the cells in the scenario, it can happen by chance that no user in the direct neighboring cells is scheduled on a particular PRB, leading to a very low interference level on that PRB. On the other hand, a high interference power is experienced on PRBs, where a neighboring cell schedules a UE which is close to the cell edge of the cell of interest. Thus, we observe strong variations in the cell inter-ference power across PRBs. The interinter-ference is dominated
Table 2 Interference scenarios under consideration
Name ISD (m) fc(GHz) UE speed (km/h) Penetration loss (dB) P0(full buffer) (dBm) P0(VoIP) (dBm)
3GPP-C1 500 2 3 20 -60 -60
3GPP-C3 1732 2 3 20 -69 -64
by few interferers or even a single interferer located at the cell edge of the cell under consideration.
Although different users might be scheduled on a parti-cular PRB from one TTI to the next, causing strong interference variations along time as well, users might also continuously be scheduled on the same PRBs for consecutive TTIs. If the latter happens, for a dominating interferer, then we observe a slowly changing interference power level along TTIs, caused only by the user mobility and fast fading.
Overall, it can easily be observed that the cell inter-ference power is far from being flat over time and fre-quency, and therefore a precise modeling of uplink interference has a significant impact on the evaluation of system performance.
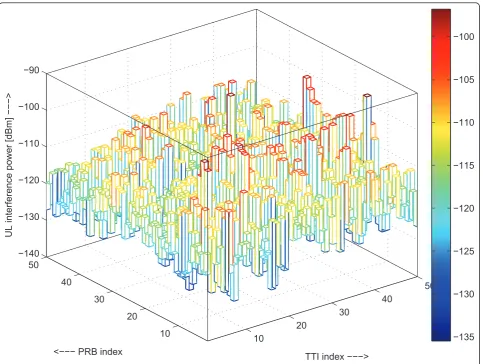
5.1.2 VoIP scenario
Figure 5 shows a similar interference snapshot for the same scenario except that the user traffic is VoIP instead of full buffer traffic. Because the characteristics of the traffic are fundamentally different from those in
the previous scenario, so is the scheduling behavior. For example, UEs only periodically have small amounts of data to transmit. Hence, consecutive allocations of PRBs to the same UE over several consecutive TTIs occur only very rarely. Second, for efficient scheduling of VoIP traffic obeying constraints from availability of downlink control signaling resources, it is typical to use packet aggregation (e.g., [16]), i.e., to accumulate data of a user over, e.g., 40 ms and assign larger numbers of PRBs simultaneously, but less frequently. In consequence, the uplink interference in Figure 5 exhibits very strong fluc-tuations from one TTI to the next; however, it shows some correlation in the frequency direction.
Thus, we note that the VoIP and full buffer traffic sce-nario possess quite different characteristics for the inter-ference pattern and its variations across time and frequency. A precise modeling of uplink interference is therefore crucially needed for an accurate and a reliable performance analysis of cellular systems. This aspect is further highlighted in the next sub-section.
10
20
30
40
50
10 20 30 40 50
−130
−125
−120
−115
−110
−105
−100
TTI index −−−> <−−− PRB index
UL inter
ference power [dBm]
−−−
>
−130
−125
−120
−115
−110
−105
5.2 Performance comparison between proposed and AWGN interference modeling
In this sub-section, we study the effect of the proposed and the AWGN-based interference modeling approaches on the system-level performance of an LTE uplink sys-tem. To this end, we perform two simulation runs:
•First, we run the simulator with the proposed rea-listic uplink interference modeling, and measure some relevant performance metrics.
•For the second run, we average (over time and fre-quency) the per-PRB powers of the uplink interfer-ence used in the first run of the simulator, add this average to the per-PRB noise power, and disable the realistic interference. Otherwise, the simulator is configured identically, including the seeds for ran-dom number generators. Hence, the total noise and interference power is the same as before, but in the second run, pure AWGN with constant power across time and frequency is present as the sole source of interference.
In the following, we present the comparison for two different traffic scenarios.
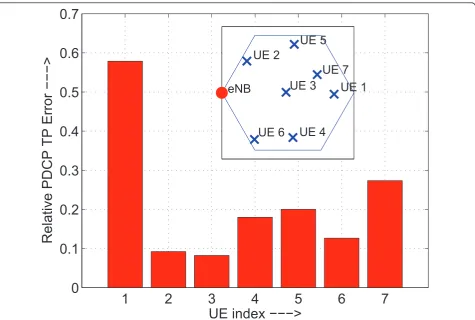
5.2.1 Full buffer scenario
We consider a full buffer traffic scenario with a load of 70% in the 3GPP-C1 scenario, described in Section 4, and measure the average UE throughput taking into account the proposed or the AWGN interference model. Figure 6 shows in terms of throughput, the error made when using AWGN as sole source of interference com-pared to the case of realistic interference. It can be observed that the user throughput is, in general, overesti-mated when simulating with AWGN interference. The actual deviation varies significantly depending on the par-ticular position of the UE, showing smaller deviations for UEs in favorable positions and deviations as large as 58% for cell-edge UEs. The reason is that the fluctuations of realistic interference force the scheduler to select the modulation and coding scheme more conservatively to meet the required target of reliability (herein assumed to be 10% error probability after the first HARQ transmis-sion). At higher error rate targets, this is less critical, and
10
20
30
40
50
10 20 30 40 50
−140
−130
−120
−110
−100
−90
TTI index −−−> <−−− PRB index
UL inter
ference power [dBm]
−−−
>
−135
−130
−125
−120
−115
−110
−105
−100
a channel-aware scheduler can even benefit from the at times slowly changing interference levels (cf. Figure 4), and can therefore make more qualified scheduling deci-sions leading to a higher throughput. From the illustra-tion of the UE posiillustra-tions as shown in Figure 6, it can be observed that there is a relation between distance from the eNB and the relative throughput error. It is worth mentioning though that this dependence of the relative error on the distance from the eNB becomes less evident, once shadowing (not considered here) comes into play. 5.2.2 VoIP scenario
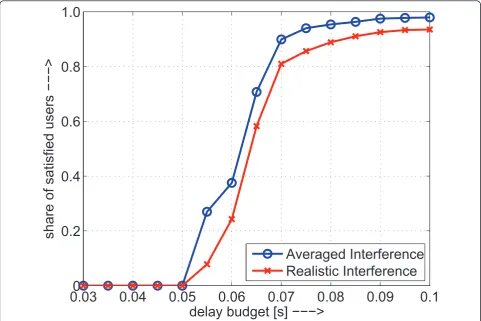
In this context, we evaluate the system performance for a VoIP scenario in a manner similar to the one described above, i.e., first with a realistic cell inter-ference and then with AWGN noise of equal average power. Figure 7 shows the performance in terms of the fraction of the satisfied UEs for the two simulation runs. A VoIP UE is said to be satisfied, if it is not in outage that is defined as the state in which more than 2% of its packets in a 8-s call cannot be correctly received within 80 ms [[14], Appendix A.2].
We observe in Figure 7 that the performance with averaged interference modeling is too optimistic as
compared to the performance with realistic interference modeling. This is primarily the result of the extreme fluctuations of interference powers across TTIs that can potentially lead to an increased PDCP delay due to more conservative TFC selections and/or higher percen-tage of retransmissions.
In a nutshell, comparing the findings from the results presented in Figures 6 and 7, we conclude that there are significant performance deviations once we switch to realistic inter-cell interference modeling, with a ten-dency to overestimation when replacing realistic inter-ference with simplified AWGN interinter-ference of the same power. Furthermore, the dependence of the performance deviations on scenarios under consideration, traffic types, and UE locations, makes it clear that there is no simple rule of thumb to draw conclusions from the results obtained via simplified interference modeling to real system performance.
6 Usage of interference patterns
As depicted in Figure 3, the interference signal that we generate can be used primarily in two different ways. First, the generic interference signal (lower output in
1
2
3
4
5
6
7
0
0.1
0.2
0.3
0.4
0.5
0.6
0.7
UE index −−−>
Relative PD
C
P TP Error
−−−
>
eNB
UE 7
UE 5
UE 2
UE 3
UE 1
UE 6
UE 4
Figure 3) can directly be used by single-cell simulators for the performance evaluations of various alternative algorithms in a multi-cellular environment. This could be useful for researchers and developers of algorithms to investigate, at an early stage, and/or with relatively small budget, the performance of their algorithms in a realistic multi-cellular environment. Furthermore, as dis-cussed earlier, the precomputed interference files offer the feature of reproducibility. Thus, the tests are com-pletely repeatable and hence useful for debugging as well as benchmarking purposes.
Second, the signal can be transformed into proprietary formats of commercially available signal generators (upper output in Figure 3). Until now, we have collabo-rated with Agilent Technologies and Rohde & Schwarz to generate files that are suitable for playback on their commercially available VSGs. We have described the relatively straight-forward playback procedures for the Agilent and R&S VSGs in the respective user manuals [17,18]. Using the signal generators, the generated inter-ference signals can be fed directly into antenna ports of the bases station under test, to effectively emulate a multi-cellular interference environment in the lab or in the field trials (cf. Figure 1). Thus, the proposed
mechanism adds the feature of realistic multi-cellular environment emulation to lab and field testings in a cost- and time-efficient manner. The additional feature of reproducibility implies that the tests are completely repeatable, and can be effectively used by network operators to make technically informed decisions and selections between the products of competing vendors using their own performance criteria.
The need for realistic and repeatable performance tests for LTE was felt by theGlobal Certification Forum which required 3GPP to consider the standardization of realistic end-to-end data performance measurement tests, where the measurement procedures are capable of running underrepeatableset of conditions [19]. In com-pliance of this, the 3GPP technical sub-group, responsi-ble for conformance testing, is currently discussing the terms of reference and a study item, as part of the 3GPP Release 11 specification about UE application layer data throughput performance, was recently agreed in a 3GPP RAN plenary meeting [20]. The proposed testing mechanism is therefore a valued and timely con-tribution to the entire LTE community. While some of the interference files associated with the standard sce-narios, as described in Section 4, are publicly available
0.03
0
0.04
0.05
0.06
0.07
0.08
0.09
0.1
0.2
0.4
0.6
0.8
1.0
delay budget [s] −−−>
share o
f satis
fied users
−−−
>
Averaged Interference
Realistic Interference
free of charge [15], we have been in collaboration with leading infrastructure vendors who are using the pro-posed inter-cell interference modeling mechanism in their global LTE field trial activities.
7 Conclusions
In this article, we propose a cost- and time-efficient mechanism to realistically model uplink cell inter-ference for an LTE-like orthogonal multiple access and frequency-selective RRM-based cellular system. The pro-posed approach offers the advantage of reproducibility and repeatability of lab tests and field trials. Thus, it is beneficial for researchers and developers to benchmark the performance of their algorithms over arealisticand reproducible set of conditions. Furthermore, the pro-posed testing methodology provides network operators an opportunity to make technically informed decisions about the selection of products from their competing system vendors.
Endnote a
There is one error model for each link between a UE and the respective serving base station.
Abbreviations
AWGN: additive white Gaussian noise; eNB: enhanced-nodeB; PDCP: packet data convergence protocol; PRB: physical resource block; RRC: radio resource control; RRM: radio resource management; SINR: signal to interference and noise ratio; TTI: transmission time interval; UE: user equipment.
Competing interests
The authors declare that they have no competing interests.
Received: 28 January 2011 Accepted: 18 September 2011 Published: 18 September 2011
References
1. 3GPP TS 36.141 (2010-08), Evolved Universal Terrestrial Radio Access (E-UTRA); Base Station (BS) Conformance Testing, (Release 10), inTechnical Specification Group Radio Access Network(2010)
2. 3GPP TS 36.521 (2010-08), Evolved Universal Terrestrial Radio Access (E-UTRA); User Equipment (UE) Conformance Specification, Radio Transmission and Reception, Part 1: Conformance Testing, (Release 9), inTechnical Specification Group Radio Access Network(2010)
3. Electrobit, Beyond Conformance Testing in 3GPP LTE. (June 2009) White paper
4. R4-093766 3GPP Tdoc, Analysis of non-Gaussian Inter-Cell Interference Impact on Performance, Agilent Technologies and Nomor Research GmbH, in3GPP TSG-RAN WG4 #52bis meeting, Japan(October 2009)
5. R4-103235 3GPP Tdoc, LTE Receiver Performance using AMC with Realistic Noise, Agilent Technologies and Nomor Research GmbH, in3GPP TSG-RAN WG4 #56 meeting, Japan(August 2010)
6. 3GPP TR 36.814 V9.0.0 (2010-03), Technical Specification Group Radio Access Network; Evolved Universal Terrestrial Radio Access (E-UTRA); Further advancements for E-UTRA physical layer aspects, (Release 9), inTechnical Report 3GPP(2010)
7. 3GPP TR 25.814 V7.1.0 (2009-06), Technical Specification Group Radio Access Network; Physical Layer Aspects for Evolved Universal Terrestrial Radio Access (UTRA), (Release 7), inTechnical Report 3GPP(2009)
8. K Brüninghaus, D Astély, T Sälzer, S Visuri, Link Performance Models for System Level Simulations of Broadband Radio Acces Systems, inPIMRC, Berlin, Germany(September 2005)
9. V Pauli, I Viering, C Buchner, E Saad, G Liebl, A Klein, Efficient Link-to-System level Modeling for Accurate Simulations of MIMO-OFDM Systems, in International Conference on Communications, Dresden(June 2009) 10. D Galda, H Rohling, A Low Complexity Transmitter Structure for
OFDM-FDMA Uplink Systems, inIEEE Vehicular Technology Conference, pp. 1737–1741 (2002)
11. E Dahlman, in3G evolution: HSPA and LTE for mobile broadband, (Academic Press, 2008)
12. NGMN White Paper, NGMN Radio Access Performance Evaluation Methodology. http://www.ngmn.org (2008)
13. FD Calabrese, inScheduling and Link Adaptation for Uplink SC-FDMA Systems: A LTE Case Study, Dissertation, Aalborg University, Denmark(April 2009) 14. S4 (10)0858 3GPP Tdoc, Source-Controlled Variable Bit Rate Operation in
EVS, Qualcomm Incorporated, AT&T, in3GPP TSG-SA4 #61 meeting (November 2010)
15. Nomor Research GmbH, Contact Form for LTE Uplink Interference Files. http://www.nomor.de/lte-ul-if (2011)
16. H Holma, J Kallio, M Kuusela, P Lundn, E Malkamki, J Ojala, H Wang, Voice over IP (VoIP), inLTE for UMTS: OFDMA and SC-FDMA Based Radio Access, ed. by Holma H, Toskala A (John Wiley & Sons, Ltd, Chichester, UK, 2009) 17. Nomor Research GmbH and Agilent Technologies, LTE Uplink Interference
Generation. (2011) User manual
18. Nomor Research GmbH and Rohde & Schwarz, LTE Uplink Interference Generation. (2011) User manual
19. Tdoc S-10-103 Global Certification Forum, Creation of an End to End Data Performance Measurement Procedure, inGCF Steering Group, #43 meeting, Germany(June 2010)
20. RP-101422 3GPP Tdoc, Study item proposal: UE Application Layer Data Throughput Performance, in3GPP TSG-RAN #50 meeting, Turkey (December 2010)
doi:10.1186/1687-6180-2011-61
Cite this article as:Pauliet al.:Reproducible LTE uplink performance analysis using precomputed interference signals.EURASIP Journal on Advances in Signal Processing20112011:61.
Submit your manuscript to a
journal and benefi t from:
7Convenient online submission
7Rigorous peer review
7Immediate publication on acceptance
7Open access: articles freely available online
7High visibility within the fi eld
7Retaining the copyright to your article