A DIRECT METHOD FOR DETERMINING FLOOR RESPONSE
SPECTRA AT THE ITER TOKAMAK COMPLEX
Javier Ezeberry1and Didier Combescure2
1Technical Director, Nuclear Services, Idom, Madrid, Spain.
2Technical Officer, Fusion for Energy (F4E) - European Commission, Barcelona, Spain.
ABSTRACT
A suitable methodology to find the seismic floor response spectra (FRS) at a particular location of a structural system by a direct spectra-to-spectra method is presented in this work. This methodology was developed to obtain FRS inside the ITER Tokamak Complex building and the mechanical devices located in the building, as the Fusion Reactor Machine. Based on the well-established tools developed over the last decades in random vibration theory, the methodology developed totally in the frequency domain, has three main steps: First, the generation of a free-field acceleration PSD functions compatible with the Design Response Spectra; Second, the generation of the absolute acceleration PSD function at the locations of interest within the structure; Third, the determination of the FRS. To demonstrate the feasibility of the method, the FRS obtained at a different points of the Tokamak Complex are compared with the FRS obtained by means of the classical methods, based on time-histories of absolute acceleration obtained in time-domain. The comparison reveals a great accuracy of the proposed method.
INTRODUCTION
The design of in-structure components in NPP requires the determination of the seismic action on those points in which the components are going to be fixed. The usual way to represent the seismic action used in professional practice is by Floor Response Spectra (FRS) (Ali Reza, 2013).
Generally, the traditional way to obtain FRS is by means of a transient analysis, by computing the acceleration response and the response spectrum (Clough, 2003) of the structure in those points of interest. This method can be expensive, especially where a great number of points need to be assessed, as is the case of the ITER project (IAEA). Thus, to overcome this limitation, an alternative methodology based on a direct spectrum-to-spectra method (Gilbert, 1988; Paskalov, 2003) is proposed (Idom, 2010). In general terms, the main concept behind direct spectrum-to-spectra methods is the treatment of the seismic excitation as a stochastic random process (Paskalov, 2003). The seismic excitation can thus be represented, in a statistical sense by a Power Spectral Density (PSD) function. This PSD function defines the variance of the process and its frequency content.
Transfer functions, defining the dynamic behaviour of the structure analysed, are used to obtain the expected absolute acceleration magnitudes at the locations of interest within the structure (Newland, 1993).
The input and the expected output are to be defined in terms of response spectra, according to standard
practice in seismic engineering. The success of the method highly depends on the “peak factor” (Lalane
2002) concept, which is basically the ratio between the response spectrum and the root-mean-square (rms)
value of this response (Gasparini, 1976). The “peak factor” strongly depends on the signal duration and frequency content and plays a crucial role in floor spectra direct calculations (Giaralis and Spanos, 2009 and 2012).
Division III
function compatible with the Design Response Spectra; second, the generation of the absolute
acceleration PSD function at the locations of interest within the structure; and third, the
determination of the FRS.
METHODOLOGY
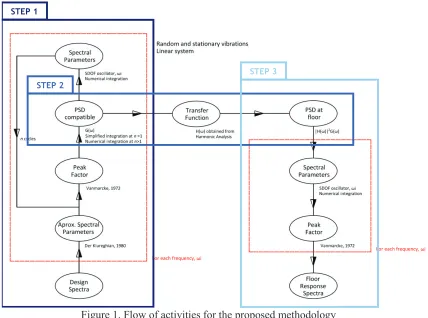
The methodology proposed is schematically shown in Figure 1. First, in Step 1, the relationship between the response spectrum and the standard deviation of the response (acceleration) of a single-degree-of-freedom (SDOF) oscillator subjected to the corresponding ground motion is given by the peak factor, see Eq. (1).
(
)
w = w s× w
; ( ) ; ( ) ,
s p n s p n SDOF n
S r s (1)
In this equation Ss;p(wn) represents the response spectral value (maximum absolute value for the response of a SDOF oscillator of frequency wn, with probability p, during a strong motion of duration s). On the other hand, sSDOF(wn,s) represents the standard deviation for the response of a SDOF oscillator of frequency wn, during a strong motion of duration, s. The reason of the parameter s is due the seismic event is essentially transient in nature (Cacciola, 2010; Ashtari, 2013).
STEP 1
STEP 2
STEP 3
Figure 1. Flow of activities for the proposed methodology
The proposed expression for the computation of the peak factor is given by Vanmarcke (1969 and 1976):
( )
w ={
ëêé -(
-d1.2 p( )
)
ùúû}
; 2ln 2 1 exp ln 2
s p n
Division III
where p is the probability that the absolute value of the response does not exceed a predefined level
during a strong motion of duration, s. For seismic analysis, p is usually set as 0.50. The parameters N and
δ depend on the shape (spectral moments) of the PSD function that describes the response of a SDOF
oscillator, are defined as,
(
)
d w( )
w wp ¥ -= - = - =
ò
2 1 2 1 00 0 2
ln , 1 , 2
n
n SDOF
m m
s
N p m G d
m m m (3)
where mn are the spectral moments of order n of the SDOF system response PSD function. As a general
rule, the peak factor increases for higher number of local peaks and wider broad processes. Thus, both
magnitudes, and specially N, depend on the signal duration. As starting point, an approximate expression
for the parameters N and δ as derived by Der Kiureghian (1980, 1981) (addressed by Cacciola, 2004 and
2012, and Spanos and Giaralis, 2013) from the observation of the response of SDOF oscillator to white noise input, can be used:
(
)
1/2 2 1 2 2 1 2ln , 1 1 arctan
2 n 1 1
s
N w p d x
p x p x
- éê æ ö ùú ç ÷ = - = - -ç ÷ ê - è - ø ú ë û (4)
Second, the relationship between the PSD function of the SDOF system acceleration and the PSD function of the ground motion (which is the actual output of interest in this first step) is given by the transfer function of the SDOF oscillator,
(
)
(
)
2( )
, , H , ,
SDOF n n
G w w s = w w s G w (5)
where H(w,wn,s) is the transfer function and G(w) represents the ground motion PSD function, supposed stationary. Gasparini (1976) proposed to express the time-dependent transfer function as:
(
w w)
=éê(
w -w)
+ x w w ùú-ë û
1 2
2 2 2 2 2 2
, n, n 4 s n
H s (6)
where wn is the natural frequency of the oscillator; b =w/wn, ω is the frequency of the input and xs is a fictitious damping, which tends to x (damping ratio) when s®¥.
(
)
01
1 exp 2 2
s
ns x ns
x x
xw = w
= ®
- - (7)
Third, the variance of the SDOF system response (acceleration) can be obtained by integration (squared) of the PSD function of the SDOF system acceleration,
(
)
(
)
(
)
2( )
2
0 0
, , , H , ,
SDOF n s GSDOF n s d n s G d
s w =
ò
¥ w w w=ò
¥ w w w w (8)Division III
everything else (the variance of the response and the transfer function for the SDOF system) is already known.
In order to compute this integral for each SDOF system, the integration range in the frequency domain is split in two parts:
( )
( )
p w( )
s w w w w w
x
æ ö
» ç - ÷+
è ø
ò
1 44 2 4 431 4 44 2 4 4 43
2
0
UNIT TRANSFER FUNCTION APROXIMATED VALUE
1 4
n
SDOF n G n n G d (9)
The first term in Eq. (9) corresponds to a limited domain around the natural frequency of the SDOF
system, wn, in which the transfer function reaches a peak while the PSD function of the ground motion,
provided it is smooth enough, can be considered to have a constant value, G(wn). On the other hand, the
second term corresponds to the low frequency range, in which the transfer function has a unit value. Since it is the PSD function of the ground motion G(w) what we are interested in, the expressions previously presented can be re-arranged into the following recursive formula that can be gradually solved for a discrete number of frequencies, wn:
( )
2;( )
( )
( )
2 0
;
1
1 4
n
s p n n
s p n n
S
G G d
r
w
w
w w w
w p
w z
æ ö
» çç - ÷÷
æ ö è ø
-ç ÷
è ø
ò
(10)Since the contribution of the term corresponding to the frequency range in which the transfer function has unit value will be negligible for very low frequencies of the SDOF system, the integration scheme starts at the lowest frequency selected (n equal to zero), so that this contribution can then be readily set to zero for
this first calculation frequency, without inducing any relevant errors. As n increases (this is, at any given frequency wn for n greater than zero) this contribution is then gradually accounted for, since the integral domain covers only the low frequency range up to wn.
Unfortunately, the recursive formula (10) expresses the variance of the response of the SDOF depend on
the peak factor rs;p which, in turn, depends on the spectral moments of the PSD function of the SDOF
system response, which is actually what is being solved and, therefore, is not known in advance. Thus, starting from the simplified spectral parameters defined in Eq. (4), an iterative process can be implemented until convergence is reached.
In Step 2, the ground motion PSD function G(w) obtained in Step 1 is to be converted to a PSD function
of the absolute acceleration at the specific location of interest within the structure, GFloor(w).
This conversion is achieved by means of the transfer function that relates, for a given linear system, the input and the output motions. In this work, the linear system is a FE representation of the structure and its foundation, the input motion is the ground motion, and the output motion is the motion at the locations within the structure where the floor response spectra are to be determined. The mathematical expression, for a completely unidirectional case, would be given by:
( )
w =( )
w 2( )
w; , H
Floor i j ij j
G G (11)
where Hijis the Transfer function under base motion along degree of freedom ‘j’, for degree of freedom
‘i’ at the location of interest. To derive the transfer function of complex 3D structures as the Tokamak
Division III
harmonic analyses, based on modal superposition techniques (ANSYS), are required in order to cover the three directions in space.
Step 3 consists in the conversion of the absolute acceleration PSD density function at the location of interest, GFloor;I,j(w), into a consistent floor response spectrum, SFloor;I,j(w), which is the final goal of the work.
In contrast to the context of the first step, the required data is now, theoretically, available beforehand, this is, the absolute acceleration PSD function at the location of interest, the transfer function for a SDOF oscillator, and the peak factor.
Two sub-steps are required: First, the derivation of the PSD function for the response of a SDOF oscillator, with natural frequency w, at the location of interest GFloor;I,j(w). This is simply obtained by using the transfer function of a SDOF oscillator,
(
)
(
)
s2 w =
ò
¥ w w w_ ; , , 0 _ ; , , ,
Floor SDOF i j n s GFloor SDOF i j n s d (12)
It is important to note that, for each location and direction, three different PSD functions of the response of a SDOF oscillator are obtained, each coming from a different direction of the ground motion excitation
(‘j’ index).
Second, the final determination of the floor response spectrum at a given location is carried out. The variance is obtained by direct integration of the floor PSD,
(
)
(
)
s2 w =
ò
¥ w w w_ ; , _ ; ,
0
, , ,
Floor SDOF i j n s GFloor SDOF i j n s d (13)
In the same way, the spectral parameters N and d can be obtained by using Eq. (3) and the peak factor
calculated,
( )
w ={
éê -(
-d p(
)
)
ùú}
ë û
1.2
; ; , 2ln 2 , 1 exp , ln 2 ,
s p i j n i j i j i j
r N N (14)
Then the spectrum contribution for each response and loading direction be derived,
( )
w =s(
w)
×( )
w_ ; , _ ; , , ; ; ,
Floor SDOF i j n Floor SDOF i j n s p i j n
S s r (15)
Finally, the floor response spectra for the same location and direction, due to seismic motions in different directions must then be combined, taking into account that maximum responses should not be considered to occur simultaneously. In order to account for this effect, a simple SRSS rule is used for the computation of the final floor response spectrum.
( )
w = 2( )
w + 2( )
w + 2( )
w_ ; _ ; ,1 _ ; ,2 _ ; ,3
Floor SDOF i n Floor SDOF i n Floor SDOF i n Floor SDOF i n
S S S S (16)
INPUT DATA
Division III 0 2 4 6 8 10
0.01 0.1 1 10
SA (m/ s 2) T (sec) 2% 5% 10% 20% 40% -3 -2 -1 0 1 2 3 4
0 5 10 15 20 25 30
A cc ele ra tio n s [m/ s 2] Time [sec] SMS-1 -3 -2 -1 0 1 2 3 4
0 5 10 15 20 25 30
A cc ele ra tio n s [m/ s 2] SMS-2 -4 -3 -2 -1 0 1 2 3
0 5 10 15 20 25 30
A cc ele ra tio n s [m/ s 2] Time [sec] SMS-3
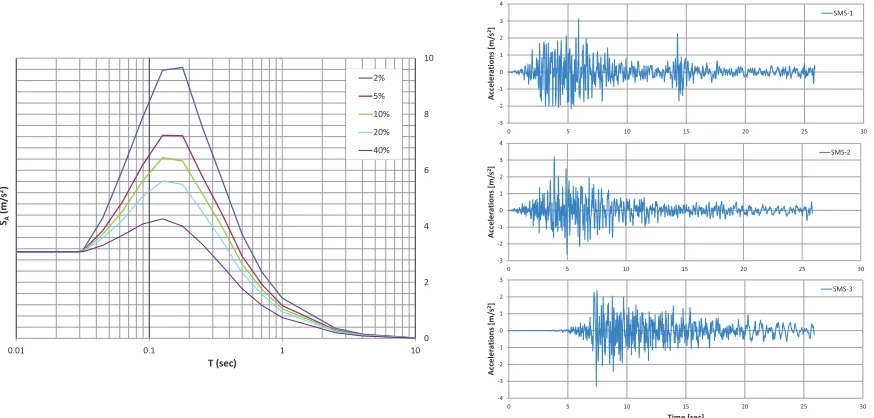
Figure 2. SMS Design Spectra and compatible accelerograms.
The second input is a deterministic structural model which can be used to obtain a set of transfer functions relating a harmonic motion at the base of the model with the resulting (harmonic) motion at some particular location within the structure.
The FE model used in this paper corresponds to a preliminary version of the Tokamak Complex building developed by Idom (2010). Figure 3 shows an overall view of the whole FE model representing the Tokamak Complex. The FE model has a total of 50342 nodes, plus an additional set of 4415 nodes that are defined in the dynamic version of the model for the implementation of the soil impedance. The number of elements according to their type is the following:
· 3360 spring (COMBIN14) elements, mainly for the seismic isolators representation.
· 4122 beam (BEAM188 and BEAM44) elements.
· 47082 shell (SHELL43 and SHELL63) elements.
· 3477 Multi-Point Constraints.
Division III
COMPUTATION OF FLOOR RESPONSE SPECTRA
The implementation of the direct spectrum-to-spectrum method, whose results are presented next, has
been programmed in Matlab. In general, the points in which the FRS are computed are located at “rigid”
joints (intersection between floor slabs with walls or columns). The 3-D analysis requires the definition of the action in three orthogonal directions. In this case, the SMS spectrum is applied for the horizontal ground motions (X and Y directions) as defined in Figure 3, whereas for vertical ground motion (Z direction) this spectrum is scaled by a factor of 2/3.
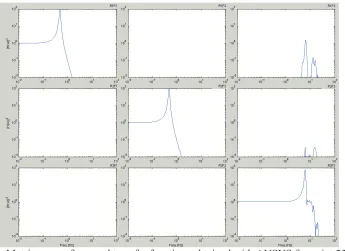
26 different points were analysed by Idom (2010), only one point is presented here, called point 23 which corresponds to an intersection between slab and column. Figure 4 presents the squared values of the transfer function obtained at this point. As expected, the most significant contributions are provided by
the “diagonal terms”, this is, when the response is computed in the same direction as that of the ground
motion (as expected for base isolated buildings, Moussa, 2012). The corresponding transfer functions in the horizontal directions (R1F1 and R2F2) present a clear peak in the frequency of the base isolation system (0.5 Hz), which clearly filters the effects of the ground motion in the horizontal direction. The
“diagonal” transfer function in the vertical direction (R3F3) also presents a clearly defined peak around 6
– 7 Hz.
Figure 4. Matrix array of squared transfer functions obtained with ANSYS for point 23 of the Tokamak Complex. Uniform logarithmic ordinate scale. Log-Log representation.
However, Figure 4 also reflect a significant contribution to the motion of point 23 along the global X direction for vertical ground motions (R1F3), with a clearly defined peak around, again, 6-7 Hz. It should be pointed out that the configuration selected for this methodology derivation is the one corresponding to the so-called alternative version (Idom, 2010) and that the frequencies associated to the peaks commented previously could vary for different properties of the soil and the seismic isolation pads.
Division III
comb1, comb2 and comb3. Figure 5 shows results obtained with the direct method using the SRSS combination rule. It can be seen a remarkable agreement with the traditional approach.
In general, for all points analysed (Idom, 2010) the maximum difference obtained for the peak values is
19% and 25% related to mean and envelope results, respectively. If the “mean error” is analysed in place of maximum, these differences are reduced to 9% and 18%, respectively. The standard deviation of the resulting errors is around 4-6%.
The agreement is better around the 6-7 Hz peak, being the response slightly lower in the horizontal cases, around the first peak. It should be pointed out, however, that the spectral magnitudes obtained with the artificial acceleration signals are about 10% higher than the Design Response Spectrum on which the direct method calculations are based (see Figure 5). The coincidence between the ZPA values is also extremely good.
0.0 0.5 1.0 1.5 2.0 2.5
0.1 1.0 10.0 100.0
Acceleration [·g]
Frequency [Hz]
X_dir (comb1)
X_dir (comb2)
X_dir (comb3)
X_dir (mean)
X-Direct Method
0.0 0.1 0.2 0.3 0.4
0.1 1.0 10.0 100.0
Acceleration [·g]
Frequency [Hz]
Y_dir (comb1)
Y_dir (comb2) Y_dir (comb3)
Y_dir (mean) Y-Direct Method
0.0 2.0 4.0 6.0 8.0
0.1 1.0 10.0 100.0
Acceleration [·g]
Frequency [Hz]
Z_dir (comb1) Z_dir (comb2)
Z_dir (comb3)
Z_dir (mean)
Z-Direct Method
Division III
X-, Y- and Z-directions.
The results obtained with the direct method are very encouraging. However, to complete the comparison with traditional time-history analyses is necessary to contrast the computer demands, especially the time and the memory space required.
The modal analysis is required for both calculations and the subroutines used for RS calculations and the direct method requires less than 10 minutes to finish with lower amount of data storage. Thus the differences must be found between the transient and harmonic analyses. For the example analysed in this work, no differences of time were found whereas the amount of data storage required by the
‘modal+harmonic’ analysis is about 80% of the required by the ‘modal+transient’ one. Thus, for the analysis of three signals it is not a noticeable advantage between both methods, only the amount of data storage required. However, in case of analysing more than three signals, the time required by the direct method is only increased by the required for the Matlab subroutines whereas the transient analysis must be completely repeated. In this case, the advantage of the Direct Method is more evident. It is important to note that the transfer function is always the same independently of the ground motion analysed.
SUMMARY AND CONCLUSIONS
In this paper, a direct method for determining Floor Response Spectra of linear structures has been applied in a 3D complex structure as the SIC Tokamak Complex building. The direct spectrum-to-spectra method is based in the treatment of the seismic action as a stochastic random process, representing the seismic action, in a statistical sense, by a Power Spectral Density (PSD) function. This PSD function defines the variance of the process and its frequency content.
Basically, the method can be divided in 3 basic steps:
· Step 1: Generation of a free field acceleration PSD function compatible with the Design Response
Spectrum.
· Step 2: Generation of the absolute acceleration PSD function at the locations of interest within the
structure (by means of harmonic analysis).
· Step 3: Determination of the final Floor Response Spectra.
The FRS obtained by the Direct Method were compared with the FRS obtained by the traditional transient analysis showing good agreement. For the case analysed, the advantage of the direct method appears when it is necessary to analyse multiple signals (more than three). Although in this paper only three earthquakes related to SMS spectrum were analysed, in the ITER project it is necessary to analyse up to six earthquakes (SMS + PALEO). In this case, the time required and data storage can be reduced about 40%. Thus, the authors conclude that, for FRS calculations, the Direct Method is a valuable and interesting alternative to the traditional transient analysis.
REFERENCES
Ali Reza T. K., Iradj Mahmood Z. K. and Assadollah N. (2013). “Elastic floor response spectra of
nonlinear frame structures subjected to forward-directivity pulses of near-fault records,”
Earthquakes and Structures, An Int'l Journal Vol. 5. No. 1. 049-065.
Ashtari, P. and S.H. Ghasemi (2013). “Seismic design of structures using a modified non-stationary
critical excitation,” Earthquake and Structures, Vol. 4, No. 4, 383-396.
ANSYS 14.5 (http://www.ansys.com).
Cacciola, Colajanni and G. Muscolino (2004). “Combination of Modal Responses Consistent with
Seismic Input Representation,” Journal of Structural Engineering of ASCE, January.
Cacciola, P. (2010) “A stochastic approach for generating spectrum compatible fully nonstationary
Division III
Cacciola, P. and Zentner, I. (2012) “Generation of response-spectrum-compatible artificial earthquake
accelerograms with random joint time-frequency distributions,” Probabilistic Engineering Mechanics,
28. pp. 52-58.
Clough, R. and J. Penzien. (2003). “Dynamics of structures,” McGraw Hill-Inc. 2nd edition, 2003.
Der Kiureghian, A. (1980). “Structural response to stationary oscillation,’’ J. Eng. Mech., 106(6),
1195–1213.
Der Kiureghian, A. (1981). “A Response Spectrum Method for Random Vibration Analysis of MDF
Systems,” Earthquake Engineering and Structural Dynamics. Vol 9, 419-435.
Gasparini, D.A. and E. H. Vanmarcke (1976). “Simulated earthquake motions compatible with
prescribed response spectra,” Evaluation of Seismic Safety of Buildings, Report no.2. Grant ATA
74-06935. January.
Gibert, R. J. “Vibrations des structures,”Collection de la Direction des Études et Reserches d’Électricité
de France, Éditions Eyrolles.
Giaralis, A. and Spanos, P.D. (2009). “Wavelet-based response spectrum compatible synthesis of
accelerograms – Eurocode application (EC8),” Soil Dynamics and Earthquake Engineering (29)
219-235.
Giaralis, A. and Spanos, D. (2012). “Derivation of response spectrum compatible non-stationary
stochastic processes relying on Monte Carlo-based peak facto estimation,” Earthquakes and
Structures, vol 3, No. 3-4, 581-609.
IAEA. ITER “the way to energy,” (https://www.iter.org).
Idom (2010). “A Direct Method for the Derivation of Floor Response Spectra at the Tokamak Complex,”
Technical Report. Task Order No.06: Interface between the building structure and the Tokamak machine. Integration of the Tokamak machine FEM model and assessment of the current preliminary design.
ITER (2013). “Load Specifications for Buildings with Safety Requirements,” version 1.15.
Matlab R2014b. Mathworks. (https://es.mathworks.com).
Moussa, L. (2012). “Response spectrum analysis for regular base isolated buildings subjected to near
fault ground motions,” Structural Engineering and Mechanics, Vol. 43, No. 4, 527-543.
Lalane, Christian. (2002). “Mechanical Vibration and Shock. Random Vibration,” Volume 3. Taylor &
Francis Books, Inc.
Newland, D. E. (1993). “An introduction to random vibrations, spectral & wavelet analysis,” Dover
Publications, Inc. 3rd edition.
Paskalov, A. and S. Reese. (2003). “Deterministic and probabilistic floor response spectra,” Soil
Dynamics and Earthquake Engineering, Volume 23, Issue 7, Pages 605-618.
Spanos, P. D. and Giaralis, A. (2013). “Third-order statistical linearization-based approach to derive
equivalente linear properties of biliniear hysteretic systems for seismic response spectrum analysis,”
Structural Safety (44) 59-69.
Vanmarcke, E. H. (1969). “First passage and other failure criteria in narrow band random vibrations: A
discrete state approach,” M.I.T. Department of Civil Engineering Research Report R69-68.