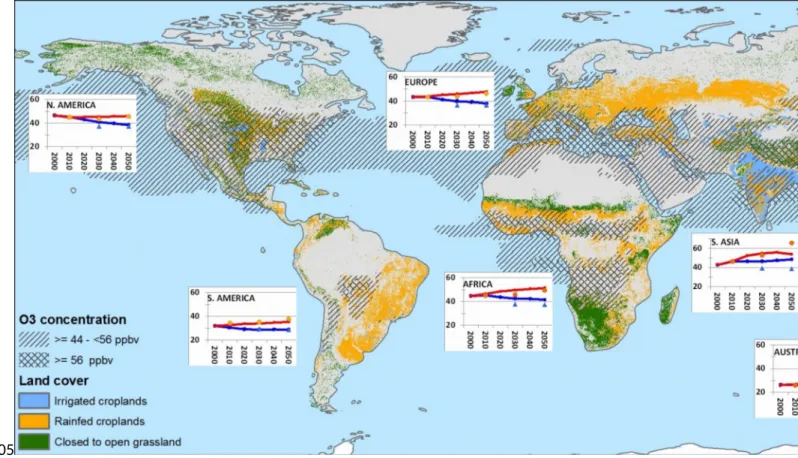
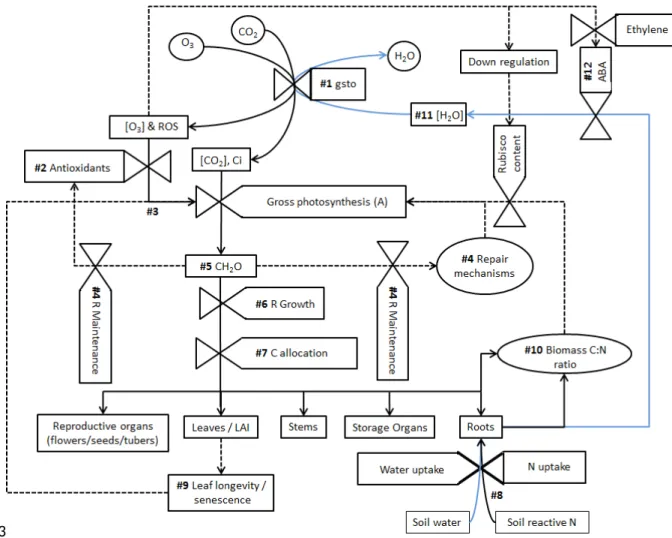
Ozone effects on crops and consideration in crop models
Full text
Figure


Related documents
Texas Commission Environmental Quality $24.4 million Public Utility Commission $2.7 million Comptroller of Public Accounts $5.4 million Energy Systems Laboratory $285,000 Texas
For an overview of the main events that occurred during the first half of 2012 and their impact on the Unaudited Condensed IFRS Consolidated Financial Information of EADS for the
When prompted, journalists readily offered advice for how health experts could support the media in providing quality news coverage in the event of a pandemic.. Their advice centred
Simultaneous Left Hooks to Body Blocked by Right Forearms..... Left Uppercut Led by One Man, Left Hook to Body by the Other;
• Government retains final determination of what data to provide • Solutions should be extensible to data sources outside of NOAA • Partnership arrangements shall be made
The survey draws attention to office environment, time taken by employee to process, availability of online resources, solution provided by DBBL, service fees, and more.Based on the
The dietary recommendations for each food group are shown (table 6) together with the mean number of servings per week and the differences from the recommended