Clutter Reduction in Parallel Coordinates
Visualization Using Axes Re-Ordering Based On
Minimal Edge Crossing
Hemant Makwana
#1,
Dr. Sanjay Tanwani
#2,
Dr. Suresh Jain
#3#1
-Institute of Engineering & Technology,
#2-School of Computer Sciences & Information Technology
#3
- Prestige Institute of Engineering Management & Research, Indore
2,3
-Devi Ahilya Vishawavidyalaya,
3- Rajiv Gandhi Technical University, India
Abstract
—
The effectiveness of visualization largely depends on the ease and accuracy with which users can understand the information. Visualization enhances the understanding of information hidden in the data. Most of the visualization techniques are affected from visual clutters. Clutter denotes a disordered collection of graphical entities in information visualization. Effectiveness of visualization can be enhanced by reducing the visual clutters. Solutions are available that reduces visual clutter with or without reduction of data. The main source of clutters in parallel coordinates technique is crossing edges. Our primary goal is to improve the display of information with minimal visual clutters. We propose innovative method of reordering the axes in Parallel Coordinates based on minimal edge crossing criteria. It optimises clutters in parallel coordinates.Keywords: multidimensional visualization, dimension ordering,
visual clutter.
INTRODUCTION
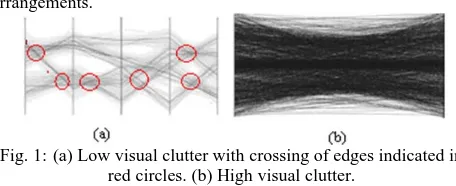
The purpose of visualization is to represent data in visual form for better understanding to the users. Visualization enhances the level of interaction of user with data via various mechanisms like zoom, Pan etc. A good visualization helps the viewer to identify the patterns and detect outlier easy and quickly. Clutter is crowded and disordered visual entities that obscure the structure in visual display. Clutter reduces viewers understanding and increases the confusion. However when dimensions or numbers of data items grow high, it is inevitable for user to face clutter, irrespective of any visualization method used. Hierarchical clustering, sampling, and filtering are the clutter reduction techniques that deal with data of high volume or high dimensionality. But they may cause loss of some important information. In Parallel coordinate, axes are positioned in one or two dimensional arrangement on the screen. Given the 2-D nature of this medium, the arrangement must choose some order of axis. This arrangement can have a major impact on the expressiveness and effectiveness of the visualization. Different orders of axis’s can reveal different aspects of the data and affect the perceived clutter and structure in the display. It may lead to different conclusion. Clutter reduction using axis reordering was first done by Wei Peng by reducing outliers [ 1]. Outliers are one of the sources of clutter but in parallel coordinates the crossing edges between the axes are the major source of clutters. (as shown in Fig. 1) By reducing crosses of edge may reduce the clutters. However, finding of the best ordering is tedious task, even for the modest dimension (Polynomial time problem). Edge crossing computation is another big issue. Suppose M dimensional data having N values then for worst case, edge crossing could be n*(n-1)*n*(m-1)/4{e.g. order of O(n4)}. An empirical study shows that in real situations actual
number of crosses is very less as compared to estimated in the worst case. There is requirement of finding efficient method of computing possible number of edge crossing for a given axis arrangements.
Fig. 1:(a) Low visual clutter with crossing of edges indicated in red circles. (b) High visual clutter.
In this work, we measure a clutter in terms of number of crosses between axis pair and reduce it by minimizing the edge crosses. It covers two issues: (1) computation of number of edge crosses between axis pair in parallel coordinates, and (2) minimum crosses based reordering of axis. In this paper, Section 2 provides review of related work. Sections 3 and Section 4 covers some definitions and measures of clutters using edge crossing. In Section 5, new axis-ordering algorithm for axis reordering is presented. Conclusions and future works are presented in Section 6.
RELATED WORK
oriented techniques provide more display space for interested data for analysis while less space for uninterested data. But it is become difficult when user does not have any idea about data. Hence it is difficult for the viewer to fully understand the data.[8,9] Wegman and Luo[10] also utilize transparency to identify regions of high over plotting through their dense color which another measure of clutter. Artero et al [11] use clustering to reduce visual clutter. Bertini & Santucci [12] reduces visual clutter by non-uniform sampling for scatter plots. Stone, K. Fishkin and E.A. Bier [13] reduce the clutter by filtering. Distortion, clustering, sampling, filtering are the way of clutter reduction on the basis of losing some amount of data. Reordering of axes is the way of clutter reduction without loss of data. It utilizes one or more correlation among data to reduce the visual clutter.
PARALLELCOORDINATES
Parallel coordinates is a technique pioneered in the 1980’s by A. Inselberg and B. Dimsdale [16]. In this method, each dimension corresponds to an axis, and the N axes are organized as uniformly spaced vertical or horizontal lines. A data element in an N-dimensional space manifests itself as a connected set of points, one on each axis. Thus a poly-line is generated for representing one data point. This poly-line represents a pattern. Crossing patterns in mid of two consecutive axes produces clutter.
CLUTTER DEFINITION
Ruth Rosenholtz [14] suggested the following definition of clutter for scientific exploration: Clutter is the state in which excess items, or their representation or organization, lead to a degradation of performance at some task. Another definition of clutter is defined as Clutter is a state of confusion which degrades both the accuracy and ease of interpretation of information displays [6]. Clutter is redefined in terms of outlier by [7] as the proportion of outliers against the total number of data points. [1,8,15] Try to define the visual clutter in terms of parameters(density, outlier, occlusion etc). [6] Define clutters in terms of visual effects (density). Clutter measurement using crosses between pair of axis is done by [8] but only computation of crosses is not sufficient. Density of crosses and distribution of crosses significantly affects the clutters. Hence distribution of crosses and density may give the clear and effective measurable quantity about clutters. Many others also try to define clutters but did not tell about any measurable quantity that effectively measures the clutters.
CLUTTER MEASURE IN PARALLEL COORDINATES
As clutter is defined in previous section is related with the performance. It is also defined in terms of outlier but main source of clutter is data density and crossing of edges in parallel coordinate. Therefore crosses of edges can be computed as:
CE=n*(n-1)/2 PA= m*(m-1)/2 and
Total number of crosses = CE*PA (1)
Here, n is number of data items. m is number of dimension of dataset and CE is the number of crosses between a pair of axis. PA denotes number of pair of axis.
Suppose m=5 and n= 10 then total number of crosses will be 450. The complexity of this system is the order of O(n)4 but an empirical results indicates the number of crosses are much less then mentioned in equation (1).
CONDITION FOR INTERSECTION
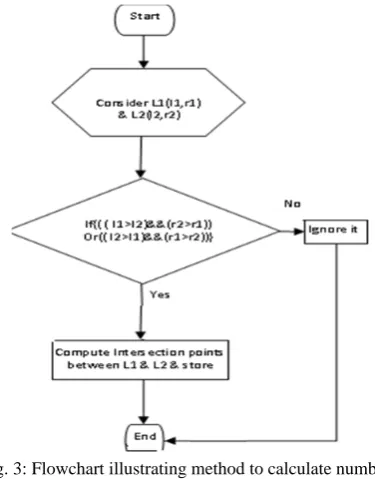
We present possible arrangements of edges for computation of crosses. We choose any pair of lines between axes (as shown in Fig. 2). Consider two line L1(l1,r1) and L2(l2,r2) and if we consider
all possible axis arrangements, then we get nine arrangements. In these arrangements, only two cases provide the intersections (ignoring intersection on axis). Therefore to calculate the intersection need to test only two cases and rest cases can be ignored (Method is shown in Fig 3). It reduces the computation complexity, significantly.
Fig. 2: All possible placement of line L1 (l1,r1) in red color and L2(l2,r2) in green color between axis pair.
Fig. 3: Flowchart illustrating method to calculate number of crosses between line L1 and L2.
REORDERING CRITERIA
Initially, we re-reorder the axis on the basis of edge crosses to optimize the display for the analyst. In general, finding an optimal ordering of axes for parallel coordinates is NP-complete problem. Using an algorithm and considering the special properties of parallel coordinates, we can find the optimal solutions for a given instance, for this, a new algorithm axis-ordering is proposed.
Algorithm axis-ordering ()
Input: axis_ pair_ Table (Consist of three columns: start axis, end axis, value)
Output: ordered_axis_ list (consist of axis name)
1. Sort axis_ pair_Table on the basis of value.
2. Add first pair of axis to ordered_axis_list.
3. Set pointer ( L1,L2)
4. Remove pair from axi_pair_Table and
incrementaxis_counter.
5. Get the pair (L1 and L2) with other axes and find pair
that has minimum value.
6. Add end axis to ordered_ list and update pointers (L1 or
L2).
7. Remove pair from axi_pair_Table.
8. If (axis_counter<numbe_ of_ axis)
then go to step 5
else print ordere_axis_ list.
Camera cars coal voyager 0
10 20 30 40 50 60 70 80
Crosses Calculation time for Small size Database.
time1(Standard) Time2 (Proposed)
(Datatypes (size<500)
C
a
lu
la
ti
o
n
t
im
e
(
in
m
ili Se
co
n
d
s)
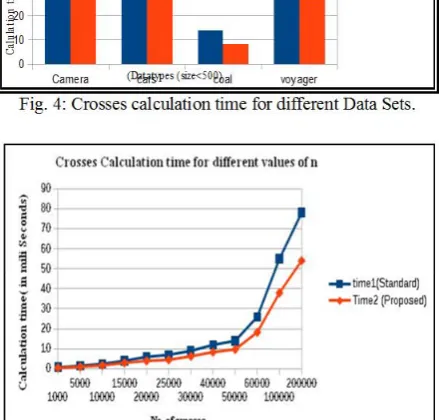
Fig. 4: Crosses calculation time for different Data Sets.
Fig. 5: Crosses calculation time for different values of n.
DATA SETS FOR EXPERIMENT
Different size of data sets used in this experiment. Parvis [15] and xmdv tools are used to demonstrate the Parallel Coordinate view and ordering of axis based on number of crosses. This tool is available on HTTP://WWW.MEDIAVIRUS.ORG/PARVIS/. To test these approaches three categories of data sets are selected. Initially, synthetic datasets is created to effectively demonstrate the concept. Then we have used it for three different data sets. First one is small data size with less number of attributes (Olive). Second data set is having higher number of attributes (Car) and third data set have much large number of values (Out5D). Details of each data set are shown in Table 5.1.
Olive Data set:
The Olive data set consist of 572 values and five attributes of olive oil. Data Table 5.2 indicates pair of axis and number of crosses. Table 5.3 indicates the axis ordering correspond to maximum and minimum number of crosses. Parallel coordinates illustrated in Fig. 6 and Fig. 7.
Data Base name :Olive No. of Dimensions :05 Data size :572
Number of crosses :16,35,920(Theoretically)
Table 1: Data values of some pairs of olive data set (Dimensions are renamed V1, V2, …for simplicity).
Dim Sets No. of intersection
V1,V2 89180
V1,V3 73975
V1,V4 80647
V1,V5 52677
V2,V3 75342
V2,V4 71423
V2,V5 68653
V3,V4 54019
V3,V5 39237
V4,V5 57972
Fig. 6: Illustration of minimum (left) maximum (right) number of crosses between pair of axis of Olive data set.
Table 2: Ordering of axis corresponds to maximum and minimum number of crosses of Olive data sets.
On the basis of number of intersections, we find the sequence of axis which provides minimum number of intersection is (V2,V4,V3,V5,V1) and similarly (V5,V4,V1,V2,V3) provides maximum number of intersections (as shown in Fig. 7).
Fig.7: Axes ordering based on (left) minimum (right) maximum number of intersection among the data lines of Olive data set.
Out5D data sets:
The Out5d consist of 1307(reduced data set) values and five attributes (spot, magnetics, and three radiometrics channels-potassium, thorium, and uranium) of remote sensed data. . Data Table 5.2 indicates pair of axis and number of crosses. Table 5.3 indicates the axis ordering correspond to maximum and minimum number of crosses. Parallel Coordinates view shown in figure 8and 9.
Data Base name :Out5D No. of Dimensions :05 Data size :1307
Number of crosses :85,41,245(Theoretically)
Table 3: Data values of some pair of Out5D data sets. Dim Sets No. of intersection
V1,V2 339067
V1,V3 317886
V1,V4 444072
V1,V5 442072
V2,V3 235319
V2,V4 367337
V2,V5 506621
V3,V4 261703
V3,V5 497143
V4,V5 406585
Table 4: Ordering of axis corresponds to maximum and minimum number of crosses of Out5D data sets.
Axis order Number of crosses
V1V2V3V4V5 12,42,674
Fig. 8: Illustration of minimum (left) and maximum (right) number of crosses between pair of axis of Out5D Data set.
On the basis of intersection points the order of axes are shown in Fig. 9.
Fig. 9: Axes ordering based on (left) minimum (right) maximum number of intersection among data lines of Out5D.
Car Data sets:
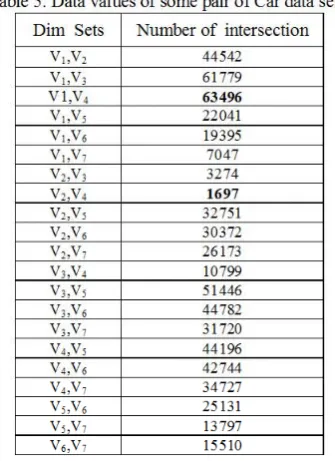
The cars data set consists of 392 values and seven attributes: MPG, horsepower, cylinders, weight, acceleration, origin and year. Data Table 5.2 indicates pair of axis and number of crosses. Table 5.3 indicates the axis ordering correspond to maximum and minimum number of crosses. Parallel Coordinates view shown in Fig. 10 and Fig. 11.
Data Base name :Cars No. of Dimensions :07 Data size :394
Total number of crosses :16,25,862(Theoretically)
Fig.10: Illustration of minimum (a) and maximum (b) number of crosses between pair of axis of car data set.
Fig 11: Axes ordering based on (a) minimum and (b) maximum number of intersection among data lines.
Table 5: Data values of some pair of Car data sets.
Table 6: Ordering of axis corresponds to maximum and minimum number of crosses of Out5D data sets.
Axis order Number of crosses
V4V2V3V7V1V5V6 82666
V7V2V5V3V1V4V6 278389
CONCLUSION AND FUTURE WORK
Crosses between axes produce confusion and is the main cause of visual clutter. Axis ordering is important factor that affects the number of crosses. Our work, on crosses based axis re-ordering reduces the visual clutters significantly, and thus improves the visualization in Parallel Coordinates for better data analysis. . In this work, three standard visualization datasets have been used for testing our idea on clutter reduction. Proposed methods may be further extended to user defined ordering of axes for improving user interaction.
Table 7: Details of Data sets with attributes name and its representation.
Data setName
Number of
dimensions Data size
Number of crosses
(theoretically) Attributes Name
Olive 05 572 16,35,920 V1-Stearic, V2-linolenic, V3- arachidic, V4-eicosenoic and V5-palmitoleic.
Out5D 05 1307 85,41,245 V1-spot, V2-magnetics, V3-potassium, V4-thorium, and V5 -uranium
REFERENCES
[1] Wei Peng, Matthew, O. Ward, Elke A. Rundensteiner, “Clutter
Reduction in Multi-Dimensional Data Visualization Using Dimension Reordering”, IEEE Symposium on Information Visualization 2004 (InfoVis 2004), pp 89 - 96, October 2004.
[2] J. Yang, W. Peng, M.O. Ward, and E.A. Rundensteiner. “Interactive
hierarchical dimension ordering, spacing and filtering for exploration
of high dimensional datasets”. Proc. IEEE Symposium on
InformationVisualization, pp. 105–112, 2003.
[3] B. Shneiderman, “The Eyes Have It; A Task by Data Type
Taxonomy for Information Visualization”, Univ. of Maryland,
TR-96-66, 1996.
[4] S.K. Card and J. Mackinlay, “The structure of the information
visualization design space”, Proc. InfoVis’97, pp. 92-100, 1997.
[5] M.O. Ward, “A taxonomy of glyph placement strategies for
multidimensional data visualization”, Information Visualization,
pp.194–210, 2002.
[6] N. Lioyd: Technical Report on “clutter measurement and reduction
for enhanced information visualization”, Worcester Polytechnic
Institute, March 2006.
[7] A. Dasgupta and R. Kosara. “Pargnostics: screen-space metrics for
parallel coordinates”, IEEE Transactions on Visualization and
Computer Graphics, 16(6):1017–26, 2010.
[8] M. Sheelagh, T. Carpendale, D.J. Cowperthwaite, and F.D. Fracchia.
“Distortion viewing techniques for 3-dimensional data”. Proc. IEEE
Symposium on Information Visualization, pp. 46–53, 1996.
[9] Y.K. Leung and M.D. Apperley. “A review and taxonomy of
distortion oriented presentation techniques”. ACM Transactions on
Computer-Human Interaction, 1(2):pp. 126–160, 1994.
[10] E.J. Wegman and Q. Luo. “High Dimensional Clustering Using
Parallel Coordinates and the Grand Tour”. Computing Science and
Statistics, 28, pp. 352-360, July 1996.
[11] A.O. Artero, M.C. Ferreira de Oliveira and H. Levkowitz. “Uncovering Clusters in Crowded Parallel Coordinates Visualizations”. Infovis, pp. 131-136, 2004.
[12] E. Bertini and G. Santucci. “Improving 2D scatterplots effectiveness
through sampling, displacement and user perception”. Proc.
Information Visualisation 2005, London, pp. 826- 834, July 2005 [13] M. Stone, K. Fishkin and E.A. Bier, “The Movable Filter as a User
Interface Tool”, Proc. CHI'94, pp. 306-312, 1994, ACM Press.
[14] Ruth Rosenholtz, Yuanzhen Li, Jonathan Mansfield, and Zhenlan
Jin. “Feature congestion: a measure of display clutter”. Proceedings
of the SIGCHI Conference on Human Factors in Computing Systems, pp. 761, 2005.
[15] http://www.mediavirus.org/parvis/