Background sensitivity studies for GEM based detectors
using a Geant4 simulation
IlariaVai1,2,∗on behalf of the CMS Muon Group
1Università degli Studi di Pavia, Dipartimento di Fisica 2Istituto Nazionale di Fisica Nucleare - Sezione di Pavia
Abstract.
Triple-GEM detectors were selected by the CMS Collaboration for instrument-ing the highηregion of the muon system. This region is characterized by a huge radiation background, mainly composed by neutrons and photons. In this con-text, a discharge probability test was performed in 2017 at the CHARM facility at CERN, to study the operation of the detector in an environment similar to the one of the CMS muon system. A Geant4 simulation was developed in parallel to the actual test, in order to evaluate the behaviour of the detector. This paper will present this simulation, from the detector geometry implementation to the results obtained in terms of sensitivity and energy deposited into the gas gaps.
1 Introduction
Triple-Gas Electron Multiplier (Triple-GEM) detectors [1] have been proposed for the instal-lation in the new Muon Endcap 0 (ME0) station of the CMS muon system. Currently the region 2.03 < |η1 | <2.82 is not instrumented because it is characterized by a very harsh
radiation environment, composed mainly of neutrons, in the energy range 10−8 - 104MeV,
photons, in the energy range 10−2 - 102MeV, electrons and positrons. It can reach rates up
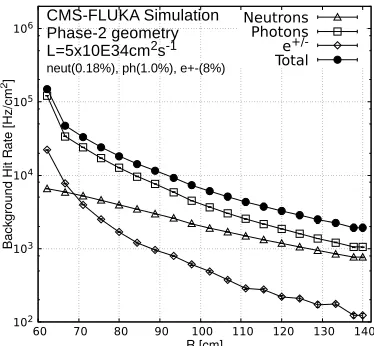
to∼105Hz/cm2, as shown in Fig.1, thus generating an integrated charge in the order of 280
mC/cm2over ten years of operation [2]. Triple-GEM technology has already been qualified
for the operation in the CMS muon system in terms of resistance to the accumulated charge: a dedicated test performed at the GIF++facility at CERN has demostrated that the detectors
can survive accumulated charge in the order of∼180 mC/cm2without degradation in
perfor-mance, while a parallel test with an X-Ray source allowed to reach even the order of∼875 mC/cm2, over a factor 3 of the expected integrated charge in ME0 [3].
However, the weak point of Triple-GEM is represented by discharges, which can damage the foils or even destroy them completely, preventing the detector from operating properly. For this reason, considering the huge background expected, an additional set of studies fo-cused on the discharge probability was necessary for the ME0 station. A test was carried out in 2017 at the Cern High energy AcceleRator Mixed (CHARM) facility [4], with the aim of giving an estimation of the discharge probability of Triple-GEM detectors in a very intense
∗e-mail: [email protected]
102 103 104 105 106
60 70 80 90 100 110 120 130 140
CMS-FLUKA Simulation Phase-2 geometry L=5x10E34cm2s-1 neut(0.18%), ph(1.0%), e+-(8%)
Bac
kgr
ound Hit R
at
e [Hz/cm
2]
R [cm]
Neutrons Photons e
+/-Total
Figure 1: Expected background hit rate in the ME0 region [2]. The plot assumes a LHC lumi-nosity L=5×1034cm−2s−1and the sensitivity to different particle species indicated in brackets.
mixed field environment, similar to the one of the CMS muon system. The choice of the fa-cility, which will be described in detail in Sec. 2, was determined by the characteristics of its particle environment, which is compatible with the one expected in the CMS muon system, both in terms of energy range and intensity.
2 The CHARM facility
The CHARM facility is located into the Proton Syncrothron (PS) east area hall at CERN, as shown in Fig.2 left. Its particle field is produced by the interaction of the 24 GeV/c PS beam with a cylindrical copper or aluminum target. The resulting flux is composed of neutrons, protons, pions, kaons, muons and gammas.
102 103 104 105 106
60 70 80 90 100 110 120 130 140
CMS-FLUKA Simulation Phase-2 geometry L=5x10E34cm2s-1 neut(0.18%), ph(1.0%), e+-(8%)
Bac
kgr
ound Hit R
at e [Hz/cm 2] R [cm] Neutrons Photons e +/-Total
Figure 1: Expected background hit rate in the ME0 region [2]. The plot assumes a LHC lumi-nosity L=5×1034cm−2s−1and the sensitivity to different particle species indicated in brackets.
mixed field environment, similar to the one of the CMS muon system. The choice of the fa-cility, which will be described in detail in Sec. 2, was determined by the characteristics of its particle environment, which is compatible with the one expected in the CMS muon system, both in terms of energy range and intensity.
2 The CHARM facility
The CHARM facility is located into the Proton Syncrothron (PS) east area hall at CERN, as shown in Fig.2 left. Its particle field is produced by the interaction of the 24 GeV/c PS beam with a cylindrical copper or aluminum target. The resulting flux is composed of neutrons, protons, pions, kaons, muons and gammas.
Figure 2: Left: overview of the CHARM facility along the PS beam line. Right: screen-shot of the test positions as reproduced in the CHARM FLUKA geometry, cut at beam-height. The different irradiation positions are marked with black squares [4]. TheR3position is enlighted by the red number.
The intensity of the field is different in the various irradiation positions, shown in Fig.2 right by the small black squares. For the 2017 test, the position calledR3was selected. An array of shielding blocks of concrete (grey rectangle in the Fig.2 right) and iron (in brown) can be inserted to reduce the intensity of the field: during the test, the configuration called
CuCIICwas selected, where Cu represents the copper target for the beam and CIIC means
that all the concrete and iron shielding blocks were actually inserted [4].
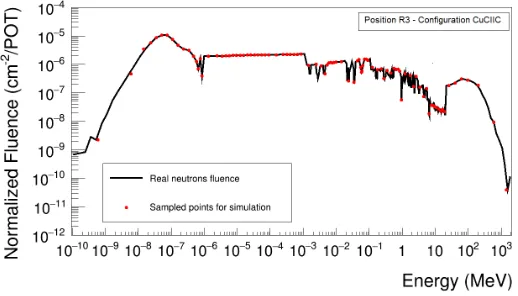
Figure 3: Spectrum of the different particle species present in the irradiation position, ex-pressed in [cm−2/POT], where POT means protons on target. The data are coming from a
FLUKA simulation performed by the CHARM personnel [5].
Fig.3 shows the FLUKA simulation of the normalized fluence in the irradiation position: the wider spectrum is from neutrons, going from 10−9MeV to 103MeV, comparable with the
one expected in the CMS muon system. The contribution of other particles is relevant only for energies above 100 keV [5].
3 Simulation of the Triple-GEM detector and of the CHARM field
The aim of the performed Geant4 simulation [6] was to understand the behaviour of the triple-GEM detector exposed to the CHARM flux, prior to irradiation. In particular, an estimation of the sensitivity of the detector to the CHARM field, i.e. the probability for a particle of the CHARM field to produce a visible signal in the detector, was important to get an indication on the expected event rate. On the other hand, the analysis of the energy deposited into the detector is needed to understand which fraction of the events could actually cause a discharge. To obtain reliable estimations, two parts of the simulation must be carefully developed: the geometry of the Triple-GEM detector and the incident flux.3.1 Detector geometry
The irradiated chamber was a 10×10 cm2standard Triple-GEM detector: the GEM foils were
made of a 50µm-thick Kapton foil, cladded on both sides with 5µm of copper. A Kapton
window, 50µm-thick was used to close the detector on top, while on the bottom the readout
board was made of a 3.2 mm-thick PCB (FR4) layer covered with a 35 µm-thick copper
Figure 4: Left: sketch of the simulated Triple-GEM detector. Right: picture of the detector exposed to the CHARM flux
Inductionof width 3:1:2:1 mm respectively, were filled with Ar/CO270/30. Fig.4 left shows
the implementation of this geometry in the Geant4 simulation, while the picture on the right shows the detector exposed to the CHARM field.
3.2 Simulated flux
The simulated flux is obtained by sampling the spectrum in the irradiation position (Fig.3): Fig.5 shows the particular case of the sampling performed for neutrons, similar results have been obtained for all the particle species.
Figure 5: Comparison between the neutron fluence provided by the CHARM personnel (black) and the one used for the Geant4 simulation (red). The simulated one is obtained from a sampling of the complete spectrum.
Moreover, in the facility the particles are not coming from a single direction, but they create a gas which surrounds the detector. The real angular distributions in the irradiation position were not available therefore we decided to use the angular distribution expected in the CMS muon system.
The whole simulation is performed with Geant4.9.6.p02, using the reference Physics List FTFP_BERT_HP [7].
4 Results
4.1 Sensitivity
The sensitivity is defined as the probability for a given particle of a given energy to produce a visible signal in the detector. Neutral particle don’t directly produce a signal but through their interaction with detector material secondary particles can be produced which then generate a signal in the detector.
In the simulation, it is calculated as:
S = Nsignals
Nincident particles (1)
where Nsignalsis the number of events in which at least one charged particle tracked by Geant4
reaches either theDriftor theTransfer1gap. We assume that every time a charged particle reaches one of these two gaps a detectable signal is generated, which of course is an overes-timation. We are then able to compute an upper limit on the sensitivity.
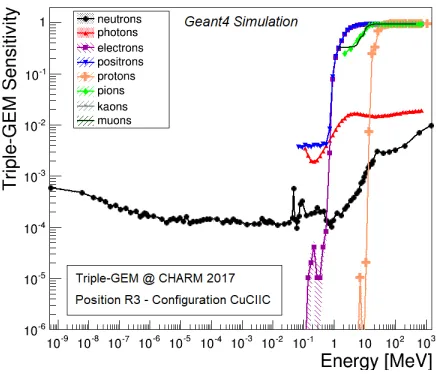
Figure 6: Sensitivity of the Triple-GEM detector exposed to the CHARM flux as a function of the energy of the incident particle, for the different particle species present.
Fig.6 shows the sensitivity of the Triple-GEM detector exposed to the CHARM flux as a function of energy for the different incident particles. As expected from a gaseous detector, for kinetic energies E>1 MeV, the sensitivity to charged particles approaches 100%. For the neutral neutrons and photons the situation is a bit more complicated. For photons at energies below 1 MeV (E<1 MeV) the dominant processes are the compton and photoelectric effects. The compton effect dominates at energies (1<E<10 MeV). For photon energies E >10 MeV the dominant effect is pair production. For neutron kinetic energies E<1 MeV where the dominant process is hadronic elastic scattering, with contributions from neutron capture below 10−5MeV, the sensitivity is in the order of 10−3. Above 1 MeV non-elastic processes
with thresholds in the MeV region start to take place, thus increasing the number of secondary charged particles produced increasing the sensitivity up to 10−2 at the GeV energy scale.
Figure 7: Hit rate for Triple-GEM detector as a function of the energy of the incident particle.
Interesting is also the hit rate, obtained from the convolution of the sensitivity with the particle spectra, shown in Fig.7. Up to 1 MeV, it is clear that the dominant contribution is coming from neutrons, while, at higher energies, neutrons contribution drops in favour of the different species of charged particles.
4.2 Energy deposited
As introduced above, the study of the energy deposited (Edep) by the particles into the Triple-GEM detector allows to determine the number of primaries produced inside theDriftgap and thus to understand which fraction of the events can actually trigger a discharge. The first step is to analyze the totalEdep, i.e. the energy deposited into the detector due to all the processes the particle undergoes, not only primary ionization.
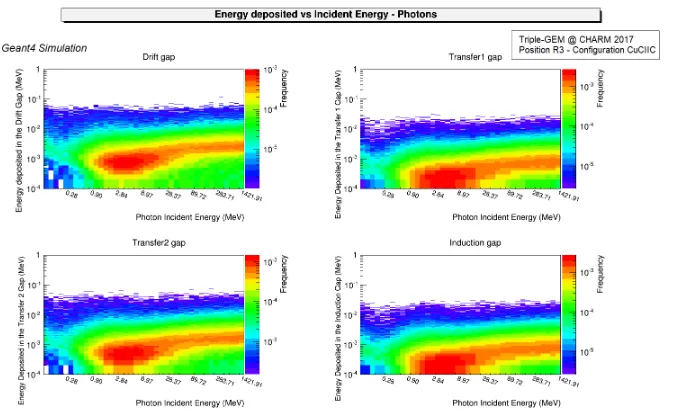
In Fig.8 and Fig.9 we can see the result of such a study for photons and neutrons respec-tively. Each subplot shows theEdepin one of the four gas gaps as a function of the energy of the incident particle, with the color representing the frequency. Starting from photons, it is clear that the higherEdepis for particles in the range 1-10 MeV, where 1 of every 1000 in-cident photons deposits on average 1 keV. As already discussed above, the dominant process in this energy range, responsible of these energy depositions, is the Compton scattering. In general, the highestEdepfor photons can reach up to 100 keV, which is the maximum for the whole energy spectrum and has a frequence of 1 event of every 105incident photons.
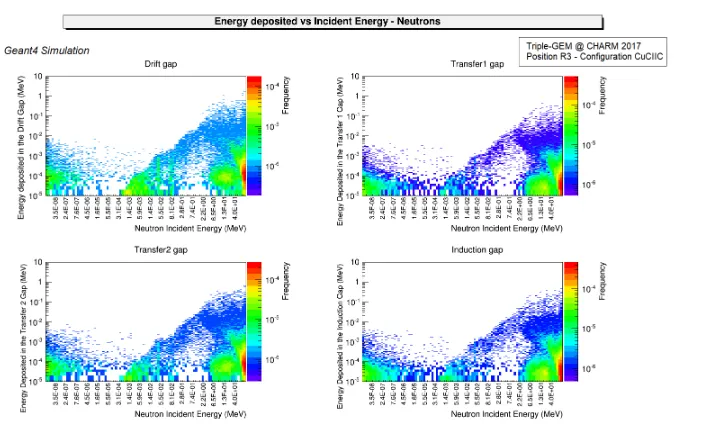
The behaviour in case of neutrons is instead quite different: as anticipated by the results on sensitivity, the highestEdepis in the region above 1 MeV, where the inelastic processes can cause anEdepof 1 MeV for 1 incident neutron over 106, i.e. one order of magnitude
more than photons. In general, the most probable value ofEdepis around 0.1 keV and is particularly frequent (1 event over 105incident neutrons) in three regions: thermal region, for
incident energy<10−5MeV, 1 keV region were the dominant process is the elastic scattering and for energies above 5 MeV.
Figure 7: Hit rate for Triple-GEM detector as a function of the energy of the incident particle.
Interesting is also the hit rate, obtained from the convolution of the sensitivity with the particle spectra, shown in Fig.7. Up to 1 MeV, it is clear that the dominant contribution is coming from neutrons, while, at higher energies, neutrons contribution drops in favour of the different species of charged particles.
4.2 Energy deposited
As introduced above, the study of the energy deposited (Edep) by the particles into the Triple-GEM detector allows to determine the number of primaries produced inside theDriftgap and thus to understand which fraction of the events can actually trigger a discharge. The first step is to analyze the totalEdep, i.e. the energy deposited into the detector due to all the processes the particle undergoes, not only primary ionization.
In Fig.8 and Fig.9 we can see the result of such a study for photons and neutrons respec-tively. Each subplot shows theEdepin one of the four gas gaps as a function of the energy of the incident particle, with the color representing the frequency. Starting from photons, it is clear that the higherEdepis for particles in the range 1-10 MeV, where 1 of every 1000 in-cident photons deposits on average 1 keV. As already discussed above, the dominant process in this energy range, responsible of these energy depositions, is the Compton scattering. In general, the highestEdepfor photons can reach up to 100 keV, which is the maximum for the whole energy spectrum and has a frequence of 1 event of every 105incident photons.
The behaviour in case of neutrons is instead quite different: as anticipated by the results on sensitivity, the highestEdepis in the region above 1 MeV, where the inelastic processes can cause anEdepof 1 MeV for 1 incident neutron over 106, i.e. one order of magnitude
more than photons. In general, the most probable value ofEdepis around 0.1 keV and is particularly frequent (1 event over 105incident neutrons) in three regions: thermal region, for
incident energy<10−5MeV, 1 keV region were the dominant process is the elastic scattering and for energies above 5 MeV.
Fig.10 shows the mean total Edep/particle into the 3 mm Driftgap for particles hitting the detector as a function of the particle energy. From this plot it is evident that the neutrons
Figure 8: Total energy deposited into the different gaps by a photon hitting the detector, as a function of the photon energy.
5 Conclusions and future perspectives
A Geant4 simulation was performed to reproduce the behaviour of a Triple-GEM detector ex-posed to the CHARM radiation flux. We presented results on detector sensitivity and energy deposited in the gas gaps. Regarding the sensitivity, the simulation shows that the contri-bution of neutrons dominates till 1 MeV, while at higher energies the charged particles are dominant. High energy neutrons can deposit up to one order of magnitude more energy in the Triple-GEM gas gaps than photons, thus indicating neutrons as good candidates for the generation of a discharge.
The work on the simulation is continuing, in particular on the energy deposition side, with the final goal of isolating theEdepby primary electrons, fundamental for a proper estimation of the number of primaries produced by each interaction.
References
[1] F. Sauli, Nucl. Instrum. Meth. A386, 531 (1997)
[2] CMS Collaboration, CERN-LHCC-2017-012, CMS-TDR-016 [3] F. Fallavollita, Muon Upgrade Workshop, 12 Sept. 2018 [4] A. Thornton, CERN-ACC-NOTE-2016-12345
[5] A. Infantino, CERN-ACC-NOTE-2017-0059
[6] S. Agostinelli, Nucl. Instrum. Meth. A506, (2003) 250-303 [7] https://geant4.web.cern.ch/node/155
Figure 9: Total energy deposited into the different gaps by a neutron hitting the detector, as a function of the neutron energy.
![Figure 1: Expected background hit rate in the ME0 region [2]. The plot assumes a LHC lumi-nosity L51034cm−2s−1 and the sensitivity to dierent particle species indicated in brackets.](https://thumb-us.123doks.com/thumbv2/123dok_us/7997011.1327989/3.482.112.371.159.306/figure-expected-background-sensitivity-particle-species-indicated-brackets.webp)