ABSTRACT
GOODRUM, SHAYNE GILBERT. The Relation of Sources of Teacher Efficacy to Student Writing Achievement and District Health. (Under the direction of Ruie J. Pritchard.)
The purpose of the research was to determine the relation of five sources of teacher efficacy to student writing achievement and district health. As a construct of social cognitive theory, teacher efficacy has been shown to be related to teachers’ instructional practices. Five categories of sources of efficacy were aligned with indicators of
writing instruction. Effects between high and low district health subjects were
The Relation of Sources of Teacher Efficacy to Student Writing Achievement and District Health
by
Shayne Gilbert Goodrum
A dissertation submitted to the Graduate Faculty of North Carolina State University
in partial fulfillment of the requirements for the Degree of
Doctor of Philosophy
Curriculum and Instruction
Raleigh, North Carolina 2008
APPROVED BY:
_____________________________ _____________________________
Jon C. Marshall Carol A. Pope
_____________________________ _____________________________
Hiller A. Spires Malina K. Monaco
_____________________________ Ruie J. Pritchard
BIOGRAPHY
Shayne Gilbert Goodrum graduated from the University of Georgia in 1971 with an A.B. in English. While teaching junior high several years later, she entered the State University of New York at Brockport, earning a Masters of Arts in English in 1975. Throughout her career, frequent coursework and other explorations attest to her zeal for life-long learning.
In 1992, as a fellow of the Capital Area Writing Project at North Carolina State University, Shayne discovered new talent for leading professional development and realized the importance of educational research for practicing teachers. Since then, she has been a frequent facilitator for professional development, written on-line courses for several educational organizations, taught courses for North Carolina Central University and North Carolina State University, and trained Facilitative Leadership® for the North Carolina Network. She continues to provide professional development in reading in association with the Strategic Literacy Initiative’s Reading Apprenticeship Framework. Shayne was among thirty-one educators selected to participate in the National Writing Project’s Legacy study, examining the contributions of teachers who participated in local writing project sites, and her writing is included in the study’s Vignette Anthology (2006).
ACKNOWLEDGEMENTS
I’d like to express my deep appreciation for the generosity and support of Ruie J. Pritchard and Jon C. Marshall in this research project. They generously welcomed me into their work, sharing the artifacts of their research and providing help and counsel every step of the way. I am more grateful than words can express.
I also owe a debt of gratitude to both Ruie J. Pritchard and the College of
TABLE OF CONTENTS
LIST OF TABLES... vi
CHAPTER 1 - INTRODUCTION...1
Historical Context ...2
CHAPTER 2 – LITERATURE REVIEW ...8
Writing Instruction...8
Social Cognitive Theory ...14
Self-Efficacy in Writing...17
Teacher Efficacy ...21
Sources of Efficacy and Writing Instruction ...25
Teacher Efficacy in School Contexts...29
Teacher Efficacy and School Climate...31
CHAPTER 3 – METHODOLOGY ...34
Research Hypotheses ...37
Procedures for Coding Teacher Practice...39
Hypothesis: Sources of Teacher Efficacy Related to Student Achievement ...40
Hypothesis: Sources of Teacher Efficacy Related to District Health ..41
CHAPTER 4 – RESULTS ...43
Source Category: Mastery Experiences ...44
Source Category: Physiological and Emotional States...46
Source Category: Vicarious Experiences...47
Source Category: Social Persuasion ...48
Source Category: Persistence in the Face of Difficulties...48
Variability in Coded References...49
Relation of Student Writing Achievement to Efficacy Source Categories ...50
Relation of District Health to Efficacy Source Categories ...51
CHAPTER 5 – DISCUSSION...55
Limitations of Analytic Results ...55
Key Practices in Significant Categories...57
The Relation of Efficacy Source Categories to Writing Achievement ...59
The Relation of Efficacy Source Categories to District Health...62
Conclusion and Questions...64
WORKS CITED ...69
APPENDICES ...82
Appendix A: The 11 Key Elements of Adolescent Writing Instruction ...83
Appendix B: Rubric Used to Score Student Essays...84
Appendix C: Organizational Health Scale...86
LIST OF TABLES
Table 1 Sample Indicators for Source Category Mastery
Experiences (ME) ...13 Table 2 Sample Indicators for Source Category Physiological and
Emotional States (PES)...13 Table 3 Sample Indicators for Source Category Vicarious
Experiences (VE) ...13 Table 4 Sample Indicators for Source Category Social
Persuasion (SP) ...13 Table 5 Sample Indicators for Source Category Persistence in the
Face of Difficulty (PFD)...13 Table 6 Descriptive Statistics: Student Writing Achievement...44 Table 7 Summary of Numbers of Coded References by Source
Category and Indicator...45 Table 8 Numbers of Teacher Interviews Coded Positive, Neutral, and
Negative by Coder ...46 Table 9 Correlation of Combined Essay Ratings and Efficacy
Source Categories ...50 Table 10 Model Summary of Student Achievement and Efficacy
Source Categories Using Step-Down Multiple Regression...51 Table 11 Descriptive Statistics: District Health...52 Table 12 Model Summary of District Health and Efficacy Source
Categories Using Step-Down Multiple Regression ...52 Table 13 Descriptive Statistics: Means for High/Low Health Districts..53 Table 14 Test of Between-Subject Effects -- High and Low
CHAPTER 1 – INTRODUCTION
Social cognitive theory focuses on how humans use the capacity to reflect on social experience in order to learn, and understanding this relationship points the way to interventions that may enhance learning (Bandura, 1997). Two aspects of the theory are self-efficacy and teacher-efficacy, both of which have been shown to be related to achievement (Stajkovic & Luthans, 1998; Pajares, 1996, 2003; Tschannen-Moran, Wolfolk-Hoy, & Hoy, 1998). Self- and teacher-efficacy are indicators of the internalized belief in one’s capacity to bring about specific desired results. Teacher efficacy beliefs have also been shown to be related to teachers’ professional commitment, instructional practices and the academic achievement of their students (Ware & Kitsantas, 2007; Tschannen-Moran, Wolfolk-Hoy, & Hoy, 1998).
Historical Context
American education is no stranger to challenge, challenge that has inspired many improvements in schooling throughout our history. However, the early years of the twenty-first century bring together forces that may test the integral components of public education in ways never yet seen. Questions concern the focus of instruction, pressures regarding the quality of public education, the quality of individual schools and districts, and the indecision about the direction of professional development, and these come at a time when standardized testing has become the norm for assessment, the teaching force is being depleted by the retirement of the baby boomers, and education schools lack
sufficient candidates to meet the need for replacements. A closer look among these forces shows their interaction and the challenge to intervene in ways to set the system aright.
The timeline of American education indicates that well before the nation itself existed, laws in the colonies ensured the beginnings of a public education system. With a pattern of causes and effects driving change, the system has become a bedrock of
and mathematics instruction. By 1983, when A Nation at Risk anchored the educational reform movement, this graphic depiction painted a dire picture: “If an unfriendly foreign power had attempted to impose on America the mediocre educational performance that exists today, we might well have viewed it as an act of war. As it stands, we have allowed this to happen to ourselves. We have even squandered the gains in student achievement made in the wake of the Sputnik challenge. Moreover, we have dismantled essential support systems which helped make those gains possible. We have, in effect, been committing an act of unthinking, unilateral educational disarmament” (National Commission on Excellence in Education, 1983).
leaving the growth sector of American work to those prepared to work creatively with ideas (National Center on Education and the Economy, 2006).
Given this emerging paradigm, schools are seeking ways to shift from a factory-era model to a model of a true learning organization, anchored in the multiplicity of learning opportunities afforded by the digital age. As with any change, teachers and teaching are at the center of this shift. Pressures on teachers and schools are increasing and will continue to do so until the change paradigm gives way to that of the status quo. Currently, changes dated to the varied responses to A Nation at Risk include the impetus for states to develop grade-level and subject specific standards. The most dramatic and far reaching of these responses is the controversial No Child Left Behind Act of 2001. This federal law reauthorized the Elementary and Secondary Education Act (ESEA) of 1965, tightened the schools’ accountability for student success, and imposed sanctions for lack of progress. It placed requirements on states to set academic standards for students and measured the progress of districts and schools in meeting the standards with the 2014 goal of having all students proficient. The NCLB law also mandated states publish report cards on school districts and individual schools that show student progress toward
achieving proficiency by subgroups that include economic background, ethnicity, English language proficiency, and disabilities. These report cards must also show the
While the goals of No Child Left Behind cannot be faulted, the consequences have been far reaching and subject to diverse opinions and scrutiny. State testing has given rise to a multi-billion dollar industry ranging from test production and grading to curricular supplements aimed at preparing students for the test and remedial tutorial software. While tests are being viewed as a lever to change classroom practice, the already limited teacher availability for professional development is often co-opted by topics addressing test preparation as opposed to those improving instructional skills that would better prepare students to perform on the tests. Discouragingly, a 2003 survey of teachers indicated that 7 out of 10 perceive that the state test has required them to teach in ways contrary to their ideas of best practice (Pedulla, Abrams, Madaus, Russell, Ramos, and Miao, 2003).
As the severity of consequences attached to state tests increases, the impact of the tests on instructional practice and both teacher and student stress increases. In addition, the unintended consequences of the tests affect instruction. For example, the use of computers for writing instruction has declined because state writing assessments are hand written (Pedulla, et al., 2003). While No Child Left Behind has had sweeping effects on education, the speed of this impact has allowed little time for the thorough study that is needed and will no doubt come. However, Nichols and Berliner (2007), in citing a host of unintended consequences, note the outworking of what has come to be called
troubling may be the unintended consequences for the teaching profession. A small-scale study of twelve English teachers found them to be frustrated by testing’s impact on their instructional decision-making and enthusiasm for their jobs and concluded that the gains for student achievement may be overshadowed by the unintended consequence on the teaching profession, one in which the “deskilling of teaching. . . may not only push seasoned, talented teachers out of the profession, it may also invite a different kind of young person into the profession – a person more comfortable with standardized, teacher-proof curricula and less committed to a nuanced classroom practice that is informed by a knowledge of students and their communities” (Graham, P., Marshall, J., Power, C., & McWhorter, P. (2007), p. 4).
Much teacher efficacy research has focused on measurement, but increasingly there are calls for different kinds of studies to interpret the construct in light of teaching and learning (Tschannen-Moran et al., 1998; Henson, 2004; Labone, 2002; Wheatley, 2005). This study is anchored in teachers’ reflective interviews rather than in teachers’ self-assessment of their efficacy. The teachers’ self-reported practices in teaching writing while working in a school setting are related to student writing achievement and to
sources of efficacy that research has already determined (Bandura, 1986; Tschannen-Moran, Woolfolk-Hoy, & Hoy, 1998). By focusing on only one content area, writing, and attending to voluntarily self-reported practices and perceptions, a window into efficacy, a teacher’s confidence and competency to effect learning, may be seen. Rather than asking teachers to define their level of efficacy, this research draws on the
CHAPTER 2 – LITERATURE REVIEW Writing Instruction
The drive for human beings to express their thoughts and ideas in some written form can be seen in the archeological records from cave paintings and pictographs around the globe. From the ancient Greeks to the present, the ability to write well has been a fundamental measure of public power and as such, a central part of education. Tracing the history of writing instruction, as James Murphy (2001) does, provides insight into the values of a society. In ancient Greek society, writing became accessible beyond the elite and its power in sustaining democracy was demonstrated. The Roman society
reciprocally valued both speaking and writing giving rise to writing for eloquence as well as expression of ideas. The Middle Ages saw the rise of letter writing using the
another, one generation to the next. It is a process of learning and hence, of education” (Gregorian, 2007, p. 2).
However, in the world of literacy education, teaching writing has long played second fiddle to teaching reading. Partially due to popular misconceptions like “writers are born not made,” teaching writing has lacked urgency, but the necessity of writing in the current information age, paired with the current era of accountability through test scores, is casting new light on the pedagogy of writing instruction. Reports by the National Commission on Writing (2003, 2004, 2005, 2006) have brought the necessity for stronger writing instruction to the spotlight. According to the National Assessment of Educational Progress in 2002, seventy percent of students in grades 4–12 are
low-achieving writers, with growth in writing flattening out beginning in middle school and continuing to flatten or decline in high school (Persky, Daane, & Jin, 2003). ACT reports that nearly one third of high school graduates are not ready for college-level English composition courses (2005). Achieve, an organization created by the nation’s governors and business leaders to help states raise academic standards and achievement so that students graduate better prepared for the demands of college, work, and twenty-first century life, reports that college instructors estimate that half of high school graduates are not prepared for college-level composition classes (2005). Clearly, we need to know and do more to support the teaching of writing.
rhetorical strategies. In fact, this traditional model of writing instruction is still quite common today, although the process oriented approach is the premier instructional method that many states have designated for their curricular standards (Patthey-Chavez, Matsumura & Valdes, 2004) and is the implicit model advocated in all eleven strategies of the Writing Next: Effective strategies to improve writing of adolescents in middle and high schools meta-analysis (Graham and Perin, 2007). (See Appendix A.)
Janet Emig’s The Composing Processes of Twelfth Graders (1971), is the landmark study usually referred to as beginning process writing research, but the groundwork that allowed that study to fall on fertile ground had already begun. References to writing as a multi-step process occur earlier (Day, 1947; Mills, 1953; Cowley, 1958) while James Moffett’s Teaching the Universe of Discourse (1968) and James Britton’s Language and Learning (1970) prepare the way for process writing to change the landscape of writing instruction. Interest in improving writing instruction was fueled by the literacy crisis of the mid-1970s, with its blame on the public schools for failing students, a close parallel to today’s news citing student achievement declining in literacy and calling for improved instruction to meet the needs of the burgeoning
knowledge-based economy.
to the list of variables that writers were managing in the composing process. The writing process was considered to be linear until Flowers and Hayes’ (1981) work, followed by that of Bereiter and Scardamalia (1987), showed it to be more recursive. However, the definition of a process approach to teaching writing is somewhat elusive. Pritchard and Honeycutt’s (2006) review of the effectiveness of the process approach cites the
difficulty of pinning down the exact effect it has had on writing instruction as they trace the research history of the construct across various descriptions from the indirectly taught natural process to the more complex and current interacting set of stages and strategies.
Encompassing the process approach while it “eschews a singular formula for teaching writing” (Friedrich & LeMahieu, 2004, p.19), the National Writing Project is probably the most influential and well-researched professional development model for instructional practice. The National Writing Project contends that writing is a process that must be taught intentionally and systematically, although it does not espouse any single way to teach writing. The NWP model of teacher-led professional development emerging from groups of teachers coming together to write and explore their processes for writing has profoundly influenced professional development practices, but the difficulty of studying professional development (Pritchard & Marshall, 2002; Wilson & Berne, 1999) is comparable to that of studying the impact of writing instruction (De La Paz, S. & Graham, S., 2002).
writing pedagogy: “(1) dealing with the emotions surrounding writing, (2) developing students’ understanding of the writing process, (3) modeling and teaching self-regulation processes, (4) training and monitoring peer response partners and groups, (5) guiding writing development through targeted strategy instruction that addresses ideas and
content, organization, voice, word choice, sentence fluency, and conventions . . . , and (6) developing a writing vocabulary” (pp. 31-32). The similarity of these categories to Bandura’s (1986) sources of self-efficacy development – the interplay of one’s history of achievement in a particular context, vicarious or observational learning, arousal or one’s physiological state when performing the action, and persuasion of others – integrates writing instruction and the milieu of this investigation.
Five categories representing the Bandura’s (1986) sources of efficacy, plus one representing persistence based on Gibson and Dembo’s (1984) work validating the teacher-efficacy construct, were developed, incorporating the elements of the Pritchard and Honeycutt (2007) lesson foci. (See Tables 1-5.) Mastery Experiences, a category that encompasses many indicators of best practices in a process approach to teaching writing, includes targeted strategy instruction, support in understanding the writing process, teaching self-regulation strategies, use of peer groups for revision, and
Table 1. Sample Indicators for Source Category Mastery Experiences (ME) • Increased time on / for writing
• Focuses on the student as writer over the written product • Sets Process Goals for Students rather than performance goals
• Explicitly teaches writing skills: such as planning, revising, and text structures • Models and talks about, demonstrates own writing process
• Leads students to be metacognitive (reflective) about their own writing process • Uses rubrics to provide task specific responses
• Uses trained peer groups/small groups
• Shows confidence in teaching all aspects of writing, including grammar • Builds on students’ strengths/ successes
• Structures class for positive reinforcement/ teacher speaks encouragement • Teaches grammar in context
• Holds conferences for revision
• Helps students persist in revising until product is good
Table 2. Sample Indicators for Source Category Physiological and Emotional States (PES) • Confidence in self as a writer
• Creating classroom elements that reduce writing anxiety
• Providing emotional support in written and verbal responses to student writing • Teaching students to provide emotional support with each other
Table 3. Sample Indicators for Source Category Vicarious Experiences (VE) • Perceive project ideas easy to incorporate into their teaching. • Continued use of project methods after end of the project • Mention impact of professional development in teaching • Teacher takes credit for student achievement
Table 4. Sample Indicators for Source Category Social Persuasion (SP) • Teachers feel supported by administration
• Perceive a positive school and classroom atmosphere • Feel a sense of community
Table 5. Sample Indicators for Source Category Persistence in the Face of Difficulty (PFD) • Efforts to reach the unreachable
• Duration / intention to remain in the field
processes or from professional development in which the teacher observes and
participates in writing instruction. The category of Social Persuasion indicates elements related to interaction with others, including building and classroom level practices related to building community and supportive working relationships. Persistence in the Face of Difficulties is a category that deals with the tenacity of efforts to reach all students and indicators of intention to continue work with instructional practices, students, and schools. These categories connect writing pedagogy with the constructs of social cognitive theory to enable the teachers’ self-reported practices, as seen through texts of interviews, to be aligned to evidence of their efficacy beliefs.
Social Cognitive Theory
beliefs are positively related to teachers’ instructional practices and to the academic achievement of their students (Tschannen-Moran, Woolfolk-Hoy, & Hoy, 1998). This exploration begins from the theoretical underpinnings of teacher efficacy beliefs as mediators of instructional practice and leads to the interface with writing instruction and district health.
Observational learning occurs through attention span, retention processes, motor reproduction processes, and motivational processes. Attention span is the determiner of the particular information extracted from an observation, and often gives preferential attention to behaviors modeled by those most like or most associated with the observer. Retention processes allow the symbols from observed behavior to be stored in memory; their retrieval and use coming through the motor reproduction processes. Motivation, the degree to which a behavior is valued as producing a desired outcome, influences the likelihood of its becoming a modeled behavior (Bandura, 1986).
The interaction of forethought, self-regulatory and self-reflective capacities account for other behaviors. Forethought, the capacity to guide actions by anticipating outcomes, leads to the development of expectations, which create incentives or actions through the self-regulatory capability. Self-regulation allows internal control
mechanisms to develop and substitute for external controls of behavior. Motivational standards work through a process of discrepancy production, goal-setting, and
particular context, vicarious or observational learning, arousal or one’s physiological state when performing the action, and persuasion of others (Bandura, 1986).
Self-Efficacy in Writing
Given that self-efficacy beliefs seem to be a more consistent predictor of outcomes than other self-beliefs (Graham and Weiner, 1996), much research has been directed toward it and some of that research deals with self-efficacy in writing. Since self-efficacy is very context dependent, it is important that efficacy assessment instruments be carefully matched to the specific task. Three methods of measuring writing self-efficacy have been most frequently used with good reliability -- measuring confidence in writing skills, in completing writing tasks, or in obtaining a specific grade on writing products (Pajares, 2003). In each of these methods, getting accurate, reliable information depends on a careful understanding of the specific demands of the writing being investigated, making the assessment tools only partially transferable across writing tasks and domains.
1993; Zimmerman & Bandura, 1994). One complexity any research into writing
achievement must consider is the issue of lack of control for previous writing experiences which were themselves influenced by these affective factors. Given that the studied writing experiences were also affected by previous self-efficacy beliefs, it is possible that the influence of these factors could be greater than effect sizes would indicate and, in any case, these factors should be kept in mind when interpreting these data (Pajares, 2003).
stories than their peers. This knowledge was generalized into informational writing, but the strategy instruction had no effect on their self-efficacy scores (Graham, Harris & Mason, 2005).
Given the importance of self-efficacy beliefs to students’ writing performance, teachers’ choices of classroom practices and interactions can foster students’ self-efficacy beliefs as well as their growth as writers. Classroom practices, such as writers’ workshop (Atwell, 1998; Calkins, 1994), that support students in both the emotional and cognitive aspects of writing should help foster students’ self-efficacy beliefs. The additive impact of successful writing experiences increases motivation and the probability of continued growth as a writer. The positive verbal responses that teachers give to students convey their capacity to write. Schunk’s (2003) work with modeling, goal setting, and self-evaluation suggests that teachers should make task-specific comments about student successes and attribute the success to process strategies that have been taught in the classroom. His work suggests that teachers include the extensive use of cognitive
modeling, a Think Aloud, in which the writer models the problem-solving strategies used in the writing task; cooperative groups, including peer groups, as models for students; support for fostering students’ ability to set goals and to evaluate their own performances; and strategies, including goal-setting strategies, that are directly taught, (Schunk, 2003; Schunk & Swartz, 1993). Changing the assessment context so that it reflects a learning orientation can help students focus on learning processes and their capacity to use
Teacher Efficacy
If students’ self-efficacy beliefs influence their ability to perform academically, it is no surprise that teacher-efficacy beliefs should also influence their work. However, the impact of teacher-efficacy extends beyond their own work to their students’ performance, making teacher-efficacy a rich venue for study. Teachers’ efficacy beliefs are a self-assessment of their capacity to bring about student engagement and learning. They influence how much effort they will put forth, how long they will persist in the face of difficulties, how resilient they are in demanding situations, and how much stress or depression they experience. Those with higher efficacy show greater persistence and resilience with lower levels of stress and depression (Bandura, 1986; Ware & Kitsantas, 2007). These indicators are largely reflected in the category labeled Persistence in the Face of Difficulties. In 1977, Bandura identified teacher-efficacy as a type of self-efficacy (Tschannen-Moran et al., 1998) and a great deal of research has focused on defining and measuring it.
use of project methods after the end of project funding (Tschannen-Moran et al., 1998). The two items in the RAND study became determiners for two subsets of the teacher efficacy construct. Teachers’ beliefs about the power of external factors have been labeled general teaching efficacy (GTE), and beliefs about their own teaching is labeled personal teaching efficacy (PTE). Higher general and personal teaching efficacy have been shown to be related to greater student achievement, increased teacher willingness to introduce innovation, longer intention of remaining in the field, and lower stress levels (Tschannen-Moran et al., 1998).
Guskey (1981) developed a thirty-item inventory for measuring responsibility for student achievement. Teachers were asked to distribute 100 percentage points on a continuum that ranged from being caused by the teacher to occurring because of events outside the teacher’s control. In general, teachers took more responsibility for positive outcomes than for negative ones. Gibson and Dembo (1984) developed a more reliable measurement tool for teacher efficacy by merging the RAND items with Bandura’s work on social cognitive theory. Their instrument contained thirty items marked on a six-point Likert scale ranging from strongly disagree to strongly agree. The Gibson and Dembo instrument has been the most widely used measure of teacher efficacy. With it,
researchers have solidified the general teacher efficacy and the personal teacher efficacy factors, finding that in studies of both preservice and inservice teachers between 18% and 30% of the variance can be explained by these two factors (Tschannen-Moran &
these teachers would persist longer in working with students having difficulty. These teachers would have a stronger academic focus in their classrooms, be more likely to divide the class for small group activities, and be less likely to be critical of a student who gave an incorrect response than would those who scored low on the teacher efficacy measures. Teacher efficacy measured with the Gibson and Dembo scale has been related to openness to new ideas as well as to influence on their students’ achievement, attitudes, and affective growth (Tschannen-Moran et al., 1998).
Teacher efficacy is seen as being both context and subject-matter specific
(Tschannen-Moran & Woolfolk-Hoy, 2001). Therefore, it has proved difficult to use one instrument for a variety of research purposes. The Gibson & Dembo (1984) scale has been widely adapted to look at specific teaching tasks and behaviors, including science teaching, classroom management, and special education (Tschannen-Moran et al., 1998). Still there is little movement toward one means of measuring teacher efficacy. In fact, Bandura has suggested that teachers’ efficacy is probably not uniform in all the varieties of tasks that are encompassed in teaching and suggested the following seven subscales: “efficacy to influence decision-making, efficacy to influence school resources,
instructional efficacy, disciplinary efficacy, efficacy to enlist parental involvement, efficacy to enlist community involvement, and efficacy to create a positive school climate” (Tschannen-Moran & Woolfolk-Hoy, 2001, p. 791).
twelve item form that uses a 9-point scale with anchors at 1-nothing, 3-very little, 5-some influence, 7- quite a bit, and 9-a great deal. Studies show the instrument to be reasonably reliable and valid. With this instrument capturing more aspects of teaching, it shows promise for looking at how teacher efficacy develops from preservice through the career cycle and may shed light on issues of teacher induction and retention (Tschannen-Moran & Woolfolk-Hoy, 2001).
The correlation of teacher efficacy beliefs to innovation and persistence of change in practices is of particular interest. Change is always stressful and that stress is reflected in teacher efficacy scores. In the midst of a change process, teacher efficacy scores seem to go down, then rise. Upon initiating a change in practice, teacher efficacy scores fall but as improvements in student achievement are seen due to the new skills and practices, scores rebound to higher levels (Ross, 1994; Stein & Wang, 1988; Guskey, 1986). Among teachers exposed to new methods, those with higher efficacy scores tend to view the new methods as being more important, less difficult to implement, and more
consistent with their own teaching practices than do those with lower efficacy scores (Guskey, 1988; Ware & Kitsantas, 2007).
Sources of Efficacy and Writing Instruction
With the four sources of efficacy identified by Bandura (1986) and the additional element of persistence as identified by Gibson and Dembo (1984), categories of five sources of efficacy align to elements of best practice in teaching writing (Pritchard & Honeycutt, 2007) and were used in the current study to classify indicators of higher efficacy in teachers’ self-reported practices in writing instruction. These categories are the provision of Mastery Experiences (ME), attention to Physiological and Emotional States (PES), use of Vicarious Experiences (VE), use of Social Persuasion (SP), and Persistence in the Face of Difficulties (PFD). For example, classroom practices
Harris, Fink, & MacArthur, 2001), focusing more on the student as writer than on the written product, setting process goals rather than performance goals, building on students’ strengths and successes (Schunk, 2003; Schunk & Swartz, 1993).
The Mastery Experiences category includes many practices commonly thought of as direct teaching of writing. (See Table 1 for sample indicators.) Practices classified as Mastery Experiences, or more accurately the provision of Mastery Experiences, include the explicit teaching of writing strategies, how much time was devoted to teaching writing in successful experiences with writing. It also includes the stance the teacher takes regarding successful experiences with writing and the stance the teacher takes regarding the relative importance of the student as writer to the importance of the written product itself.
helping students think metacognitively (use self-regulation strategies) on their writing process also fell under the Mastery Experiences category (Pritchard & Honeycutt, 2007).
Bandura’s (1986) source referred to as “physiological arousal” relates well with the power of emotions that impact writing (Rose, 1985; Csikszentmihalyi, 1990; Maisel, 1999). Practices dealing with emotional support are captured in the category labeled Physiological and Emotional States. (See Table 2 for sample indicators.)
Teachers who reported attending to the reduction of writing anxiety and providing emotional support in their written and verbal responses to student writing rated positive for high efficacy in this category (Schunk, 2003). Other ways of building safety for the student to take risks as a writer and teaching students positive ways of responding to one another as writers are also included in this category in the current study.
practice and the continued use of practices learned in professional development after the end of the training (Ross, 1994; Stein & Wang, 1988; Guskey, 1988; Guskey, 1986). (See Table 3 for sample indicators.)
Closely related to the category of vicarious experiences is that of Social Persuasion. (See Table 4 for sample indicators.) Higher teacher efficacy has been associated with characteristics related to building and district-level factors (Ware & Kitsantas, 2007; Ross, Hogaboam-Gray & Gray, 2003; Goddard, 2001; Tschannen- Moran et al., 1998; Hipp & Bredeson, 1995; Hoy & Woolfolk, 1993; Moore and
Esselman, 1992; Lee et al., 1991; Ashton and Webb, 1986) that connect to district health and student achievement in writing (Pritchard & Marshall, 2002; Pritchard, Morrow, and Marshall, 2005). Bandura (1997) cites the powerful impact of social factors within and outside the school community on student achievement through the mediation of teachers’ self-efficacy beliefs. In the social persuasion category, indicators such as teachers feeling supported by the administration, the perception of the school or classroom as a
community, and evidence of a sense of ownership and capacity to impact school decisions and success would be found.
& Dembo, 1984) and are less likely to refer difficult students to special education (Meijer & Foster, 1988; Podell & Soodak, 1993; Soodak & Podell, 1993). Indicators for
persistence included the above factors as well as other indicators of efforts to teach students who seem hard to reach.
Teacher Efficacy in School Contexts
Since social cognitive theory posits reciprocal determinism between the
environment and personal factors, looking at how school context impacts teacher efficacy has yielded interesting results. In two studies, high school teachers were asked to use the RAND measure to rate their personal teaching efficacy for each of the classes they taught (Raudenbush, Rowen, Cheong, 1992; Ross, Cousins & Gadalla, 1996). They found teacher efficacy to be lower for nonacademic track classes than for academic and honors classes. School context also affects teacher efficacy. Moore and Esselman (1992) found that teacher efficacy was higher when teachers perceived a positive school atmosphere and the ability to influence decision-making beyond the classroom. Lee, Dedick, and Smith (1991) found a sense of community in the school to be the single greatest predictor of teacher efficacy. Teachers felt more efficacious when their school environment was supportive and respectful, with administration and staff sharing a single vision and common values.
within the building to provide resources and to buffer teachers from disruptive aspects while allowing them flexibility within their classrooms, efficacy increased (Lee et al., 1991). Higher general teacher efficacy was associated with having a principal who inspired a sense of purpose in the faculty (Hipp & Bredeson, 1995). In one of very few qualitative studies, Ashton and Webb (1986) found organizational structures, such as a middle school model with teachers in interdisciplinary teams and fewer students rather than a junior high model with individual classrooms divided into content area
departments, to be related to higher teacher efficacy. Middle school teachers also had higher expectations for their students and were more satisfied with teaching as a career.
conducted on this cycle (Tschannen- Moran et al., 1998). In the current climate of accountability, collective efficacy appears to be an area ripe for further study.
While there have been many years of study on teacher efficacy, most of those studies have focused on various forms of its measurement rather than its practical use in the field. Increasingly there are calls to make the construct more valuable for both pre- and inservice educators (Wheatley, 2005). The complexity of the meaning of teacher efficacy scores and the interrelatedness of its sources make interpreting or enhancing efficacy difficult. Much of the difficulty may be due to the almost exclusively quantitative research on measuring the construct, and there have been calls for more qualitative research into the construct (Tschannen-Moran et al., 1998; Henson, 2004; Labone, 2002; Wheatley, 2005). Labone (2004) sees the need for broadening the construct to explore interpretations of teacher efficacy and enhance its potential to guide educational reform. Wheatley (2005) also calls for more interpretative research
encompassing “elements that make it [teacher efficacy] a coherent and meaningful belief for an individual teacher” (p. 759). Henson (2002) calls for intensive qualitative research because “To fully understand the relationships between the sources of efficacy
information, the meaning teachers attach to this information, and any ultimate change in their efficacy beliefs, in-depth study of teachers is necessary” (p. 147).
Teacher Efficacy and School Climate
able to influence student learning, resulting in higher teacher efficacy scores (Hoy & Woolfolk, 1993). School climate has been shown to affect student achievement with the influence persisting several years (Hoy, Hannum, & Tschannen-Moran, 1998). While much research has been done with teachers and the health of their schools, fewer studies have addressed the larger issues of the health of districts that run the schools and set the parameters that subtly or directly affect schools’ capacity to impact student achievement. Pritchard and Marshall (2002) have developed an Organizational Health Scale that can be used with districts based on Kanter’s (1983) concept of a Culture of Pride and Climate of Success. The Culture of Pride and Climate of Success is embodied in organizations that build emotional connections between the individual and the organization that provide a feeling of belonging which supports the realization of individual goals while the individual also contributes to the work of the organization. The Organizational Health Scale looks broadly at district health through the interaction of assumptions, values and norms operating within the organization (Pritchard & Marshall, 2002). This instrument addresses issues of “philosophical orientation toward learning for students and faculty; origin of responsibility for problems and solutions as outside or inside the school system; fit of beliefs and focus across all levels of the district; pattern of leadership; and
organization, while mistrust and isolation characterize unhealthy districts. In a
subsequent study, a high correlation between the degree of implementation of Deming’s 14 points for Total Quality Management and the organizational health of school districts was found. High health districts were more likely to exhibit a constancy of purpose, philosophically adopting continuous improvement, as well as reducing dependence on mass inspections, such as standardized testing, to ensure that the focus remained on teaching and learning. There was also significant correlation to high student achievement in the healthy districts (Marshall, Pritchard, & Gunderson, 2004).
CHAPTER 3 – METHODOLOGY
This study is embedded within a larger study of the characteristics of districts that had successfully implemented a nationally disseminated teacher-led staff development program in writing (Marshall, Pritchard, & Gunderson, 2000, 2001, 2004; Pritchard and Marshall, 2002). The researchers made site visits, averaging five days in length, to eighteen randomly selected school districts in the U.S. drawn from a national sampling frame consisting of over 1,500 sites which had participated in the same teacher-led staff development initiative in writing. The researchers collected over 400 hours of interviews from trainers, teachers, principals, central office administrators, and others who might shed light on system characteristics which support or impede district health. These vocal recordings were transcribed, creating texts for analysis. While on site for four to five days, the researchers studied a broad spectrum of artifacts such as school and district goals, planning documents, student assessments, photographs, bulletin boards,
professional development offerings, and other pertinent material. Student compositions written on the topic of their schools were collected and analyzed from more than 2,000 students in randomly selected classrooms in grades 4, 8, and 11. This study only draws on student compositions from grades 8 and 11 from teachers who were also interviewed.
districts. Each middle or high school teacher in the sample provided student essays which were scored for writing quality in the previous study (Marshall, Pritchard, & Gunderson, 2000, 2001, 2004; Pritchard and Marshall, 2002). For this study, only essays contributed by middle and high school English teachers were used and these were derived as follows: 320 from schools in high health districts; 264 from schools in moderate health districts; 410 from schools in low health districts, for a total of 994 essays (N = 994). Writing Achievement, district health, and placement of teachers in high or low-health districts had been determined in prior research, but this information was not available to the researcher or to those coding the interview transcripts in the current study.
In the previous study (Marshall, Pritchard, & Gunderson, 2000, 2001, 2004; Pritchard and Marshall, 2002), 1,283 student papers written on the topic of the student’s school were scored by two independent readers (Pritchard, Morrow, & Marshall, 2005). A 6-point rubric for quality of writing was developed. (See Appendix B.) Anchor papers were identified for each score point in a 6-point scale. Two experienced teachers at different grade levels were trained to apply the scale using the anchor papers. Working independently, the teachers scored each paper. If scores differed by more than one point, a third rater scored the paper. In subsequent analysis, inter-rater reliability was
In the previous study (Marshall, Pritchard, & Gunderson, 2000, 2001, 2004; Pritchard and Marshall, 2002) the districts in which the teachers worked were classified as to district health according to an analysis using the Organizational Health Scale (Pritchard and Marshall, 2002). (See Appendix C.) A district was classified as having a high/positive health if its total score on the Organizational Health Scale was 12-20, moderate/mixed if its score was 9-11, or low/negative if its score fell between 0-8. The health ratings of the 13 districts in this sample were not known to the researcher or those coding interviews in the current study.
characteristics that support or impede a culture of continual improvement. They gathered nearly 3,000 essays from students at grades 4 (age 9), 8 (age 13), and 11 (age 16) writing about their schools. Additionally, photographs and documents such as school and district improvement plans, professional development offerings, trends in student achievement, accreditation studies, district policy manuals, etc. were collected and reviewed to determine district health.
The sample for this study was a subset of that group and was determined
according to the criteria of teachers’ level and content area being middle or high school English, of teachers having been interviewed, and of their students having submitted papers which had been scored. The resulting sample of 32 teacher interviews from 13 different districts and 21 schools comprised the data set for this study. Of these, 9 classrooms in 4 districts had been classified as having high/positive district health, 9 classrooms in 4 districts had been classified as having moderate/mixed district health, and 14 classrooms in 5 districts had been classified as having low/negative district health).
Research Hypotheses
This study delineates five categories of elements relating to evidence of efficacy. Bandura (1986) cites four of these as direct sources of efficacy: the interplay of one’s history of achievement in a particular context, arousal or one’s physiological state when performing the action, vicarious or observational learning, and persuasion of others. Additionally, persistence in the face of difficulties (Gibson and Dembo, 1984) has been shown to correlate to high efficacy and was thus included as an indicator of efficacy. These five elements provided categories of teaching practices that were rated, as indicators of teacher efficacy in writing. (See Appendix D.) Since one of Bandura’s (1986) sources of efficacy is history of achievement in the subject, looking for
teaching practices. The category of Persistence in the Face of Difficulties might be indicated by efforts to reach difficult students or duration of efforts to implement successful practices learned in professional development.
Procedures for Coding Teacher Practice
Pritchard and Marshall (2002) interviewed teachers with an open-ended protocol that included questions about professional development in writing, each teacher’s practices in teaching writing, building-wide writing instruction, issues related to school and district health. The teacher interviews had been transcribed and were assigned random numbers for identification in the coding for this study. The coding was
completed without any indication of student writing achievement levels or district health scores.
Using the literature-based sources of efficacy categories, lists of indicators representing each category were determined. (See Tables 1-5.) After training in
equivocal or for categories in which no indicators were found. Once this initial coding of indicators was complete in each interview, every efficacy source category for each interview was then assigned a score for negative or low efficacy, neutral, or positive or high efficacy practice of the indicators based on the preponderance of evidence in each category. (See Appendix D.) For indicators with impact in more than one category, raters were asked to mark the practice in each category that applied.
The inter-rater agreement was determined for scoring in the sources of teacher efficacy categories. It was expected that the inter-rater reliability would be high because the indicators were explicitly defined and raters trained for coding interviews. However, when scores were analyzed and inter-rater reliability was checked, it was determined that one coder was significantly out of line with the ratings of the other two. Therefore, the researcher made a determination to eliminate the outlier’s scores, leaving the analysis based on two coders.
The ratings within each category were combined for the two coders and the mean scores (total of references divided by the number of references) determined. These raw scores were converted to z-scores to standardize the score distributions. Each category was given an efficacy score for each teacher.
Hypothesis: Sources of Teacher Efficacy Related to Student Achievement
separate factor in predicting student achievement. The student achievement scores were based on combined scores, with a possible range of 2 to 12, on quality of essays as determined through holistic evaluation by two raters using a 6-point scale, with 6 being high. Average writing scores for each teacher interviewed were determined. Given that the variables were normally distributed, linearly aligned, measured reliably, and indicated homoscedasticity, these four assumptions for the use of multiple regression were met (Osborne & Waters, 2002). Appropriate statistical procedures were determined. With each category independently identified in each of the 32 teacher interviews, normally distributed, and analyzed regarding the single independent variable of student writing achievement, the relation between teacher efficacy and student achievement was then determined using step-down multiple linear regression analysis.
Hypothesis: Sources of Teacher Efficacy Related to District Health
There is a significant positive relationship between the level of teacher efficacy and district health. The purpose of this part of the research was to determine whether there is a relation between categories indicating high teacher efficacy as evidenced in interviews and district health that researchers identified using the Organizational Health Scale in a prior study (Pritchard and Marshall, 2002).
CHAPTER 4 – RESULTS
Rather than asking teachers to measure their sense of efficacy or report on specific teaching practices that build efficacy, this study looked at efficacy through the lens of self-reported practices and focused on the relation that exists between efficacy source categories and student achievement in writing, then it took a second look at these categories with regard to district health. The sample for the study was comprised of 32 middle and high school English Language Arts teachers who had participated in
interviews about their beliefs and practices and who had provided on-demand writing samples from their students. The districts in which these teachers worked were randomly selected from a database of 1500 sites that had participated in the same teacher-led staff development in teaching writing (see Marshall, Pritchard, & Gunderson, 2000, 2001; Pritchard and Marshall, 2002). While the sample was small, the open nature of the interview process provided a window into teacher practice with little bias regarding the types of practices that researchers might expect to be reported in the teaching of writing.
Table 6. Descriptive Statistics: Student Writing Achievement
Mean Standard Deviation Number
Combined Essay Ratings – Mean Combined Essay Scores
8.4086 .96136 32
Mastery Experiences .0000 1.00000 32
Physiological and
Emotional States .0000 1.00000 32
Vicarious Experiences .0000 1.00000 32
Social Persuasion .0000 1.00000 32
Persistence in the Face
of Difficulties .0001 .99999 32
(N=994) the mean was 8.41 and a standard deviation of 0.96. Since the papers were scored for the full study the inter-rater reliability remains 0.92. (See Table 6.)
Using these lists of possible indicators generated for each category, raters color-coded the interviews, marking each instance in which the teacher spoke about using one of the practices listed or a similar practice and categorizing it as either a negative, neutral, or positive expression of the indicator. After marking all references to indicators of each category in each interview, each category in each interview was reviewed and given an overall negative, neutral or positive summative rating for practices in the category. Each source of efficacy category was rated either positive for high efficacy, neutral for equivocal or no references, or negative for low efficacy.
Source Category: Mastery Experiences
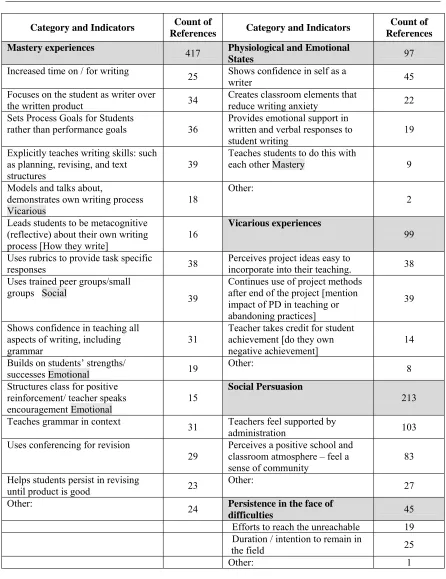
Table 7. Summary of Numbers of Coded References by Source Category and Indicator
Category and Indicators Count of
References Category and Indicators
Count of References
Mastery experiences 417 Physiological and Emotional
States 97
Increased time on / for writing 25 Shows confidence in self as a
writer 45
Focuses on the student as writer over
the written product 34 Creates classroom elements that reduce writing anxiety 22 Sets Process Goals for Students
rather than performance goals 36 Provides emotional support in written and verbal responses to
student writing 19
Explicitly teaches writing skills: such as planning, revising, and text
structures 39
Teaches students to do this with
each other Mastery 9
Models and talks about,
demonstrates own writing process
Vicarious 18
Other:
2
Leads students to be metacognitive (reflective) about their own writing process [How they write]
16 Vicarious experiences 99
Uses rubrics to provide task specific
responses 38 Perceives project ideas easy to incorporate into their teaching. 38 Uses trained peer groups/small
groups Social 39 Continues use of project methods after end of the project [mention impact of PD in teaching or abandoning practices]
39
Shows confidence in teaching all aspects of writing, including
grammar 31
Teacher takes credit for student achievement [do they own
negative achievement] 14 Builds on students’ strengths/
successes Emotional 19
Other: 8
Structures class for positive reinforcement/ teacher speaks
encouragement Emotional 15
Social Persuasion
213
Teaches grammar in context 31 Teachers feel supported by
administration 103
Uses conferencing for revision
29 Perceives a positive school and classroom atmosphere – feel a sense of community
83
Helps students persist in revising
until product is good 23 Other: 27
Other: 24 Persistence in the face of
difficulties 45
Efforts to reach the unreachable 19 Duration / intention to remain in
the field 25
Table 8. Numbers of Teacher Interviews Coded Positive, Neutral, and Negative by Coder
Positive Neutral Negative Category
Coder 1 Coder 2 Coder 1 Coder 2 Coder 1 Coder 2
Mastery Experiences 25 22 7 9 0 1
Physiological and
Emotional States 17 14 14 17 1 1
Vicarious
Experiences 13 12 19 17 0 3
Social Persuasion 15 12 15 15 2 5
Persistence in the
Face of Difficulties 8 7 24 25 0 0
In this category, the correlation coefficient for coders was .788 (p<.01). Reporting sufficient practices to be scored positive, Coder 1 identified 25 teachers while Coder 2 identified 22. With neutral levels of reported practices in this category, 7 teachers and 9 teachers were identified by the coders respectively. One teacher was coded as having negative practice by one coder. (See Tables 7 and 8.) Examples of indicators supporting a positive rating included practices such as teaching grammar in context, having student revise until the product is good, and/or using peer groups. A negative rating was
supported by practices such as teaching grammar in isolation, grading student writing without revision, and/or assigning writing without teaching component skills
Source Category: Physiological and Emotional States
level. Coder 1 identified 17 teachers as positive, 14 as neutral, and 1 as negative. Coder 2 identified 14 teachers as positive, 17 as neutral, and 1 as negative. (See Tables 7 and 8.) Examples of practices supporting a positive rating included attention to reducing writing anxiety, responding to student papers in an emotionally supportive way, and/or teaching students to respond supportively to one another’s writing. Examples of practices that might lead to a negative rating included inattention to emotional
components of writing, grading without response to content of writing, and/or expressing a lack of confidence in writing.
Source Category: Vicarious Experiences
The practices classified as incorporating the use of vicarious experience were also reported somewhat less frequently with 99 total references. The correlation coefficient for Coders 1 and 2 in this category was .749, again indicating significance at the 0.01 level. Coder 1 identified 13 teachers reporting as positive and 19 as neutral. Coder 2 identified 12 teachers as positive, 17 as neutral, and 3 as negative. (See Tables 7 and 8.) Examples of positive practice included continued use of methods learned in professional development and/or the perception that new practices learned in professional
Source Category: Social Persuasion
The practices classified as social persuasion were also frequently reported with 213 total references, but these varied more broadly across the levels of positive, neutral, and negative. The correlation coefficient for Coders 1 and 2 in this category was .754, again indicating significance at the 0.01 level. Coder 1 identified 13 teachers as positive, 15 as neutral, and 2 as negative. Coder 2 classified 12 teachers as positive, 15 as neutral, and 5 as negative. (See Tables 7 and 8.) Positive ratings in this category were supported by indicating efforts to create community in the classroom, perceiving a supportive community in the school, and/or feeling supported by school administration. Negative ratings were supported by indicators such as neglect for building classroom community, remaining isolated from other teaching in the school or department, and/or perceiving a lack of support from administration.
Source Category: Persistence in the Face of Difficulties
by indicators such as lack of persistence with students having difficulty or expressing the intention of leaving the field.
Variability in Coded References
Given the open nature of the interview protocol, the relative frequency of remarks about each efficacy source category may reflect teachers’ general knowledge of practices that relate to the teaching of writing in their schools. The category of Mastery
Experiences contained practices that are most overtly related to teaching writing and so teachers probably reported on these direct practices most often. Other categories
contained practices that teachers might not have been aware of as relating to their writing pedagogy and so these may have been less frequently reported. The advantage of an open protocol was that it provided a less biased window into the subject’s view
of writing pedagogy; however, not being prompted in specific directions may mean that some practices in use may not have been articulated.
Table 9. Correlation of Combined Essay Ratings and Efficacy Source Categories
Pearson
Correlation Essay Ratings Mastery Experiences Physiological & Emotional States
Vicarious
Experiences Social Persuasion Persistence in the Face of Difficulties
Essay Ratings 1.000 -.223 .032 -.085 -.027 .247
Mastery Experiences
1.000 .114 .412** .264 .060
Physiological &
Emotional States 1.000 .624** .174 .239
Vicarious
Experiences 1.000 .252 .205
Social Persuasion 1.000 .050
Persistence in the Face of
Difficulties
1.000
All ratings were standardized by converting to z scores. * p ≤ .05 ** p ≤ .01
category rating of positive, neutral, or negative, so these differences do not impact the results determined from the count.
Relation of Student Writing Achievement to Efficacy Source Categories
The correlation of the student essay ratings to each efficacy category was
calculated. No source category was significantly related to student writing achievement. Two categories, Mastery Experiences and Physiological and Emotional States, yielded significant results at the .01 level when correlated to the category of Vicarious
Experience. The correlation coefficient for Mastery Experiences was .412 and the correlation coefficient for Physiological and Emotional States was .624. (See Table 8.)
Table 10. Model Summary of Student Writing Achievement and Efficacy Source Categories Using Step-Down Multiple Regression
Model Predictors R R Square
PFD, SP, ME, PES, VE (All Categories) .349 .122
PFD, ME, PES, VE .348 .121
PFD, ME, VE .346 .120
PFD, ME .343 .118
PFD .247 .061
ME = Mastery Experiences PES = Physiological and Emotional States VE = Vicarious Experiences SP = Social Persuasion
PFD = Persistence in the Face of Difficulty
12.2% of the variance in student achievement is accounted for by using all categories
6.1% of the variance in student achievement is accounted for by Persistent in the Face of Difficulty
Then, in each subsequent step of the regression, a removal statistic was calculated to determine the least useful category to the model which was then removed. When residuals were accounted for and the R-square was determined, 12.2% of the variance was accounted for using all categories while 6.1% of the variance was accounted for by the Persistence in the Face of Difficulties category.
Relation of District Health to Efficacy Source Categories
With thirty-two subjects, the combined district health ratings yielded a range of scores from 0-12 with a mean of 9.625 and a Standard Deviation of 4.897. Correlations between teacher ratings for efficacy sources were not significantly (p >.05) related to district health. (See Tables 11 and 12.)
Table 11. Descriptive Statistics: District Health
Mean Standard Deviation Number
Combined Health Ratings – Mean Combined Health Ratings
9.6250 4.8973 32
Mastery Experiences .0000 1.0000 32
Physiological and
Emotional States .0000 1.0000 32
Vicarious Experiences .0000 1.0000 32
Social Persuasion .0000 1.0000 32
Persistence in the Face
of Difficulties .0001 .9999 32
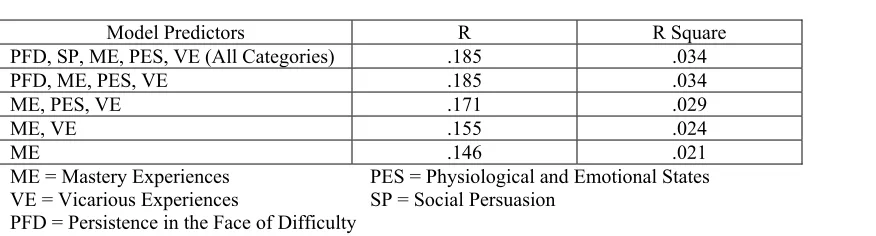
Table 12. Model Summary of District Health and Efficacy Source Categories Using Step-Down Multiple Regression
Model Predictors R R Square
PFD, SP, ME, PES, VE (All Categories) .185 .034
PFD, ME, PES, VE .185 .034
ME, PES, VE .171 .029
ME, VE .155 .024
ME .146 .021
ME = Mastery Experiences PES = Physiological and Emotional States VE = Vicarious Experiences SP = Social Persuasion
PFD = Persistence in the Face of Difficulty
3.4% of the variance in student achievement is accounted for by using all categories 2.1% of the variance in student achievement is accounted for by Mastery Experiences
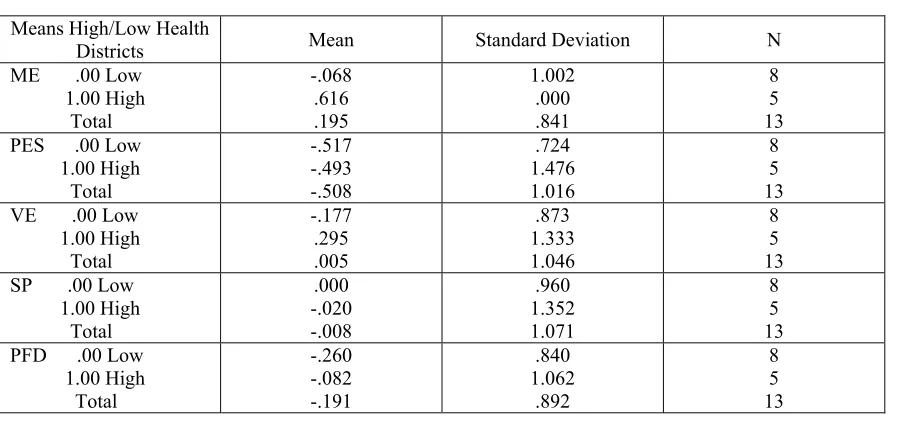
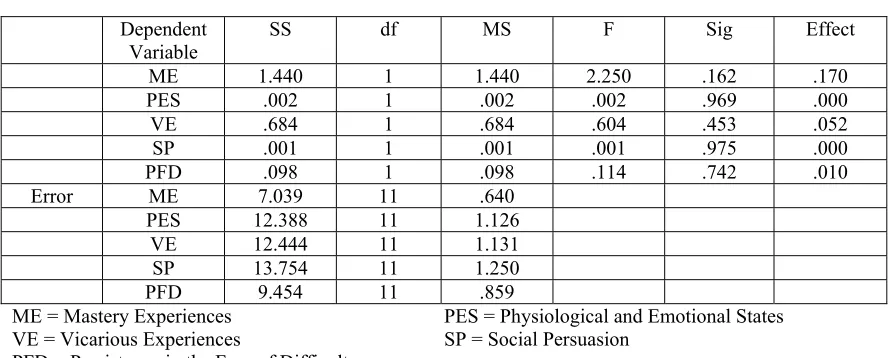
Teacher efficacy ratings were then analyzed in groups of high versus low health districts. Means for each source category by groups of high and low health districts were determined. (See Table 13.) Eight teachers taught in districts with a low health rating, while 5 taught in high health districts. A multiple analysis of variance (MANOVA) was used to analyze the data. (See Table 14.) Four of the five categories had low effect sizes when compared to district health. The fifth category, Mastery Experiences had a large effect size of .17.
The teachers in low health districts had a negative practices rating of -.068 while the teachers in high health districts had a positive practices rating of .616. This suggests that teachers in high health districts were more likely to use practices indicative of higher efficacy than the teachers in low health districts.
Table 13. Descriptive Statistics: Means for High/Low Health Districts
Means High/Low Health
Districts Mean Standard Deviation N
ME .00 Low 1.00 High Total -.068 .616 .195 1.002 .000 .841 8 5 13 PES .00 Low
1.00 High Total -.517 -.493 -.508 .724 1.476 1.016 8 5 13 VE .00 Low
1.00 High Total -.177 .295 .005 .873 1.333 1.046 8 5 13 SP .00 Low
1.00 High Total .000 -.020 -.008 .960 1.352 1.071 8 5 13 PFD .00 Low
Table 14. Test of Between-Subject Effects -- High and Low District Health
Dependent Variable
SS df MS F Sig Effect
ME 1.440 1 1.440 2.250 .162 .170
PES .002 1 .002 .002 .969 .000 VE .684 1 .684 .604 .453 .052 SP .001 1 .001 .001 .975 .000 PFD .098 1 .098 .114 .742 .010 Error ME 7.039 11 .640
PES 12.388 11 1.126
VE 12.444 11 1.131
SP 13.754 11 1.250
PFD 9.454 11 .859
ME = Mastery Experiences PES = Physiological and Emotional States VE = Vicarious Experiences SP = Social Persuasion
PFD = Persistence in the Face of Difficulty
CHAPTER 5 – DISCUSSION Limitations of Analytic Results
While these results suggest a relation between some categories of efficacy sources and student writing achievement and between some categories and teacher placement in high-health districts, there are reasons to use these results cautiously. With a relatively small sample size of 32 teachers, the indication of relation must be addressed carefully. More testing with larger groups of teachers is needed to corroborate these findings.
Some complexities were due to the nature of open interview protocols and even more to the coding for efficacy indicators in writing practice. The open interview
protocol provided strong evidence of the way teachers think about their writing pedagogy because the interview did not lead the teacher to comment on specific areas. However, since open interview protocols give little guidance about specific items to address, if the teacher was unaware of the importance of a practice in the realm of writing pedagogy, it may not have been mentioned and so received a neutral rating. Also, due to individual differences ranging from time available for the interview to personal volubility, some teachers may have commented more fully on aspects found in the categories than did others. Other teachers got caught up in some parts of their interviews and may not have gotten around to speaking of other aspects. However, the value of hearing the practices that the teacher viewed as most relevant offset some of the limitations of the protocol.