Copyright 0 1996 hv the Genetics Sorirty of America
Comparing Mutational Variabilities
David Houle,
*
Bob Morikawa"
Jand Michael Lyncht
*Department of Zoology, University of Toronto, Toronto, Ontario M5S 3G5, Canada and tDepartment of Biology, University of Oregon, Eugene, Oregon 97403-1 210
Manuscript received November 21, 1995 Accepted for publication April 15, 1996
ABSTRACT
We have reviewed the available data on I&, the amount of genetic variation in phenotypic traits produced each generation by mutation. We use these data to make several qualitative tests of' the mutation-selection balance hypothesis for the maintenance of genetic variance (MSB) . To compare VM values, we use three dimensionless quantities: mutational heritability,
vtf/&..;
the mutational coefficient of variation,Cytl;
and the ratio of the standing genetic variance toYtf,
VJ V,,. Since genetic coefficients of variation for life history traits are larger than those for morphological traits, we predict that under MSB, life history traits should also have larger CV,,. This is confirmed; life history traits have a median CV,, value more than six times higher than that for morphological traits. V,:/V, approximates the persistence time of mutations under MSB in an infinite population. In order for MSB to hold, V J V , must be small, substantially less than 1000, and life history traits should have smaller values than morpho- logical traits. V(;/ averages about 50 generations for life history traits and 100 generations for morpho- logical traits. These observations are all consistent with the predictions of a mutation-selection balance modelM
UTATION, as the source of all genetic variation,is ultimately responsible for both variation and
adaptation. A long-standing, fundamental debate in
evolutionary genetics concerns the strength of the rela- tionship between mutation and variation. The two most plausible mechanisms for the maintenance of variation are mutation-selection balance and various models of
balancing selection (BARTON 1990)
.
With mutation-se-lection balance, a steady input of mutation is necessary
to maintain genetic variance, so we expect a positive
correlation between mutation and variation. With bal- ancing selection, mutation need only produce alleles
leading to such polymorphisms infrequently, so muta-
tion and variation may be only weakly related.
An equally long-standing question concerns the rela- tionship between mutation and adaptation. On the one hand, a popular model of adaptation assumes that the standing variance in a population is the principal source
of the response to selection (e.g., LANDE 19'79). Under
this assumption, it is the amount of variation that limits the rate of adaptation. This justifies the widespread use of quantitative genetics in evolutionary biology. The extreme alternative view is that the alleles that poten- tially give rise to adaptations do not normally segregate in populations. In that case, the mutational processes
that give rise to advantageous genotypes would limit
the rate of evolution, regardless of the mechanism that
Corresponding author: David Houle, Department of Zoology, Univer-
sity of Toronto, 25 Harhord St., Toronto, Ontario M5S 3G5, Canada. E-mail: [email protected]
'
Present oddress: CAP-HAFF, 74 MFI, P.O. Box 15665, West Palm Beach, FL 33416.maintains standing variation. Under pleiotropic muta-
tion-selection balance models, much of the variation
segregating may be unconditionally deleterious ( KON-
DRASHOV and TURELLI 1992), and therefore not avail- able to promote adaptation. Under balancing selection, the same processes that maintain variation may retard the use of that variation in promoting adaptation. An understanding of mutation is therefore required to an- swer both the question of what maintains genetic vari- ance and the question of what determines the rate of response to selection.
For quantitative traits the parameter V,, the increase
in genetic variance due to a single generation of muta- tion, is important in models of both response to selec- tion and maintenance of genetic variation (LYNCH
1988; BARTON and TIJRELLI 1989). Even if all the varia-
tion is unconstrained by conflicting selection pressures,
further response will be limited by
Vw
if directionalselection is strong and prolonged for more than about
N,. generations, where N,. is the effective population size
(HILL 1982).
I&
thus may be of particular importanceas human-mediated changes in the environment chal- lenge a wide variety of species, particularly those with
the smallest populations ( LYNCH and LANDE 1992). In
addition, v, determines the rate of divergence in neu-
tral models of phenotypic evolution ( LANDE 1976b;
CHAKRABORTY and NEI 1982; LYNCH and HILL 1986;
LYNCH 1994)
.
To compare the variability of different traits, previous
reviews of have standardized estimates with the envi-
ronmental variance of the trait, V, ( LANDE 1976a; HILL
1982; LYNCH 1988). V,/V,: is the rate of increase in
heritability in an initially homozygous population, and therefore is called the mutational heritability. LYNCH'S
(1988) review confirmed previous generalizations that
the average V,/ value is about 1
x
10 -'. LYNCH alsoidentified considerable variation about this figure, al- though much of this may be due to sampling error. Mutational heritability is widely used in models of quan-
titative traits under stabilizing selection to eliminate V'
as a free parameter.
An alternative class of measures of mutational vari-
ability are those where VM values are standardized by
the trait mean, such as the mutational coefficient of
variation, C V , = 100 X
@,/x,
wherex
is the traitmean. These measures are valuable because an intu- itively reasonable way of standardizing the potential re- sponse to selection is relative to the trait mean ( W
DANE 1949). A rate of response to selection of 10% per
generation would always be regarded as high, and a rate of 0.01% low. Genetic coefficients of variation, in-
cluding CV,, are correlated with the potential propor-
tional response to selection (BURTON 1952; JOHNSON
et al. 1955; CHARLESWORTH 1984; HOULE 1992). In ad-
dition, when fitness components are modeled, it is con-
venient to think in terms of mean standardized values, as standardized variances are readily converted to vari- ance in relative fitness (CROW 1958) or to selection coefficients.
Both the mutational heritability and coefficient of
variation are thus useful in specific models of quantita- tive traits. However, previous reviews have depended exclusively on V M / & as a basis for summarizing and comparing V,values. This can obscure important infor- mation. For example, comparisons reveal that life his- tory traits have lower standing heritabilities than mor-
phological traits ( MOUSSEAU and ROFF 1987; ROFF and
MOUSSEAU 1987). This can be due either to smaller additive genetic variances or larger residual variances,
where residual variance (V,) is the difference between
phenotypic and additive genetic variance. Until re- cently, the differences in heritability between life his- tory and morphological traits were usually assumed to be due to lower additive genetic variance in life history traits. However, comparisons of variation standardized
by the mean show the opposite ( HOULE 1992). The
additive genetic coefficients of variation ( CVA) of life
history traits are, on average, about three times as large
as those for morphological traits, while the residual co-
efficients of variation are an order of magnitude larger.
The low heritability of life history traits occurs in spite of larger genetic variances, rather than because of low genetic variance. Considering only ratios of these vari- ances has therefore concealed variation in each quan- tity. If this pattern holds for mutational variation, the similarity of traits in mutational heritabilities may be misleading.
There are three nonexclusive hypotheses that can
explain the higher CVAs of life history traits (HOULE
1992)
.
First, a larger proportion of the genome couldaffect the average life history trait than the average mor-
phological trait. Every locus in the genome must poten-
tially affect fitness, and life history traits that summarize major components of fitness must therefore also be affected by large numbers of loci ( HOULE 1991 ) . Sec- ond, loci with effects on life history traits may be particu- larly likely to have balanced polymorphisms, for exam- ple, because of genotype-environment interactions or
antagonistic pleiotropy (ROSE 1982; GILLESPIE and TUR-
ELLI 1989). Third, selection directly on trait variance could favor modifiers that reduce the variance in mor- phological traits or increase the variance in life history traits. Variance in traits under stabilizing selection is selected against; if the fitness function is locally concave
upward (both first and second derivatives positive) , an
increase in variance is favored, for a given mean ( LANDE
1980). This argument is plausible because fitness is by
definition under linear directional selection so variance
of fitness itself is a neutral trait; morphological traits will usually be subject to stabilizing selection and be selected for decreased variance. However, all of the life
history traits with genetic data are at best fitness compo-
nents rather than measures of fitness itself. The condi- tions under which variance in a fitness component will be neutral or favored are complex, once potential trade-
offs are taken into account (D. HOULE and L. ROWE,
unpublished data).
Under the first hypothesis, that life history traits are
a larger mutational target, we predict that VM should
also be higher for these traits. This would be true which-
ever process maintains genetic variance. However, we
cannot explain high CV, for life history traits by muta-
tion-selection balance unless this expectation is met. Under mutation-selection balance, genetic variance will be negatively correlated with the average selection coef- ficient against mutant alleles, and positively correlated with I&. The higher CVAs of life history traits ( HOULE
1992) run counter to the expected negative correlation
of variation with the strength of selection, since life history traits are often under strong directional selec- tion. Given this, if the mutation-selection balance hy- pothesis is true, we predict that life history traits must
have high values of C V , to compensate. Mutation data
thus provide a partial test of both mutation-selection
balance and the target size explanation for the high genetic variance in life history traits. The tests are par-
tial in that low CV,, values would reject these hypothe-
ses, while high CV, values would not reject the alterna-
tive hypotheses.
A useful alternative measure of the importance of
mutational variance is the ratio V J V , , the inverse of
which was originally used to summarize V, values by
CIAWON and ROBERTSON ( 1955). In a large popula-
tion, genetic variance is increased by VM every genera-
Mutational Variability 1469
selection coefficient against the average mutant geno-
type. In diploids, s represents the average selection
against a mutant heterozygote, as deleterious alleles will
be eliminated chiefly through their heterozygous ef-
fects. This leads to the simple expression for the equilib-
rium, or standing genetic variance, VG = VM/ s (BARTON
1990; CROW 1993). In this case, each mutant allele will
affect an average of VG/VM individuals before being
eliminated from the population ( LI and NEI 1972)
.
Itis also the mean persistence time in an infinite popula- tion of a cohort of mutant alleles arising in the same
generation (CROW 1979). For convenience, we will fol-
low CROW (1979, 1993) in calling Vc/VM the persis-
tence time. V,/V, may also be related to the strength
of direct or induced stabilizing selection on quantitative
traits ( KONDRASHOV and TURELLI 1992).
Under mutation-selection balance we expect that per- sistence times for life history traits will be shorter than for morphological traits, because we predict a higher correlation between mutant effects on life history traits and fitness than their effects on morphological traits and fitness. There is clear empirical evidence that the
genetic correlations due to unselected mutations
among major fitness components are large and positive
( HOULE et al. 1994), so the average mutant allele must be quite deleterious. Mutations affecting morphologi-
cal traits, on the other hand, may not affect fitness
components outside of selection on the morphology
itself, and so may be less deleterious on average. There
is direct evidence that this is the case for bristle muta-
tions in Drosophila ( MACKAY et al. 1992a). Under bal-
ancing selection, we have no prediction as to what the relative persistence times for different types of traits should be. The proportion of new mutations that lead to balanced polymorphisms must be quite small and could easily differ between trait classes.
Since the average mutation is deleterious to fitness, regardless of which other traits it affects, the smaller
the ratio VJ V,, the more likely that mutation-selection
balance can explain standing variance. The mean value of V,,/VM therefore provides a qualitative test of the
mutation-selection balance model. Common practice
has been to accept the typical V,,/V, value of 1000
(LYNCH 1988) as a good approximation of V,/ V, (
e.g.,
BARTON 1990; KONDRASHOV and TURELLI 1992), but
this is clearly unjustified in general, as shown by the variation in heritabilities and coefficients of variation
( MOUSSEAU and ROFF 1987; ROFF and MOUSSEAU 1987;
LYNCH 1988; HOULE 1992). If V,/V,is as large as 1000,
this causes serious, if not absolutely fatal, difficulties for the mutation-selection balance hypothesis (BARTON
1990)
.
Clearly a compilation of VG/VM estimates is de-sirable.
In this paper, we compare mutational variabilities us- ing mutational heritability, the mutational coefficient
of variation, and the ratio of genetic to mutational vari-
ance. We also perform the tests of mutation-selection balance outlined above.
THE V , DATA SET
We have reviewed the literature on mutational vari-
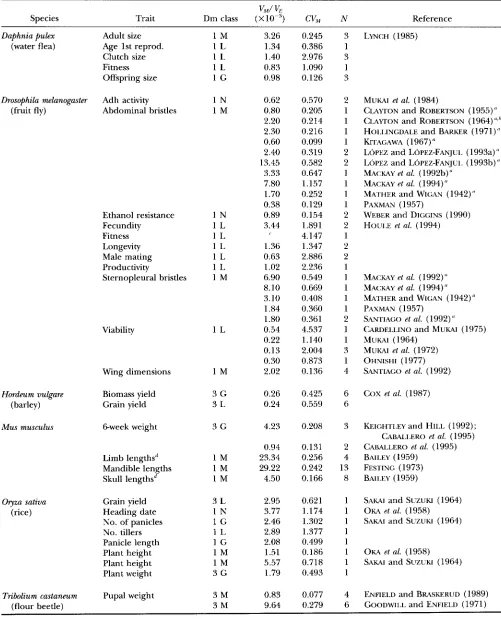
ances (V,) published through April 1995. A summary
of these estimates is given in Table 1. A detailed expla-
nation of Table 1 is given in the section Comparing
Coefficients of Variation, below. JSEIGHTLEY et al.
(1993) have recently reviewed and reanalyzed the ex- tensive literature on bristle traits in Drosophila melanogas-
ter, and we have adopted their estimates in preference
to the original analyses (see below). Estimates from studies published before 1986 were compiled by LYNCH
(1988), and those studies are included here, with some
exceptions. Three studies in mice of discontinuous vari-
ation were excluded (CARPENTER et ul. 1957; DEOL et
al. 1957; YONG 1972), as was a single study in corn that
reported only significant changes among generations
( SPRAGUE et al. 1960). These approaches are expected
to lead to particularly biased estimates of V,.
KEIGHTLEY et ul. (1993) demonstrated that there is
substantial bias in many estimates of VM for bristle traits
in D. melunoguster. It is important to consider this source
of bias in some detail, to help judge the quality of the
remaining estimates. Two ideal experiments for estimat-
ing V , may be envisioned (LYNCH 1994)
.
First, V, may be estimated from the response to selection of a popula- tion that is in mutation-drift equilibrium. Second, V,may be estimated from the rate of increase in variance by mutation and drift among replicates of a population in mutation-drift equilibrium. In both ideal cases, the observed parameters (response to selection or among- replicate variance) are simple functions of the effective
population size ( N , ) before and during the experi-
ments, and of V , . Natural selection on mutations affect-
ing the traits of interest constitute the chief obstacle to performing such experiments. Natural selection will prevent the base population from reaching mutation- drift equilibrium and will bias the divergence from both designs, for example, by eliminating deleterious muta- tions.
The simplest tool available to combat the effects of natural selection is a reduction in the effective popula- tion size. The efficacy of natural selection is propor- tional to N 2 where s is the difference in relative fitness
between selected genotypes. Reduction of N, has the
additional benefit of reducing the time necessary to
achieve mutationdrift equilibrium, which is substan- tially reached in 6N, generations for neutral variants
( MALECOT 1969) . This reasoning makes it clear that
the ideal experiment would use the smallest possible base population. In an accumulation experiment one
should also minimize N, during the accumulation
phase. When using artificial selection to estimate V,,
TABLE 1
S u m m a r y of mutation parameter estimates
VM/
v,
Trait Dm class (XlO-') CV, N
Species Reference
Daphnia Pulex Adult size 1 M
(water flea) Age 1st reprod. 1 L
Clutch size 1 L
Fitness 1 L
Offspring size 1 G
3.26 1.34 1.40 0.83 0.98 0.245 0.386 2.976 1.090 0.126
LYNCH (1985)
Drosophila melanogaster Adh activity 1 N
(fruit fly) Abdominal bristles 1 M
0.62 0.80 2.20 2.30 0.60 2.40 13.45 3.33 7.80 1.70 0.38 0.89 3.44 0.570 0.205 0.214 0.216 0.099 0.319 0.582 0.647 1.157 0.252 0.129 0.154 1.891 4.147 1.347 2.886 2.236 0.549 0.669 0.408 0.360 0.361 4.537 1.140 2.004 0.873 0.136 2 1 1 1 1 2 2 1 1 1 1 2 2 1 2 2 1 1 1 1 1 2 1 1 3 1 4
MUKAI et al. (1984)
CIAYTON and ROBERTSON (1955)" CLAYTON and ROBERTSON (1964)"." HOI.I.INGDALE and BARKER (1971)" KITAGAWA ( 1967)
L ~ P E Z and LOPEZ-FANJUI. (1993a)" LOPEZ and LOPEZ-FANJUI. (1993b)" MACKAY et al. (1992b)"
MACKAY et al. (1994)" MATHER and WIGAN (1942)" PAXMAN (1957)
WEBER and DIGGINS (1990) HOUI.E et al. (1994)
Ethanol resistance 1 N
Fecundity 1 L
Fitness 1 L
Longevity 1 L
Male mating 1 L
Productivity 1 L
Sternopleural bristles 1 M
1.36 0.63 1.02 6.90 8.10 3.10 1.84 1.80 0.54 0.22 0.13 0.30 2.02
MACKAY et al. (1 992) ''
MACKAY et al. (1994)" MATHER and WIGAN (1942) a
PAXMAN (1957) SANTIAGO et al. (1992)" C~RDELLJNO and MUKAI (1975) MUM (1964)
MUKAI et al. (1972) OHNISHI (1977) SANTIAGO et al. (1992)
Viability 1 L
Wing dimensions 1 M
3 G 3 L 0.26 0.24 0.425 0.559 6 6
COX et al. (1987) Hmdeum vulgare Biomass yield
(barley) Grain yield
4.23 0.208 3 KEIGHTLEY and HILL (1992);
CABALI.ERO et al. (1995) CABALLERO et al. (1995) BAILEY (1959)
FESTING (1973) BAILEY (1959)
Mus musculus 6-week weight 3 G
0.94 23.34 29.22 4.50 0.131 0.256 0.242 0.166 2 4 13 8 Limb lengthsd
Mandible lengths Skull lengthsd
1 M 1 M 1 M
Grain yield Heading date No. of panicles No. tillers Panicle length Plant height Plant height Plant weight 3 L 1 N 1 G 1 L l G 1 M 1 M 3 G 2.95 3.77 2.46 2.89 2.08 1.51 5.57 1.79 0.621 1.174 1.302 1.377 0.499 0.186 0.718 0.493
SAKAI and SUZUKI (1964) OKA et al. (1958) SAKAI and SUZUKI (1964)
Oryza sativa (rice)
OKA et al. (1958) SAKAI and SUZUKI (1964)
3 M 3 M 0.83 9.64 0.077 0.279 4 6
-
ENFIELD and BRASKERUD (1989) GOODWILL and ENFIELD (1971) Tribolium castaneum Pupal weight
1471 Mutational Variability
TABLE 1
Continued
vM/VE
Species Trait Dm class ( X w 3 ) CVM N Reference
Zea mays Ear diameter“ 1 G 5.16 0.715 2 RUSSELL et al. (1963)
(maize) Ear length 1 G 3.10 1.028 1
Grain yield 3 L 4.99 0.882 1
Leaf widtp 1 M 14.20 1.296 1
Plant height 1 M 8.23 1.266 1
Silking date 1 N 6.59 3.493 1
Tassel branches 1 L 19.24 3.950 1
Weight of 100 grains 3 G 4.54 2.224 1
These estimates constitute data grouping 2. Dm, dimensionality of the trait; M, adult morphological trait; G, trait is a body
a VM/ V‘ from KEICHTLEY et al. (1993).
’
Mean from DURRANT and MATHER (1955). “ N o estimate of V, for fitness.‘Ear diameter includes number of kernel rows, which is highly correlated with ear diameter (HALLAUER and MIRANDA 1988).
The mean for ear diameter is from SPRACUE et al. (1960). The mean for kernel row number is from VELDBOOM and LEE (1994). dimension during growth; L, life history trait; N, number of grouping 1 estimates included in these estimates.
Means from LEAMY (1974), or from direct measurement of mouse skeletons in the Royal Ontario Museum.
/Mean from SPRAGUE et al. (1960).
ing the response to the artificial selection are necessar-
ily in conflict, and the optimal population size, intensity
of selection and length of experiment vary with the
distribution of mutant effects.
The distributions of mutational effects on the trait and fitness are generally unknown. Two potential ex- ceptions are abdominal and sternopleural bristle num-
bers in Drosophila. MACKAY et al. (1992a) estimated
the joint effects of P-element insertions on bristle num-
bers and egg-teadult viability. KEIGHTLEY et al. ( 1993)
used these distributions in their reanalysis of bristle studies, taking account of the bias introduced by natural
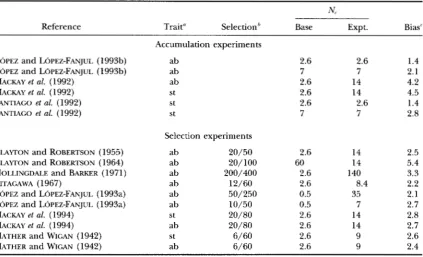
selection through pleiotropic effects on viability. The
degree of bias estimated by KEIGHTLEY et al. and the
effective population sizes of the base and experimental populations used in these studies are shown in Table
2.
In this table and Table 3, Ne was calculated assumingNe = 0.7N, unless family sizes were equalized by the
investigator, in which case Ne = 2N - 1. On average,
there was roughly a threefold increase in VM when pleio-
tropic viability effects were taken into account. How-
ever, the bias is clearly much larger when Ne is large,
particularly N, in the base population. The least biased
studies are those that accumulated variance during full sib mating from a full-sib mating base.
The quantitative results of KEIGHTLEY et aL’s reanaly-
sis are themselves subject to two contradictory biases
( KEIGHTLEY et al. 1993)
.
First there is some evidence that the pleiotropic fitness costs of P-element insertions are larger than those of other spontaneous mutants( MACKAY et al. 1992a; KEIGHTLEY 1994). Second, the effect of a mutation on viability is usually less than its
effect on fitness ( % E D 1971,1975; MACKAY 1986). Nev-
ertheless, the qualitative conclusion that estimates of
VM are biased downward is inescapable.
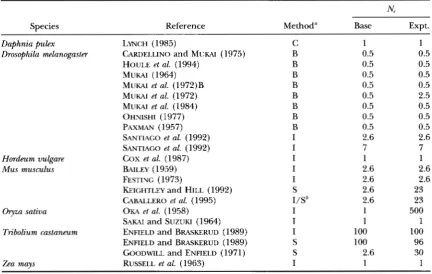
Table 3 provides the design of and effective popula-
tion sizes in studies of traits other than Drosophila bris- tles. In most cases, these studies have used designs with
smaller N3 than the bristle studies. The study of OKA
et al. (1958) stands out in having utilized a population size of 500 during accumulation. This study is also un- usual in that the accumulation phase was only five gen- erations, which minimizes the bias due to selection. If the average heterozygous effect of a mutation on fitness is 5% or less (as in
D.
melanogaster) , selection can only eliminate a small additional proportion of mutations, relative to the neutral expectation, in such a short time.The large base population size in ENFIELD and BRASKE-
RUD’S ( 1989) study (maintained for only 1.5 Ne genera-
tions) suggests that the bias in this study is particularly large; this is borne out by the large discrepancy with
the results of GOODWILL and ENFIELD ( 1971 )
.
Conse-quently, this study is not considered further.
In addition to their favorable population sizes, some of the studies in Table 3 have also minimized natural
selection in other ways. For example, KEICHTLEY and
HILL (1992) practiced within-family selection in their mouse lines, which eliminates natural selection due to mate choice, fecundity and fertility. Similarly, in studies
that involve cloned (LYNCH 1985) or selfed lines ( OKA
et al. 1958; RUSSELL et al. 1963; SAKAI and SUZUIU 1964; COX et al. 1987), balancer chromosomes (Table 3 ) , or
other methods of equalizing family sizes (BAILEY 1959;
FESTING 1973; SANTIAGO et al. 1992) selection is limited
to viability and complete sterility. In many of these stud-
ies, individuals are reared in noncompetitive condi-
tions, which will also tend to minimize natural selection
( KONDRASHOV and HOULE 1994). Similar techniques to reduce selection were only utilized in three of the
studies in Table 2 ( MATHER and WIGAN 1942; SANTIAGO
1472
TABLE 2
Relationship between effective population size and bias in the estimation of V,
in Drosophila melanogaster bristle studies
N,
Reference Trait" Selection" Base Expt. Bias'
Accumulation experiments
LOPEZ and LOPEZ-FANJUL (1993b) ab 2.6 2.6 1.4
LOPEZ and LOPEZ-FANJUL (199313) ab 7 7 2.1
MACKAY et al. (1992) ab 2.6 14 4.2
MACKAY et al. (1992) st 2.6 14 4.5
SANTIAGO et al. (1992) S t 7 7 2.8
Selection experiments
CLAWON and ROBERTSON (1955) ab 20/50 2.6 14 2.5
CLAWON and ROBERTSON (1964) ab 20/100 60 14 5.4
HOLLINGDALE and BARKER (1971) ab 200/400 2.6 140 3.3
KITAGAWA (1967) ab 12/60 2.6 8.4 2.2
LOPEZ and LOPEZ-FANJUL (1993a) ab 50/250 0.5 35 2.1
LOPEZ and LOPEZ-FANJUL (1993a) ab 10/50 0.5 7 2.7
MACKAY et al. (1994) st 20/80 2.6 14 2.8
MACKAY et al. (1994) ab 20/80 2.6 14 2.7
MATHER and WIGAN (1942) st 6/60 2.6 9 2.6
MATHER and WICAN (1942) ab 6/60 2.6 9 2.4
SANTlACO et d . (1992) st 2.6 2.6 1.4
ab, abdominal (sternital) bristles; st, sternopleural bristles.
Number of individuals selected/number of individuals examined each generation during selection.
' Factor by which V, is underestimated by the infinitesimal model (KEIGHTLEY et al. 1993).
This suggests that the studies in Table 3 are generally
not unduly biased, while the Drosophila bristle studies are in particular need of the corrections for bias that
KEICHTLEY et al. ( 1993) have applied. Consequently, we have chosen to analyze the estimates for Drosophila bristle traits corrected for viability selection along with the uncorrected estimates available for other traits. This
necessitates dropping several estimates of V, analyzed
by LYNCH (1988), but not reanalyzed by KEICHTLEY et
al. (1993) ( i . e . , DUWT and MATHER 1954; CLAWON
and ROBERTSON 1964). One accumulation study using
balancer chromosomes not reanalyzed by KEIGHTLEY et
al. was included ( PAXMAN 1957)
.
Using balancer chro-mosomes, fixation of new mutations occurs following a single generation of viability selection in heterozygous condition, so the bias in this design is expected to be only about 1-5%, the heterozygous viability effect of a
mutation (CROW and SIMMONS 1983; MACKAY et al.
1992a; KEICHTLEY 1994).
If the expectation that life history traits are generally subject to stronger selection than morphological traits is correct, then results for life history traits will be more biased than those for morphological traits. Since the
expectations based on mutation-selection balance sug-
gest that V, should be larger for life history traits, the conclusions we draw below using these data are conser- vative with respect to these differences in correction for bias.
For traits other than Drosophila bristles, the estimates
of V, in Table 1 were drawn directly from estimates in
the papers cited or were recalculated using the methods of LYNCH (1988). The only exception is egg-to-adult viability in Drosophila, which was reanalyzed as outlined
in the APPENDIX to correct LYNCH'S (1988) estimates of
V,. These reanalyses result in estimates of the environ-
mental variances three to 15 times less than those in
LYNCH. To calculate coefficients of variation, we also
required trait means. In a few cases (see Table 1 notes) ,
means were not given in the original papers, and were drawn from other studies likely to have had similar means.
Analyses were carried out on three measures of varia-
tion, V,/V,, CV,, and CV, = 100 X
&./x.
The coeffi- cients of variation were divided by the dimensionality of the trait to correct for the fact that variances of vol- umes are expected to be proportional to the cube ofvariation in linear dimensions ( LANDE 1977; HOULE
1992).
COMPARING COEFFICIENTS OF VARIATION
To test the hypothesis that life history traits have higher mutational coefficients of variation, we classified
each trait in Table 1 according to its presumed relation-
Mutational Variability
TABLE 3
Effective population sues of experiments that estimate VM
N,
Species Reference Method" Base Expt.
Daphnia @lex LYNCH (1985) C 1 1
Drosophila melanogaster CARDELLINO and MUKAI (1975) B 0.5 0.5
HOULE et al. (1994) B 0.5 0.5
MUKAI (1964) B 0.5 0.5
MUKAI et al. (1972) B B 0.5 0.5
MUKAI et al. (1972) B 0.5 2.5
MUKAI et al. (1984) B 0.5 0.5
OHNISHI (1977) B 0.5 0.5
SANTIAGO et al. (1992) I 2.6 2.6
SANTIAGO et al. (1992) I 7 7
COX et al. (1987) I 1 1
B A I L E Y ( ~ ~ ~ ~ ) I 2.6 2.6
FESTING (1973) I 2.6 2.6
KEIGHTLEY and HILL (1992) S 2.6 23
CABALLERO et al. (1995) I/S' 2.6 23
9 z a sativa OKA et al. (1958) I 1 500
SAKAI and SUZUKI (1964) I 1 1
Tribolium castaneum ENFIELD and BRASKERUD (1989) I 100 100
ENFIELD and BRASKERUD (1989) S 100 96
GOODWILL and ENFIELD (1971) S 2.6 30
Zea mays RUSSELL et al. (1963) I 1 1
PAXMAN (1957) B 0.5 0.5
Studies in Table 2 are not included.
" B, accumulation using balancer chromosomes; I, accumulation by inbreeding; C, clonal propagation; S,
'Selection was carried out in a population founded from the cross of two related inbred lines. artificial selection.
Hordeum vulgare Mus musculus
1473
in the sense that fitness must increase if their value could be increased while leaving all other traits equal
( SCHLUTER et al. 1991 ) . Note that such traits may be under stabilizing selection if the phenotypic variance is mostly generated by trade-offs between life history traits, rather than by variance in quality or condition. Morphological traits for which there is no reason to believe they are subject to directional selection are clas- sified as M traits. These include sizes of adult body parts and meristic traits. Sizes of body parts during growth
are classified as G traits. This grouping was adopted
since growth rate itself is likely to be under directional selection early in life, but that selection becomes stabi- lizing at some point in the life cycle. This grouping is thus likely to have some traits under directional selec-
tion, and others under stabilizing selection. For ethanol
resistance in
D.
melanogasto- and flowering phenologiesin plants the scale of measurement has no clear rela- tionship to potential fitness functions, making coeffi- cients of variation of questionable value. We have not attempted to classify Adh activity as a trait. These traits
are designed N in Table 1 and are not considered fur-
ther in this paper.
There is ambiguity concerning proper classification of some traits, such as infructescence dimensions and plant height in &a mays and Chyza sativa. We have classi- fied these on the basis of their genetic correlations with
yield in HALLAUER and MIRANDA'S (1988) review of
maize quantitative genetics. Ear dimensions have mod- est positive correlations with yield, while plant height is essentially uncorrelated with yield. We have classified
ear dimensions as G traits to reflect their somewhat am-
biguous status as morphological traits apparently under
directional selection. Reclassifying these and other traits
has a limited impact on the results discussed below. It is evident from Table 1 that there are many esti- mates for the same trait within some studies and many independent studies for other traits. In most species, data are only available for only one or two trait classes. This makes it difficult to devise a single appropriate analysis of these data. Instead, we have analyzed three
different groupings of the data. In grouping 1, we calcu-
lated means for each trait within each study, which
yielded a total of 7 3 estimates for CV,. To calculate the
estimates in grouping
2,
we calculated medians of thegrouping 1 estimates by species and a more general
designation of trait. For example, HOULE et al. (1994)
includes estimates of V , for female fecundity early and
late in adult life and for male and female longevity.
These estimates were combined in grouping
2
into thefecundity and longevity estimates, respectively. Table 1
shows the grouping 2 estimates, except when there is
Houle, Morikawa and Lynch
separate line. The column labeled N in Table 1 shows the number of grouping 1 estimates combined to ob- tain these estimates. Grouping 3 consists of median esti- mates within species and trait class, which gives only 16 estimates. Grouping 3 was calculated from grouping 2 estimates, so as not to weight traits with many estimates more heavily than other traits.
A legitimate alternative starting point for the analysis of these data would be to weight each estimate by the inverse of its standard error. We have not taken this approach because it would result in estimates from D. mhnogasterbeing weighted very heavily, while estimates from some other species would figure very little in the analysis. The analysis adopted will be more sensitive to real differences in the pattern of estimates among species. We feel that this is appropriate, since it is our goal to search for general patterns in the data.
Analyses were carried out on log-transformed data using the SAS procedure GLM
(SAS
INSTITUTE 1990). Analyses of residuals from the models reported below were normally distributed in most cases, and departures from normality were never large. We have not at- tempted to correct for the mean in these analyses, as was done by HOULE ( 1992), because the rather sparse and peculiar collection of traits, measured on all kinds of scales, makes it very likely that this would obscure real variation, rather than eliminate error variance. In- stead, we have included species as a factor in our analy- ses, although species is confounded with the type of trait. For example, most Mus musculus traits are skeletal dimensions, and both Hordeum vulgare traits are yields. The data for grouping 2 are graphed in Figures 1- 3, and a summary of the results of the analyses of vari- ance for all groups is presented in Table 4. Table 4 shows the results from analyses without the species by trait class interaction term, to allow us to test painvise differences between trait classes and between species. A model including this interaction was also fit for groupings 1 and 2, but was only significant in one case,CV, in grouping 1. Since we are a priori most interested in the comparison between L and M traits, the differ- ence between these groups was tested with P = 0.05 as the criterion for significance. The two comparisons involving the G class were tested using the sequential Bonferoni adjustment (HOLM 1979; RICE 1989). Pair-
wise comparisons among species were tested using the sequential Bonferoni.
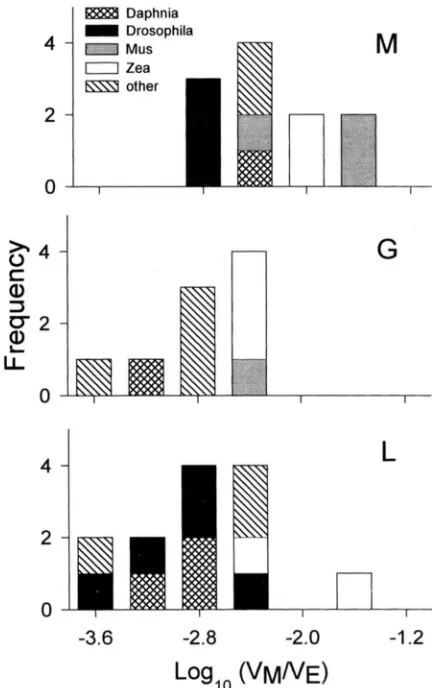
For the parameter VM/&:, the analyses of variance show that M traits have significantly higher VM/ V, than G traits in all groupings, and higher than L traits in groupings 1 and 2. The pattern of differences among species is similar in all groupings, with M . musculus and Zea having significantly higher, and H. vulgareand Dro- sophila significantly lower V M / values. There was no evidence for class by species interactions ( P
>
0.8).For
W , , ,
there is a weak indication of species by trait class interaction ( P = 0.14, grouping 1; P = 0.11,s
c
a,
3 bLI
2
D Drosophila
n
G
-3.6
-2.8
-2.0
-1.2Log,o
(VMNE)
FIGURE 1.-Histogram of loglo VM/V, values by trait class and species.
grouping
2 ) .
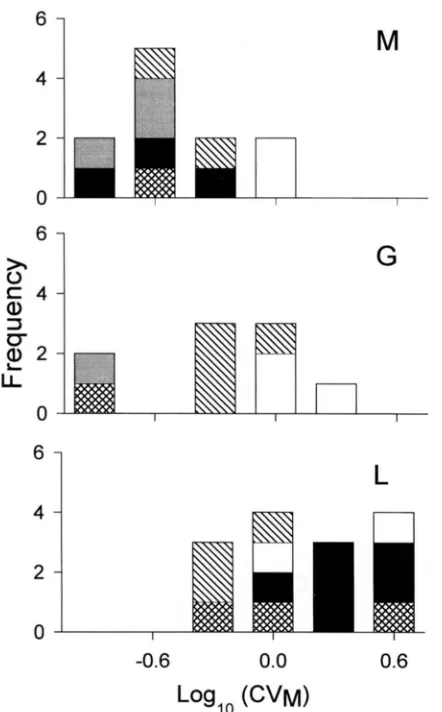
Inspection of model parameter estimates and trait medians (shown in Figure2 )
reveals that this tendency is due to differences in the magnitude of ef- fects between species, with the effect in Drosophila be- ing particularly strong, and not to reversals of the direc- tion of effects. The significance and direction of differences was not changed when the interaction term is omitted. Whether or not the interaction term is in- cluded, our prediction based on the mutation-selection balance hypothesis is borne out. For all three data groupings, L traits have significantly higher values than M or G traits. The difference between L and M is sig- nificant at P<
0.0001 for groupings 1 and 2, and P =0.012 for grouping 3. G traits have similar CV, values to M traits. Note that the differences between morpho- logical and life history traits are quite large; the least squares means for M, G and L traits are, respectively, 0.25, 0.70, and 1.65 on an arithmetic scale for data grouping 2. When converted to a variance scale by squaring these values, L traits have more than 40 times more mean standardized mutational variance than M traits. The significant species differences stem from Zea having higher C V M than Daphnia @lex and Mus. For
Mutational Variability
"1
1475
M
2
0
s
7
G
7
L
6 1
L
4 4
2
2
0
0
-0.6
0.0
0.6FIGURE
2.-Histogram of loglo C V M values by trait class andspecies.
that L traits have significantly higher values than M traits ( P = 0.025).
Analyses of
CV,
show that there is less nongenetic variance inM
traits than L traits, with G traits intermedi- ate. The significant species differences involve Mus, which has low levels of environmental variation in the traits studied. The species by class interaction is highly significant for grouping 1, but as with the C V M analysisabove, this is due to there being stronger evidence for differences in Daphnia and Drosophila than in the crop plants, rather than reversals in the direction of effects. These results are comparable to those of H ~ U L E ( 1992) who analyzed the mean-standardized residual variance,
vp
-v,.
COMPARING GENETIC AND
MUTATIONAL VARIANCES
In order to compare the ratios of genetic to muta- tional variances with the limited data available we must make additional assumptions. There are currently no estimates of VM and V, from the same population, so we must assume that both the selection regime and the mutation rates are typical for the populations where data are available.
0.2
0.8
1.42.0
RCURE
3.-Histogram of loglo CVEvalues by trait class and species.In the outbreeding species, Drosophila, Mus, or
Tribolium castaneum, we would like to compare the addi- tive mutational variance, when all mutants are in het- erozygous condition, with the standing additive vari- ance in an equilibrium random mating population. For these species, persistence times will be biased if mutant alleles do not act additively, since mutational effects were generally assayed in homozygous condition. There is good evidence that the assumption of additivity can- not hold exactly for both fitness components and mor- phological traits. For fitness components, the observa- tion of inbreeding depression rules out additivity in favor of at least partially recessive gene action
( CHARLESWORTH and CHARLESWORTH 1987). The well- established fact that most alleles with large effects on morphological traits are recessive supports this pattern. For viability in
D.
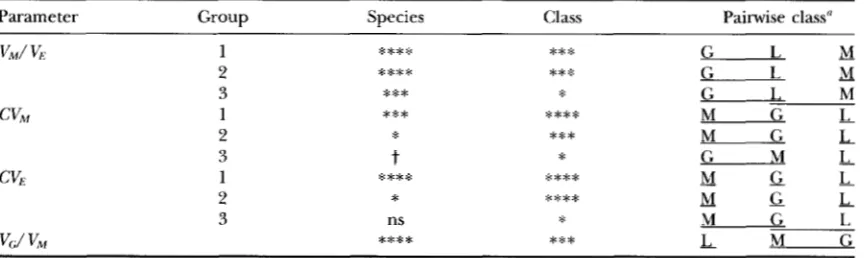
melanogmter, new mutations consist of a small proportion ( <5%) of almost completely reces- sive lethals; the remainder have small effects that are nearly additive, with an average dominance of about 0.4 (SIMMONS and CROW 1977; CROW and SIMMONSTABLE 4
S u m m a r y of probability values from trait class analyses
Parameter Group Species Class Pairwise class"
vM/
h:
1****
***
G L - M2
****
***
G L - M3 1 2
***
***
*
*
****
***
G L M
M G L
M G - L
-
3
t
*
G M LC K ; 1
****
****
- M - G L2
*
****
- M - G L3 ns
*
M G LV G /
v .
****
***
- L M Ga Trait classes are listed in increasing order. Solid lines connect trait classes that are not significantly different.
The comparison M us. L was carried out at a significance level of P = 0.05, while criteria for the other two comparisons were adjusted using the sequential Bonferoni correction for three comparisons.
t
0.1 > P >0.05;
*
P < 0.05;***
P < 0,001;****
P < 0.0001.- - -
1979; CROW and SIMMONS 1983). P-element insertions
with relatively large effects on bristle number in D. melu- nogaster studied by MACKAY et al. ( 1992) often had ef- fects that were partially recessive. Among these largest mutations, the degree of dominance was inversely re-
lated to their homozygous effects, as with viability muta-
tions.
The effect of these departures from additivity is to bias the estimates of V G / V , downward by a factor of
1 - 4h2, where h is the average dominance parameter.
For nonlethal mutations affecting viability, this should result in estimates that are too small by a factor of 1.5.
However, since both morphological and life history traits seem to be subject to the same biases, this should not affect the comparisons between trait classes.
For Hordeum, Oryza and Daphnia, mutations were
assayed in typical genotypes for the mating system:
selfing for Oryza and Hordeum; clonal reproduction for long periods in Daphnia. The situation for Zea is more complicated, as the selfing rate is probably not high in a natural population. However, the mutational and standing variances are for cultivars where most se- lection takes place during cycles of inbreeding and hy- bridization.
A more general problem with the estimates of persis-
tence is that many estimates of Vc are for populations
either clearly or potentially not at equilibrium. For the three crop plants, Hordeum, Oryza and Zea, the pub- lished studies on standing variance tend to be seeking material in which the variance in desirable traits is max-
imized, rather than typical, biasing our estimates of
standing variance upwards. On the other hand, the standing variance may have been depleted by previous artificial selection. It is not even clear that any equilib- rium populations of these cultivars exist. For Daphnia,
the two available studies are of wild animals brought
into the laboratory and the estimates are thus poten- tially affected by genotype-environment interactions.
For Drosophila, Tribolium and Mus, estimates of vari- ance have been obtained from laboratory populations. In Drosophila and Tribolium, we only used variances from populations that had been in the laboratory for a hundred generations or more, so any biases are proba- bly minor if the mutation-selection balance hypothesis
is true. On the other hand, the Mus populations are
relatively recently derived from crosses of inbred lines, and so the genetic variances are likely to be biased. Nevertheless we feel that these comparisons are useful,
if only to spur further studies.
The available data on standing variance for traits
where we have estimates of V, are summarized in Table
5. The means for the same traits often differ from study
to study, so we chose to compare the ratio of coefficients
of variation, to account for possible scale effects. As
with the mutational data, trait means were sometimes not available from the cited studies directly and were drawn from other sources. For Drosophila and Tribolium, variance estimates are from the more exten-
sive compilation of HOULE (1992). We show estimates
of both additive and total genetic coefficients of varia- tion where available. In most cases where such compari- sons are possible, the discrepancy between additive and total variance is not large. We calculated the persistence times, V,/V,,, or V A / V , , as the ratio of the medians of the appropriate coefficients of variation squared. To minimize the potential for biases favorable to the muta- tion-selection balance hypothesis, analyses were carried out on the larger of the two ratios, ( CV,,/ CV,)' or
The resulting ratios are graphed in Figure 4. The most striking thing about these persistence times is that the majority of them are quite small, even bearing in
mind the possibility of bias due to dominance. The
overall median is 83 generations, so well over half of
the estimates are less than 100 generations. For L traits
the median is only 48 generations, for M traits 115,
Mutational Variability
TABLE 5
Medians of standing additive and total genetic coefficients of variation for traits with mutation data
1477
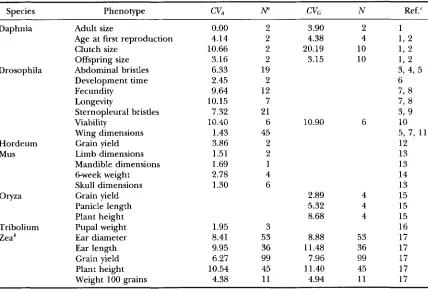
Species Phenotype CVA N" CVG N Ref.'
Daphnia Adult size 0.00 2 3.90 2 1
Age at first reproduction 4.14 2 4.38 4 1, 2
Clutch size 10.66 2 20.19 10 1, 2
Offspring size 3.16 2 3.15 10 1, 2
Development time 2.45 2 6
Fecundity 9.64 12 7, 8
Longevity 10.15 7 7, 8
Sternopleural bristles 7.32 21 3, 9
Viability 10.40 6 10.90 6 10
Wing dimensions 1.43 45 5, 7, 11
Hordeum Grain yield 3.86 2 12
Mus Limb dimensions 1.51 2 13
Mandible dimensions 1.69 1 13
&week weight 2.78 4 14
Skull dimensions 1.30 6 13
Oryza Grain yield 2.89 4 15
Panicle length 5.32 4 15
Plant height 8.68 4 15
Tribolium Pupal weight 1.95 3 16
Zeab Ear diameter 8.41 53 8.88 53 17
Ear length 9.95 36 11.48 36 17
Grain yield 6.27 99 7.96 99 17
Plant height 10.54 45 11.40 45 17
Weight 100 grains 4.38 11 4.94 11 17
Drosophila Abdominal bristles 6.33 19 3, 4, 5
N is the number of estimates analyzed over all references.
HALLAUER and MIRANDA (1988); compiled estimates of variance components for Zea from the literature, but did not include data on means. Means used are the same as in Table 1.
'References: 1: LYNCH and DENG (1994); 2: LYNCH et al. (1989); 3: SEN and ROBERTSON (1964); SHENDAN
et al. (1968); MACKAY (1981); 4: CLAWON et al. (1957); BOWMAN (1962); YO0 (1980); SORENSEN and HILL (1982); 5: COYNE and BEECHAM (1987); 6: SANG and CLAWON (1957); PROUT (1962); 7: TANTAWY and RAKHA (1964); TANTAWAY and EL-HELW (1966, 1970); 8: ROSE and CHARLESWORTH (1981); CHAFUESWORTH (1984); SCHEINER et al. (1989); 9: LOPEZ-FANJUL and HILL (1973); YOUSIF and SKIBINSKI (1982); GALLEGO and LOPEZ- FANJUL (1983), 10: MUKAI (1988); 11: ROBERTSON and REEVE (1952); REEVE and ROBERTSON (1953); TANTAW
(1956); T A N T A W Y ~ ~ al. (1964); TANTAwand TAWL (1970); COWLEY et al. (1986); WILKINSON (1987); 12: CHOO et at. (1986); 13: LEAMV (1974); 1 4 FALCONER (1973); MEYER and HILL (1991); 15: NEI (1960); 1 6 SCHEINBERG
et al. (1967); BONDARI et al. (1978); HALLIBURTON and GALL (1981); 1 7 HALLAUER and MIRANDA (1988).
and for G traits 119 generations. On a log scale, the
distribution of times is normal, so the transformed
times were analysed in the SAS program GLM, as with
the coefficients of variation. This analysis is summarized
in the last line of Table 4. The effect of class is highly significant. Our prediction based on mutation-selection
balance is borne out with L traits having significantly
lower persistence times than M or G traits ( P
<
0.01in both cases). M and G traits are not significantly dif-
ferent from each other. The species by trait interaction
term is nearly significant ( P = 0.1 )
.
Inclusion of this term intensifies the significance of the trait class effect slightly.DISCUSSION
Our review reveals a pattern strikingly favorable to the mutation-selection balance hypothesis. Life history traits have much larger mutational coefficients of varia-
tion than morphological traits, which supports both mutation-selection balance and the mutational target theory for the high variance of life history traits. The persistence times are overall quite low, consistent with deleterious mutations playing an important role in the maintenance of variation. Finally, the persistence times for life history traits are significantly lower than those for morphological traits.
Patterns in mutational coefficients of variation: Standardizing mutational variance by the trait mean reveals that traits that are more closely connected with
fitness have higher proportional inputs of variance.
This is consistent with the hypothesis that life history traits are larger mutational targets ( HOULE 1991 ) and that mutation-selection balance can explain the large
standing genetic variance in such traits ( HOULE 1992)
.
1478 Houle, Morikawa and M. Lynch
n
n
FIGURE 4.-Histogram of loglo persistence times
(VJV,)
val- ues by trait class. Black bars,L
traits; grey bars, G traits; openbars, M t r a i t s .
evolved that reduce the variance of traits that are sub- ject to stabilizing selection ( LANDE 1980; HOULE 1992; POMIANKOWSKI and MBLLER 1995). However, our ob-
servation is clearly inconsistent with the suggestion that traits with the greatest fitness sensitivity are the most canalized ( STEARNS et al. 1995)
.
The fact that measures of variation are correlated with the dimensionality of the trait (LANDE 1977; HOULE 1992) poses a problem for interpretation of differences between life history and morphological traits. For morphological traits it is clear what the appro- priate dimensionality is. This is also true for life history traits that are clearly best treated as volumes, such as
grain yields. Ambiguity arises for other life history traits that are potentially correlated with biomass. We favor our current interpretation of dimensionalities in Table 1 because there is no evidence that genetic correlations between size and lifetime fitness are generally positive; size is usually thought to be under stabilizing selection. If we were to reclassify all life history traits as three dimensional, this would still be insufficient to wipe out the current sixfold difference between morphological and life history traits, particularly as grain yields have already been classified as three dimensional traits (Ta- ble l )
.
Our favored explanation for the large muta- tional variance of life history traits may be seen as essen- tially a version of the dimensionality argument. Volumes have higher coefficients of variation because they compound variances in linear dimensions ( LANDE1977) ; life history traits have higher coefficients of vari- ation because they compound variances in many differ- ent processes, over the entire life-span of the organism (PRICE and SCHLUTER 1991; HOULE 1992).
Our finding that WE is larger for life history traits than for morphological traits is expected based on the higher residual coefficient of variation ( c V R = 100
= / m ,
for life history traits found by HOULE ( 1992) based on a much larger data set. The present comparison is superior in that most of the stud- ies reviewed here directly estimated the environmental variance. The similarity of the results forCV,
andCV,
argue that nonadditive genetic variance is not a major contributor to the high c V R for life history traits.
Persistence times: The ratios of standing variance to mutational variance ( V G / V M ) are surprisingly small on the average and show that life history traits again receive a larger proportion of their variation by mutation.
As
noted in the introduction, VG/VM is the average persis- tence time for deleterious alleles in an infinite popula- tion. In a finite population," VG 2NC
V M
-
1+
2Ng( KEICHTLEY and HILL 1988; BURGER et al. 1989; HOULE 1989), which approaches 2N, when 2Ng approaches zero, as in a small population, or under neutrality. In most cases, our estimates of standing variances are for populations where Ne is likely to be much greater than the median persistence time estimate. These values therefore suggest either that selection is important in eliminating much new mutational variance or that the populations where estimates are available have less than equilibrium levels of variation. This last possibility seems reasonable for Mus, where some populations studied had been founded as few as 40 generations earlier by crossing inbred lines (
LEAMY
1974), and for the crop plants. However, this is not necessarily so, asthese populations could have levels of variation higher than equilibrium, if phenotypically diverse genotypes were used to found each population.
The low median persistence time of less than 100 generations overall and less than 50 for life history traits are close to what would be expected under mutation- selection balance given what we know about the average fitness effect of unselected mutations. Estimates of the average selection coefficient against heterozygous mu- tants due to viability selection in
D.
melanogastm are approximately 1-5% (CROW and SIMMONS 1983;MACKAY et al. 1992a; KEICHTLEY 1994), suggesting per-
sistence times of only 20-100 generations for this trait. These experimental estimates of the average effect
of
mutations are subject to contradictory biases that make them somewhat uncertain. Two factors inflate these es- timates. The mutation accumulation method for esti- mating average effects yields only a maximum value for s (CROW and SIMMONS 1983), while the Pelement insertions studied by MACKAY et al. probably have larger
than average fitness effects (MACKAY et al. 1992a;
KEIGHTLEY 1994). On the other hand, the estimates are biased downward in that they measure only the deleterious effects on viability, and these are positively correlated with effects on other fitness components
Mutational Variability 1479
They are corroborated by an independent estimate of
the persistence time for viability in
D.
melanogaster basedon the ratio of the rate of decline in the mean due to mutation pressure to the mutational load, which gives persistence times of 50 generations (CROW and SIM-
MONS 1983). Even if the most conservative interpreta- tions of the above data are made, doubling the largest
estimates of the average deleterious effect to s = 0.1,
which would yield persistence times of 10 generations,
about 20% of the variance in fitness components in
D.
melanogaster would be explicable by mutation-selection balance. If the average selection is less than this, as
various arguments suggest ( KEIGHTLEY 1994), muta-
tion-selection balance may be able to explain most of the variation in these important life history traits. While there are no comparably direct estimates of average fitness effects of mutations in other species, there is no reason to suspect that mutant effects in other species will prove different.
On the other hand, there is also evidence that the simplest mutation-selection balance model cannot ex-
plain all of the genetic variance in some cases. MUKAI’S
( 1988) more detailed analysis of the standing variance
for viability shows that
D.
melanogaster populations atlow latitudes have 10 times the genetic variance of high latitude ones. Thus, while the mean genetic variance may be explicable by a simple mutation-selection bal- ance hypothesis, the variation among populations is
clearly not. MUKAI suggested that this discrepancy could
be explained by increased opportunity for balancing selection due to genotype-environment interactions at low latitudes. Potential alternative explanations include
more recent introduction of
D.
melanogaster to, or re-duced effective population size at high latitudes. An- other possibility is greater selection against deleterious alleles in a high latitude environment. The observation
that relative fitnesses can change by more than an order
of magnitude as the environment becomes harsher
lends credence to this possibility ( KONDRASHOV and
HOULE 1994)
.
For morphological traits, this reanalysis of mutational
data also strengthens the case for mutation-selection balance substantially. For example, the argument that there is insufficient mutational variance to account for observed amounts of stabilizing selection by pleiotropic
effects on fitness (BARTON 1990; KONDRASHOV and TUR-
ELLI 1992) is based on using the “typical” value for V , , / V, of 10 p3 as an approximation for V,/ V,, which in turn estimates the average selection coefficient against mutant alleles under mutation-selection balance. All of our estimates of V,/ V, are greater than 10
-’,
and more than half are greater than 10-‘.
Part of the reason forthe emphasis on the figure is that it is close to
V , / Vc; for the well-studied bristle traits in
D.
melanogas- ter. The persistence times for abdominal and sterno- pleural bristles are 692 and 362 generations, respec-tively, which are among the largest times we found,
rather than typical ones. The persistence times com-
piled here are thus consistent with modest apparent
stabilizing selection on other morphological traits.
Future studies: We are painfully aware that the data available for this review are sparse and that the quality of many available estimates is not high. For example,
some estimates of V, from LYNCH ( 1985) and HOULE
et al. (1994) are not significantly different from zero
or are only marginally significant. For many earlier stud-
ies, we have only an estimate of V,, and no estimates
of the statistical error. In most cases the possibility of
variation in V, among genotypes within species remains
unaddressed. The exception is
D.
melanogaster, wherethere is strong evidence that strains possessing the P
transposable element have substantially higher V , for
bristles traits than those without (KEIGHTLEY et al.
1993). Another glaring gap in the current data is the
lack of estimates of V, and V, in the same population.
There is frequently substantial variation in estimates of standing variance for the same trait in different popula-
tions ( MOUSSEAU and ROFF 1987; ROFF and MOUSSEAU
1987). Much of this must be due to sampling error,
but variation among populations in V, could explain
some real variation in V,. We hope we have made clear
that such estimates bear on interesting questions; part of our purpose here is to spur additional experimental work that may result in better estimates.
Mutation-selection balance and the genetics of adap-
tation: In supporting the mutation-selection balance
model for the maintenance of variation, our results
tend to cast doubt on a model of adaptation where most of the genetic variation in an equilibrium population is assumed to be available to promote adaptation under
a new selective regime. This view is justified under muta-
tion-selection balance if each aspect of the phenotype is controlled by loci with effects on just a few other traits, as in the simplest versions of mutation-selection
balance (&MUM 1965; LANDE 1976a; TURELLI 1984).
Several observations argue that this cannot be generally
true (BARTON 1990; KEIGHTLEY and HILL 1990). First,
morphological mutants generally have pleiotropic ef- fects on fitness that are difficult to ascribe to selection acting directly on the trait studied (e.g., MACKAY et al. 1992a). Second, substantial apparent selection on each phenotypic trait is generally observed. In a few cases, there is direct evidence that this does not arise through selection on the trait itself (e.g., NUZHDIN et al. 1995). More generally, if selection of this magnitude acts inde- pendently on a large number of traits this implies a
larger variance in relative fitness than we observe (BAR-
TON 1990). It would also imply a large genetic load.
The alternative to the simple, direct mutation-selec- tion balance model is a pleiotropic one, where most
loci affect many traits (ROBERTSON 1967; HILL and