Degree of Selective Constraint
as
an
Explanation of the Different Rates
of
Evolution
of
Gender-Specific Mitochondrial DNA Lineages
in
the Mussel Mytilus
Donald
T.
Stewart,*Ellen R. Kenchington,*’+
Rama
K.
Singh’
and Eleftherios
Z~uros*’~*Department of Biology, Dalhousie University, Halifax, Nova Scotia B 3 H 4J1, Canada, tDepartment of Fisheries and Oceans, Halifax, Nova Scotia B3J 2S7, Canada, $National Research Council Institute for Marine Biosciences, Halifax, Nova Scotia B?H l Z 1 , Canada
and sDepartment of Biology, University of Crete and Institute of Marine Biology of Crete, Iraklion, Crete, Greece
Manuscript received August 12, 1995
Accepted for publication April 9, 1996
ABSTRACT
Mussels of the genus Mytilus segregate for a maternally transmitted F lineage and a paternally transmit- ted M lineage of mitochondrial DNA. Previous studies demonstrated that these lineages are older than the species of the M . edulis complex and that the M lineage evolves faster than the F lineage. Here we show that the latter observation also applies to a region of the molecule with no assigned function. Sequence data for the mitochondrial COIII gene and the “unassigned” region of the F and M lineages of M . edulis and M . trossulus are used to evaluate various hypotheses that may account for the faster rate of evolution of the M lineage. Tests based on the proportion of synonymous and nonsynonymous substitutions suggest that the M lineage experiences relatively relaxed selection. Further support for this hypothesis comes from an examination of COIII amino acid substitutions at sites defined as either conserved or variable based on the pattern of variation in other mollusks and Drosophila. Most substitu- tions in the M lineage occur in regions that are also variable among non-Mytilus taxa. We suggest that these differences in selection pressure are a consequence of doubly uniparental mitochondrial DNA
transmission in Mytilus.
T
HE mitochondrial DNA (mtDNA) of mussels of the genus Mytilus is characterized by a number of unusual features. The first to be described was a high frequency of mtDNA heteroplasmy (FISHER and SKIBIN- SKI 1990; HOEH et al. 1991) that was subsequently attributed to a peculiar mode of mitochondrial DNA trans- mission (ZOUROS et al. 1992, 1994a,b; SKIBINSKI et al. 1994a,b). Female mussels normally possess one type of mtDNA that they transmit to both daughters and sons. In contrast, males are heteroplasmic for two types of mtDNA genomes, the female or “F” type that they re- ceive from their mother but transmit to no offspring, and the male or “M” type that they receive from their father and transmit to sons. This system of mtDNA transmission has been termed “doubly uniparental in- heritance” or DUI (ZOUROS et al. 1994a). Provided that the M and F genomes do not recombine, DUI results in the formation of distinct male and female mtDNA lineages (see commentary by HURST and
HOEKSTRA
1994). RAWSON and HILBISH (1995) and STEWART et al. (1995) have indeed demonstrated the presence of gender-associated lineages in two species of mussels, M . edulis and M . trossulus, and shown that these lineages arose before the divergence of these two taxa from their common ancestor.
Mytilus mtDNA is also noteworthy for its gene ar- rangement, which is radically different from that of
Curresponding author: Donald T. Stewart, Department of Biology, Dalhousie University, Halifax, Nova Scotia B3H 451, Canada.
E-mail: [email protected]
Genetics 143: 1349-1357 (July, 1996)
other metazoans (HOFFMANN et al. 1992). Recently, the complete mtDNA sequence was obtained for another mollusk, the chiton Katharina tunicata (BOORE and
BROWN 1994a). In contrast to Mytilus, the gene order of Katharina mtDNA is similar to arthropod, chordate, and echinoderm mtDNA (BOORE and BROWN 1994b). Highly divergent gene order may not be unique to Myti- lus, however. The protein and rRNA gene order in two land snails, Cepuea nemoralis (TERRETT et al. 1994) and Albinaria coeruka (HATZOGLOU et al. 1995), is different from the usual arrangement of Katharina as well as from that of Mytilus.
HOFFMANN et al. (1992) have also noted that Mytilus mtDNA is much more divergent from vertebrate or other invertebrate mtDNA at the sequence level than the latter two are from each other. Following the discov- ery of DUI in Mytilus several authors observed that the
M type is more divergent than the F type (SKIBINSKI et al. 1994b; RAWSON and HILBISH 1995; STEWART et al. 1995). A similar observation was made by
Lru
et al.(1996) in the freshwater mussel Anodonta (= Q g a n e d o n ) grandis, which also possesses doubly uniparental mtDNA inheritance. All these authors suggested that because the male germ line is the only tissue where the
of the M genome. These include (1) a larger number of genome replications during spermatogenesis, (2) a greater level of free-radical damage in sperm, (3) posi- tive selection on the M genome, and (4) a smaller effec- tive population size for the M genome.
The primary objective of this paper is to evaluate the various hypotheses that could account for the faster evolutionary rate of the M lineage in the M. edulis spe- cies complex. To this end we obtained additional se- quence information for the most common F and M types of M. edulis and M. trossulus by extending the known nucleotide sequence of the COZII gene and by obtaining the nucleotide sequence of a segment of the mtDNA genome for which no function has yet been assigned (segment
#2;
HOFFMANN et al. 1992). This in- formation was used to reaffirm the faster rate of evolu- tion of the M lineage and to test whether the ratio of synonymous to nonsynonymous substitutions in theCOZZIgene in the two gender-associated lineages is com- patible with the model of neutral molecular evolution. To further characterize the nature of amino acid substi- tutions in the Mytilus sequences, we compared the pat- tern of amino acid substitution in the M and F lineages with the pattern of variation found in COZZI amino acid sequences from a cross-section of mollusk species and Drosophila. We conclude that the M mtDNA lineage is experiencing relaxed selection relative to the F lineage and suggest that the difference of selection constraint on the two lineages may be a consequence of DUI.
MATERIALS AND METHODS
Sequencing protocol: Methods for obtaining the sequence of an 813-bp segment of the cytochrome c oxidase subunit I11 (COZZZ) for the most common M and F mitotypes of M. edulis and M. trossulus were described previously (STEWAKT et al. 1995). These four types, formerly known as FB and M in
M. edulis and as N and S in M . trossulus (FISHER and SKIBINSKI 1990; ZOUROS et al. 1992), have been renamed F-edl, M-edl, F-trl and M-trl, respectively, to denote their gender and spe- cies affiliation (STEWART et al. 1995), Briefly, samples were amplified using Mytilus-specific primers (STEWART et al. 1995) and sequenced (in both directions) employing Taq dye-termi- nator chemistry on an AB1 automated sequencer. Amino acid sequences were inferred from the nucleotide sequences using the Drosophila mtDNA genetic code as recommended by HOFFMANN et al. (1992) and BOORE and BROWN (1994a). The corresponding COZZZ sequences for the following taxa were obtained from the GenBank database yr communicated to us directly: the bivalve Lasaea australis (0 FOIGHII. and SMITH 1995), the chiton K. tunicata (BOORE and BROWN 1994a), the land snail Albinan‘a tum‘ta (G. RODAKIS, unpublished results), the cephalopod Octopus birnaculatus (BAKRIGA SOSA et al. 1995) and the fruit fly D. yakuba (CLARY and WOLSTENHOLME 1985). The Mytilus mitotypes were also sequenced for a segment of the mtDNA genome (located between the cytochrome b and qtochrorne c oxidase subunit I1 genes) for which no function has yet been assigned (i.e., segment #2; HOFFMANN et al. 1992). Two primers, Seg#S-FOR (5’-GGAAAGMTACCCACACTC-
3 ‘ ) and Seg#2-REV (5‘-CCTCAGCTATAAAACCCTA-3’), were used to amplify and sequence this region in both direc- tions as described above.
Genetic distance and phylogenetic analysis: Sequences were aligned using the ClustalV computer program and analyzed using the MEGA package (KUMAR et al. 1993). The COZZZnucle- otide sequences were used to obtain the Jukes-Cantor corrected proportion of synonymous
(K5)
and nonsynonymous(h)
sub- stitutions for all pair-wise combinations. Similarly, the Poisson- corrected proportion of amino acid substitutions was obtained for all pair-wise combinations of sequences shown in Table 1. Pairwise proportions of nucleotide substitutions (K) for seg- ment #2 were calculated using Kimura’s two-parameter correc- tion for multiple hits. Gaps in the sequences were eliminated in painvise comparisons. Unrooted trees were constructed for the four Mytilus mitotypes from the COZZZamino acid sequence data and from the segment #2 nucleotide sequence data using both parsimony (Paup 3.1.1; SWOFFORD 1991) and neighbor- joining methods (SAITOU and NEI 1987). To determine the level of support for resulting phylogenetic groupings, both the parsimony and neighbor-joining analyses were conducted on 1000 bootstrapped data sets.Secondary structure analysis: Potential secondary struc- tures formed by the nucleotide sequences of segment #2 were estimated by the method of ZUKER and STEI(:I.ER (1981) using the program PCFOLD version 4.0. Observed free energy val- ues for the four main Mytilus mitotypes were compared with 10 randomized sequences of the same length and proportion of nucleotides.
Nucleotide substitution tests: & and KA values for the two
M mitotypes (M-edl and M-trl) and the two F mitotypes (F- edl and F-trl) were used to compare synonymous and nonsyn- onymous nucleotide substitution rates of the M and F mtDNA lineages at the COIZZgene. In the absence of a suitable out- group, these numbers were compared by assuming that be- cause the M and F types were sampled from two distinct spe- cies, the time of divergence of the two M mitotypes from each other is equal to the time of divergence of the two F mitotypes. We used MCDONALD and KF~IETMAN’S (1991) test to exam- ine whether the pattern of nucleotide substitution is compati- ble with the model of neutral evolution. Neutral evolution predicts that the ratio of the number of sites that are polymor- phic within one (or more than one) lineage to the number of sites that are fixed for different nucleotides in separate lineages must be the same for synonymous and nonsynony- mous sites. For this purpose, we used the data given in STEW- ART et al. (1995) that consist of 321 bp of the COZIZ gene sequenced from three F e d , four F-tr, two M-ed and three M- tr mitotypes. The M sequences from M . edulis and M . trossulus were regarded as representing two lineages of the same clus- ter. The same assumption was made for the F sequences. MCDONALD and KREITMAN’S test requires a random sample of sequences. Although the sample we have used was not random, this should not have a significant effect on the result of the test since STEWAKT et al. (1995) made a conscientious effort to sequence a cross-section of the diversity of mitotypes present in these species.
Molecular Evolution in Mytilus 1351
TABLE 1
Ammo acid alignment of the cytochrome c oxidolse subunit III gene of four Mytilus sequences with four other mollusk species and D. yakuba
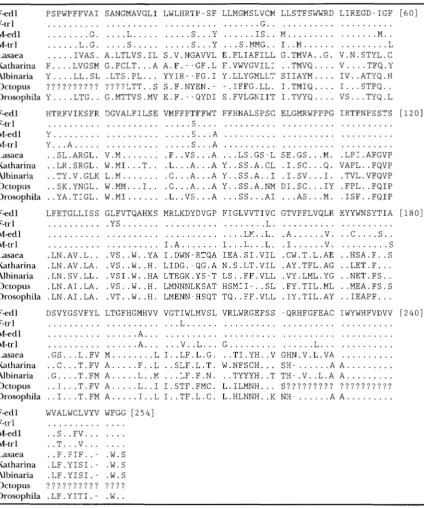
F e d 1 PSPWPFFVAI SANGMAVGLI LWLHRTP-SF LLMGMSLVCM LLSTFSWWRD LIREGD-IGF [ 6 0 ]
F-trl
. . .
. . .
M-ed 1G..
. . .
G.. . . .
L.... . .
S...Y . . . IS.. M. . .
M..M-trl
. . .
L.G.. . . .
S... . . . S...Y. . .
S.MMG.. I . . M . . .. . .
LLasaea
. . .
IVAS. A.LTLVS.IL S.V.NGAVVL E.FLIAFILL G.TMVA..G. V.N.STYL.CKatharina F....LVGSM G.FCLT
. . .
A A.F:-GF.L F.VWVGVIL1. .
TMVQ. . . .
V....TFQ.YAlbinaria Y....LL.SL .LTS.PL... YYIR”FG.1 Y.LLYGMLLT SIIAYM
. . . . IV..ATYQ.H
Drosophila Y....LTG.. G.MTTVS.MV K.F:-QYDI S.FVLGNIIT I.TVYQ
. . . .
VS . . . TYQ.LOctopus ? ? ? ? ? ? ? ? ? ? ????LTT..S S.F.NYEN.- -.IFFG.LL. I.TMIQ
. . . .
I...STFQ..F-ed 1
F-tr 1 M-ed 1
M-tr 1 Lasaea Katharina Albinaria
Drosophila octopus
HTRFVIKSFR DGVALFILSE
. . .
Y
. . .
Y . . . A . . .
. . .
..SL.ARGL. V.M . . . ..LR.SRGL. W.MI. . .
T....TY.V.GLK L.M
. . .
..SK.YNGL. W.MM. . .
I.. ,.YA.TIGL. W.MI. . .
VMFFFTFFWT
. . .
s....
. . .
S...A. . .
S...A .F..VS...A .L...A...A .C...A...A .C...A...A .L..VS...AFFHNALSPSC ELGMRWPPPG
. . .
. . .
. . .
. . .
LS.GS-L SE.GS. . .
M. Y..SS.A.CL .I.SC...Q. Y..SS.A..I .I.SV...I. Y..SS.A.NM DI.SC. . .
IY. . .
SS. . .
AI. . .
AS. . .
M.IRTPNPSSTS [1201
. . .
. . .
. . .
.LPI.AFGVP VAPL..FQVP.TVL.VFQVP .FPL..FQIP .ISF..FQIP
F e d l LFETGLLISS GLFVTQAHKS MRLKDYDVGP FIGLVVTIVC GTVFFLVQLR EYYWNSYTIA [180]
F-trl
. . . .YS
. . .
L. . . M e d 1. . .
LM..L. .A. . .
V.. .
C....S..M-tr 1
. . .
1.A. . . I...L...L.
.I. . .
V.. . .
SLasaea .LN.AV.L.. .VS..W..YA I.DWN-RTQA 1EA.SI.VIL .CW.T.L.AE ..HSA.F..S
Katharina .LN.AV.LA. .VS..W..H. L1DG.-QG.A N.S.LT.VIL .AY.TFL.AG
. .
LET.F. . .
Albinaria .LN.SV.LL. .VSI.W..HA LTEGK.YS-T LS..FF.VLL .VY.LML.YG ..NET.FS..
Drosophila .LN.AI.LA. .VT..W..H. LMENN-HSQT TQ..FF.VLL .IY.TIL.AY
. .
IEAPF . . .F e d 1 DSVYGSVFYL LTGFHGMHVV VGTIWLMVSL VRLWRGEFSS -QRHFGFEAC IWYWHFVDVV [ 2 4 0 ]
F-tr 1
. . .
L . . .. . .
M-ed 1
. . .
A.... . .
M-trl. . .
A.... . .
V..L... G. . .
L.... . .
Lasaea .GS...L.FV M
. . .
L I..LF.L.G. ..TI.YH..V GHN.V.L.VA. . .
Katharina
. .
C...T.FV A . . . F.. L ..SLF.L.T. W.NFSCH. . .
SH- . . . A A. . .
Albinaria .G....T.FM A
. . .
L.. M. . .
LF.F.N. ..TYYYH..T TH-.V..L.A A. . .
Octopus
. .
I...T.FV A . . . L.. 1I.STF.FMC. L.ILMNH. . .
S ? ? ? ? ? ? ? ? ? ? ? ? ? ? ? ? ? ? ? Drosophila . . I...T.FM A. . .
I.. L I..TF.L.C. L.HLNNH..K NH- . . . A A. . .
Octopus .LN.AI.LA. .VS..W..H. LMNNNLKSAT HSMII-..SL .FY.TIL.ML ..MEA.FS.S
Fed1 WVALWCLVYV WFGG [ 2 5 41
F-trl
. . .
M-edl. .
S..FV.... . . .
M-trl . . T...V... . .
Lasaea
. .
F.
F I F. .
-.
W.
SKatharina .LF.YISI.- .W.S
Albinaria .LF.YISI.- .W.S
Drosophila
.
LF.
YITI.
-.
W..
octopus ? ? ? ? ? ? ? ? ? ? ? ? ? ?
F-edl, F-trl, M-edl and M-trl indicate the gender and species affiliation of the four most common mitotypes of Mytilus. Dots represent agreement with F e d l . ?, sequence information was not available at this site.
above), which can be considered as an index of the “conserva- (-85% of the gene) and 118 bp of the region of unas- tiveness” of the segment; (2) the number of sites at which signed function for the most F and M mito-
the two M sequences had different amino acids ( i e . , polymor-
phic sites within the M lineage); and (3) the number of sites types of M. edulis and M. trossulus have been deposited at which the two F seauences had different amino acids (2.e.. in the GenBank database (accession numbers u50212- polymorphic sites widin the F lineage).
\ ,
U50219). Table 1 presents the inferred COIII amino acid sequences of the M and F Mytilus mitotypes aligned against the four other mollusk species and Drosophila.
Higher rate of molecular evolution
in the
M lin- Amino acid distances for all pair-wise amino acid se-TABLE 2
Poisson-corrected amino acid distances of the sequences presented in Table 1
Fed1 F-tr 1 M-edl M-trl Lasaea Katharina Albinaria Octopus Drosophila
F e d 1 - 0.0091 0.0189 0.0226 0.0700 0.0664 0.0697 0.0824 0.0675
F-tr 1 0.0224 - 0.0194 0.0222 0.0683 0.0653 0.0680 0.0816 0.0664
M-ed 1 0.0927 0.0968 - 0.0202 0.0700 0.0659 0.0692 0.0816 0.0675
M-tr 1 0.1298 0.1257 0.1050 - 0.0677 0.0669 0.0709 0.0824 0.0664
Lasaea 0.7949 0.7685 0.7949 0.7598
-
0.0522 0.0599 0.0663 0.0535Katharina 0.7346 0.7178 0.7262 0.7432 0.5162 - 0.0492 0.0504 0.0464
Albinaria 0.7868 0.7604 0.7779 0.8049 0.634'2 0.4700 - 0.0592 0.0513
Drosophila 0.7517 0.7346 0.7517 0.7346 0.5367 0.4299 0.5028 0.45 13 -
octopus 0.8607 0.8490 0.8490 0.8607 0.6354 0.4130 0.5326 - 0.0533
Distances are given below the diagonal, standard errors above the diagonal. Gaps and the missing sites in the Octopus sequence were removed only in pairwise comparisons.
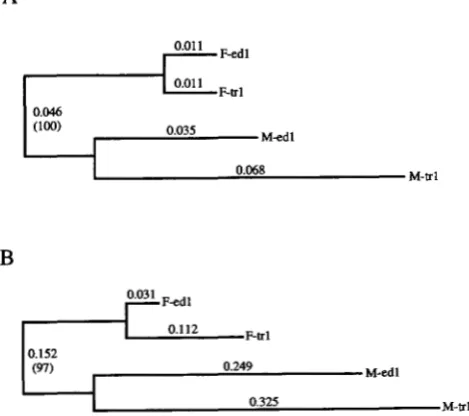
the amino acid sequences and the nucleotide sequences of segment #2 for the M and F mitotypes (Figure 1)
produced results similar to those previously published
(RAWSON and HILBISH 1995; STEWART et al. 1995), i.e.,
(1) the four Mytilus sequences cluster by gender rather than by species (with bootstrap support 297%) and (2)
the M lineage evolves faster than the F lineage. The relative-rates test (WU and LI 1985) is the most appropriate way for comparing nucleotide substitution rates along independently evolving lineages, but this test requires the use of an outgroup that is closely re- lated to the clade to which the compared lineages be- long. For Mytilus, the closest available COIZI sequence
A
7
0.01 1 F-edlI
0.068 M - e lFIGURE 1.-Unrooted neighbor-joining trees of the two ma- jor male ( M e d l and M-trl) and the two major female (F-edl and F-trl) mitotypes in M. edulis and M. trossulus, respectively. Genetic distance matrices used to produce these trees were based on (A) 271 amino acid residues of the qtochrome c oxi-
dase subunit I11 gene and (9) 119 bp of nucleotide sequence from a region of unassigned function. Numbers indicate branch lengths (unbracketed) and percentage bootstrap s u p port (bracketed). Parsimony analyses yielded the same topolc- gies.
is that of the bivalve L. australis ( 0 FOICHIL and SMITH 1995). The lineages leading to Lasaea and Mytilus have been separated by more than 500 million years and the average nucleotide distance between the Lasaea and the Mytilus F or M COIII gene is 0.56 (STEWART et al. 1995). The amino acid divergence for the same gene is 0.78 (Table 2) and, indeed, this divergence is not different than the divergence of Mytilus from Drosoph- ila or from the other mollusks. The high degree of divergence invalidates the use of any of these sequences in the relative-rates test. However, the substitution rates can be compared in our case because the F and M
lineages are found in each of two closely related species. This allows us to assume that the F sequences of M.
edulis and M. trossulus diverged from each other at the same point in time as the M sequences of these two species. Under this assumption, the Poisson-corrected number of amino acid substitutions per site (A) is di- rectly proportional to the substitution rate, so they can
be compared directly. The distances between F-edl and F-trl and between M-edl and M-trl are AF = 0.022 ?
0.009 and AM = 0.105 ? 0.020, respectively. Since these two values do not overlap within ?2.8 SE, the probabil- ity that they are equal is <0.004.
The unassigned region produced similar results, with the M lineage evolving significantly faster than the F lineage (KM = 0.390 ? 0.045; I(F = 0.127 ? 0.031; P
<
0.001). The conservativeness of the unassigned region in the F lineage is also evident from the fact that no difference was observed between our F-edl sequence and that of HOFFMANN et al. (1992), even though these sequences were extracted from different individuals.
1.0
-
0.8
-
0.6
-
Nucleotide Divergence
0.4
-
0.2
-
0 M a l e 0 0 Female 0
Second 16s First Unassigned Third
Codon rRNA Codon Region Codon Position Position Position
FIGURE 2.-Nucleotide divergences (in rank order) be- tween the M and F mitotypes in M . edulis and M. trossulus.
Values for the 16s rRNA gene are taken from RAWSON and HILBISH (1995). Bars, ?I SE.
mitotype in which this difference is statistically signifi- cant. This suggests that the unassigned region may not be totally devoid of function or has not been so in the past. An analysis based on secondary structure did not, however, produce evidence for a possible function. The free energy value associated with the potential second- ary structure for each of the four sequences of the unas- signed region were not significantly different from those of randomized sequences of the same length and nucleotide proportions (data not shown).
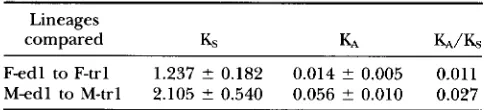
Rejection of neutral evolution: The 813-bp of COIII
sequence for the most common F and M mitotypes of
M. edulis and M. trossulus were compared for differences in the number of synonymous (&) and nonsynony- mous ( K A ) substitutions (Table 3). Both these numbers were higher in the M lineage, but the difference was not significant for
I&
(P = O . l l ) , whereas it was signifi- cant for K A ( P = 0.002). On the assumption of equal times of divergence of Fed1 from F-trl and of M-edl from M-trl, the two lineages accumulate synonymous substitutions at similar rates, but the M lineage accumu- lates nonsynonymous substitutions at a much faster rate. As a result, the KA/& ratio was twice as high for the M lineage. This observation implies either that theM lineage is under relatively relaxed selection or that the F lineage is under relatively strong selection.
TABLE 3
Jukes-Cantor corrected numbers of synonymous
(4)
and nonsynonymous (&) substitutions per siteLineages
compared Ks K4 KA/&
Fed1 to F-trl 1.237 2 0.182 0.014 ? 0.005 0.011
M-edl to M-trl 2.105 2 0.540 0.056 ? 0.010 0.027
TABLE 4
Numbers of fixed and polymorphic, synonymous and nonsynonymous substitutions among the
M
and Flineages of Mytilus
Substitutions
Fixed (F) Polymorphic (P) P/F
Nonsynonymous 5 15 3
Synonymous 6 108 18
Substitutions are either fixed between the M and the F lineages or polymorphic within the lineages. Probability from contingency test, P = 0.011 (from Fisher's exact test).
This conclusion was reinforced when MCDONALD and
KREITMAN'S (1991) test for adaptive molecular evolu-
tion was applied to the Mytilus sequences (Table 4). Specifically, there were more fixed nonsynonymous substitutions than expected. In fact, the ratio of poly- morphic to fixed sites was six times larger among synon- ymous than among nonsynonymous sites. As a conse- quence, the hypothesis that both the F and M mtDNA lineages of Mytilus evolve according to the neutral model of molecular evolution is rejected.
Evidence for relaxed selection for the M lineage: Of the 254 amino acid sites listed in Table 1, several were not scored in Octopus and others were represented by gaps in one or more of the six taxa. The 196 sites for which amino acid readings existed for all sequences were divided into 82 conservative sites ( i e . , they were occupied by the same amino acid residue in Lasaea, Katharina, Albinaria, Octopus and Drosophila ) and 114 variable sites ( i e . , the amino acid residue was differ- ent in at least one of these five taxa). When the four Mytilus sequences were examined together, they were more likely to share the same amino acid at conservative sites than at variable sites (Table 5). This is not surpris- ing given the way the sites were classified. More interest- ing results were obtained when the same comparison was confined to sequences of the same gender associa- tion. While there was no statistical difference in the number of substitutions at these two classes of sites be- tween the two heterospecific F sequences (Table 5 ) , the number of substitutions between the two M sequences was much larger for variable sites (Table 5). More im- portantly, whereas the number of sites at which the two
TABLE 5
Distribution of amino acid (aa) substitutions at conservative and variable sites
Among Among
Sequences conservative variable
compared sites sites
All Mytilus sequences
Same aa 78 89
At least one
aa different 4 25
P = 0.0005
F sequences
Same ad 81 109
Different aa 1 5
P = 0.202
M sequences
Same aa 80 95
Different aa 2 19
P = 0.001
Conservative and variable sites as defined from the non-
Mytilus taxa. Probabilities are calculated from Fisher's exact test.
accumulating amino acid differences at sites that are, on the basis of external evidence, less conserved.
This conclusion is reinforced if we consider the pat- tern of variation across the COIIIgene. When the gene was divided into eight segments, we observed that nei- ther the conservative sites nor the sites with different amino acids in the two Mytilus M sequences were dis- tributed in a homogeneous fashion among segments (Figure 3A) (conservative sites: chi square 13.172 on 6 d.f., 0.05
< P
<
0.025; different amino acid in the M sequences: chi-square 13.434, 0.05<
P<
0.025). More importantly, there was a clear negative correlation be- tween these two distributions indicating that the M lin- eage tends to accumulate amino acid substitutions at the parts of the molecule that are least constrained by selection (Figure 3B). I n contrast, the six sites at which the two F molecules have different amino acids ap- peared to be randomly distributed along the molecule.DISCUSSION
Different rates of mtDNA molecular evolution have been reported for different taxa (MARTIN and PALUMBI
1993; RAND 1994), but the M and F lineages of Mytilus (SKIBINSKI et al. 1994b; RAWSON and HILBISH 1995;
STEWART et al. 1995) and Anodonta (LIU et al. 1996) are the only known cases of conspecific mtDNA lineages that evolve at different rates. A faster rate of divergence of the M lineage as compared to the F lineage in Mytilus was noted in restriction digests of PCR products con- taining regions of the COIII and AD2 genes (SKIBINSKI
F z 1 0 1 0 2 1 0 1
r = - 0.81
P < 0.01
0
0 0
0 .
0 - 0 0
1 1 1 1 1 1 1 1 1 1
2 4 6 8 10 12 18 20 14 16
X
FIGURE 3.-The pattern of amino acid variation across the COZZZgene. (A) The distribution of conservative sites ( x ) , sites with a different amino acid in the two M sequences (y) and sites with different amino acid in the two F sequences ( 2 ) over
the length of the COZZZ gene divided into eight segments. Each segment is 25 amino acids long (except the last which is 21 amino acids long). (B) Linear regression of the number of sites in a segment at which the two M lines have different amino acids (y) against the number of conservative sites ( x ) .
Sites were defined as conservative if they were identical in the four non-Mytilus molluscan taxa and in D. yakuba.
et ul. 1994b), in sequences of the 16s rRNA gene (RAW- SON and H~LBISH 1995) and in sequences of the COZII gene (STEWART et al. 1995). In this study we have dem- onstrated that the faster rate of evolution of the M
genome extends to the amino acid level and to a seg- ment of the Mytilus mtDNA for which no function has been assigned (HOFFMANN et al. 1992). We may there- fore conclude that the faster evolutionary rate is a gen- eralized property of the M molecule.
Following the suggestion by SHIMMIN et al. (1993) that the greater divergence of Y-linked loci us. X-linked loci in primates is due to higher germ cell divisions in males, RAWSON and HILBISH (1995) and STEWART et al.
Molecular Evolution in Mytilus 1355
or why the ratio of fixed to polymorphic sites between a collection of F and a collection of M mitotypes is much higher among the nonsynonymous than the syn- onymous sites. The rejection of neutral molecular evo- lution for the Mytilus mtDNA is independent of the assumption of equal mutation rates for the two lineages. If the
M
lineage had a higher underlying mutation rate than the F lineage, this should not affect the ratio of synonymous to nonsynonymous substitutions within a lineage, given that random mutations affect all sites equally.Previous examples of nonneutral molecular evolu- tion of mtDNA (reviewed by BALLARD and KREITMAN
1995) include the cytb and
NLl5
regions of Drosophila(BALLARD and KREITMAN 1994 and RAND et al. 1994, respectively) and the iU93 locus in Mus (NACHMAN et
al. 1994). One interpretation of these results is that they implicate adaptive fixation of selectively advantageous mutations ( i e . , “selective sweeps”). Because sweeps do not affect the underlying rate of mutation, they would not increase the rate of molecular evolution but would reduce polymorphism (HUDSON 1994; RAND et al.
1994). If selective sweeps are consistently more com- mon in one lineage than another, the former should be less polymorphic. This allows us to reject another hypothesis that has been put forward to explain the different rates of evolution of the gender-associated mtDNA lineages of Mytilus. SKIBINSKI et al. (1994b) sug- gested that the external mode of fertilization in mussels may lead to strong pressure on the sperm for high mo- tility or endurance and, thus, to selectiondriven high substitution rate of favorable mutations in the M lin- eage. This would predict a lower level of polymorphism for the M than the F lineage but the opposite appears to be true. Using the data of STEWART et al. (1995), mitotype diversity ( h ) is much higher for the M lineage than for the F lineage in M . edulis and about the same in M. trossulus (Table 6).
One factor that could cause the F and M lineages to evolve at different rates is if the effective population sizes of the two lineages are different and if most substi- tutions are slightly deleterious, as proposed by OHTA (1992) in her nearly neutral model of molecular evolu- tion. Our results could be explained under this model if the effective population size of the M lineage is smaller than that of the F lineage. There are several ways that this could happen. However, the fact that the
M molecule occurs only in males, whereas the F occurs in both sexes, does not imply that the M molecule has a smaller effective size. This is because males are evolu- tionary dead ends for their F molecule. Higher effective population sizes for F could, nevertheless, occur if the sex-ratio is skewed in favor of females. In laboratory pair-matings of mussels there is a strong sex-ratio bias that may favor one or the other sex (ZOUROS et al. 1994b), but in natural populations the sex ratio is not noticeably different from 1:l (SASTRY 1979; FISHER and
TABLE 6
Mitotype diversity of male and female lineages
in M . edulis and M. trossulus
Mitotypes N Mitotypes N
M . edulis
Fed1 45 M-edl 15
F-trl 1 M-ed2 4
Total 46 Med3 1
h = 0.043 (0.029) Med4 2
Med5 1
Med6 8
Total 31
h = 0.699 (0.047)
M. trossulus
F-trl 17 M-tr 1 23
F-tr2 2 M-tr2 5
F-tr3 9 M-tr3 4
F-tr4* 2 M-tr4 10
Total 30 Total
h = 0.600 (0.048) h = 0.635 (0.043)
Diversities were calculated from Table 1 of STEWART et al.
(1995). N = number of times a mitotype was observed; h =
mitotype diversity (S.E. from NEI 1978).
SJUBINSKI 1990). Another cause for smaller effective size for the M molecule could be larger variance in progeny number among males than females (WRIGHT 1938). There have been no studies that address sex-specific progeny variance in natural populations of mussels, but one can imagine how in species with external fertiliza- tion differences in the timing of spawning or amount of sperm released may result in the domination of fertil- izations by a few males. Still another factor that could lead to a smaller effective population size for the M
lineage is that the number of mtDNA copies carried by the sperm is much smaller than that carried by the egg. A single sperm carries fewer than 10 mitochondria (LONCO and DORNFIELD 1967) to perhaps more than a thousand per egg, so the diversity of mtDNA mole- cules with which a male’s germ line starts can be much poorer than that with which a female’s germ line starts. Consequently, stochastic fixation of slightly deleterious mutations during gametogenesis may be much more likely than during oogenesis.
would be stronger than the constraints on a molecule charged with the task of performing in a subset of the three. Typical animal mtDNA, as in humans for exam- ple, is charged with all three tasks. In mussels the F molecule is present in the somatic tissues of both female and male individuals but is not present in the male germ line (or is present in minute amounts). As a result it is not required to function in that milieu. Similarly, the M molecule is not present in females. Furthermore, its presence or absence in male somatic tissues appears to vary according to tissue (STEWART et al. 1995) and also species (B. W. SUTHERLAND, unpublished results), but it never occurs in isolation of the F type. Thus, the M molecule is relieved from functioning in the second arena, and its participation in the first arena may be drastically reduced or completely absent. It follows that in terms of relative level of selective constraint, the M
mtDNA should be the least constrained, followed by the
F, followed by the mtDNA with standard uniparental transmission. This hypothesis is consistent with the ob- servation that most amino acid substitutions in the M lineage are at sites that are evolutionarily labile in other species, and at the same time explains why the M ge- nome has not accumulated any nonsense substitutions and has not turned into an ultraselfish element whose only performance is to ride with the sperm. We note that this hypothesis and the hypothesis of smaller effec- tive population size for the M lineage are not mutually exclusive, and indeed when coupled they would en- hance each other’s effect. Because of different selective constraints, a mutation that is deleterious for the F ge- nome could be only slightly so for the M genome. Its probability of fixation in the F genome will be small both because of its large deleterious effect and because of the F genome’s large effective population size. Its probability of fixation in the M genome will be larger both because of its mild deleterious effect and this ge- nome’s smaller effective population size. At the present time, there is no direct evidence for different selective pressures associated with differences in tissue-specific distribution, so this explanation for the unequal rates of evolution of gender-specific mtDNA lineages must be considered only as a working hypothesis.
We thank Dr. G. RODAKIS of the University of Athens, Greece for kindly providing the Albinaria sequence before its appearance in the literature. Dr. J. H. MCDONALD provided useful advice regarding his test for nonneutral molecular evolution. A. 0. BALL, R. W. BAIL, W. R. HOEH, and B. W. SUTHERIAND also provided helpful discussions. This manuscript also benefited from the comments of M. LSNCH and two anonymous referees. This research was supported by grants from the Natural Sciences and Engineering Research Council of Canada (NSERC) to E.Z. and by the Research Development Fund (Dalhousie University) to D.T.S. D.T.S. was also the recipient of an NSERC post- doctoral fellowship award.
LITERATURE CITED
BALLARD, J. W. O., and M. KREITMAN, 1994 Unraveling selection in the mitochondrial genome of Drosophila. Genetics 138: 757-772.
BALLARD, J. W. O., and M. KREITMAN, 1995 Is mitochondrial DNA a strictly neutral marker? TREE 10: 485-488.
BARRICA SOSA, I. D. L. A., K BECKENBACH, B. HARTWICK and M. SMITH, 1995 The molecular phylogeny of five eastern North Pacific octopus species. Mol. Phylogen. Evol. 4: 163-174. BOORE, J. L., and W. M. BROWN, 1994a Complete DNA sequence
of the mitochondrial genome of the black chiton, Katharina tuni- cata. Genetics 138: 423-443.
BOORE, J. I.., and W. M. BROWN, 1994b Mitochondrial genomes and the phylogeny of mollusks. Nautilus Suppl. 2: 61-78.
CIARS, D. O., and D. R. WOLSTENHOLME, 1985 The mitochondrial DNA molecule of Drosophila yakubu: nucleotide sequence, gene organization, and genetic code. J. Mol. Evol. 22: 252-271. FISHER, C . , and D. 0. F. SKIBINSKI, 1990 Sex-biased mitochondrial
DNA heteroplasmy in the marine mussel Mytilus. Proc. R. Soc. Lond. B 242: 149-156.
HATZOCLOU , E., G. C. RODAKIS and R. LEC~WIDOU, 1995 Complete sequence and gene organization of the mitochondrial genome of the land snail Albinaria c o m k u . Genetics 140: 1353-1366. HOEH, W. R., K. H. BIAKLES and W. M. BROWN, 1991 Heteroplasmy
suggests limited biparental inheritance of Mytilus mitochondrial DNA. Science 251: 1488-1498.
HOFFMANN, R. J., J. L. BOORE and W. M. BROWN, 1992 A novel mitochondrial genome organization for the Blue Mussel Mytilus edulis. Genetics 131: 397-412.
HUDSON, R. R., 1994 How can the low levels of DNA sequence variation in regions of the Drosophila genome with low recombi- nation rates he explained? Proc. Natl. Acad. Sci. USA 91: 6815- 6818.
HURST, L. D., and R. F. HOEWI‘RA, 1994 Shellfish genes kept in line. Nature 368: 81 1-81 2.
KLJMAR, R, R TAMLJRA and M. NEI, 1993 MEGA: MokcularEvolution- aly Genetics Analysis, version 1.02. Pennsylvania State University, University Park.
LAMBERT, C. C., and D. E. BATTAGLIA, 1993 Loss of the paternal mitochondrion during fertilization. Zool. Sci. 10: 31 -37. LIU, H.-P., J. B. MITTON and S.-R Wu, 1996 Gender-specific mito-
chondrial DNA within and among populations of the freshwater mussel, Anodonta grandis grandis. Evolution (in press).
LONAGO, F. J., and E. J. DORNFIELU, 1967 The fine structure of sper- matid differentiation in the mussel, Mytilus edulis. J. Ultrastruct. Res. 20: 462-480.
MCDONAI.D,J. H., and M. KREITMAN, 1991 Adaptive protein evolu- tion at the Adh locus in Drosophila. Nature 351: 652-654. MARTIN, A. P., and S. R. PAI.UMBI, 1993 Body size, metabolic rate,
generation time, and the molecular clock. Proc. Natl. Acad. Sci.
NACIIMAN, M. W., S. N. BOMR and C. F. AQUADRO, 1994 Nonneutral evolution at the mitochondrial NADH dehydrogenase subunit 3 gene in mice. Proc. Natl. Acad. Sci. USA 91: 6364-6368. Nel, M., 1978 Estimation of average heterozygosity and genetic dis-
tance from a small number of individuals. Genetics 89: 583-590. 0 FOIGHIL, D., and M. J. SMITH, 1995 Evolution of asexuality in the
cosmopolitan marine clam Lasaea. Evolution 4 9 140-150. OHTA, S., 1992 The nearly neutral theory of molecular evolution.
Annu. Rev. Ecol. Syst. 23: 263-286.
RAND, D. M., 1994 Thermal habit, metabolic rate and the evolution
of mitochondrial DNA. TREE 9 125-131.
RAND, D. M., M. DORFSMAN and L. M. KANN, 1994 Neutral and non- neutral evolution of Drosophila mitochondrial DNA. Genetics 138: 741 756.
RAWSON, P. D., and T. J. HII.BISH, 1995 Evolutionary relationships among the male and female mitochondrial DNA lineages in the
Mytilus edulis species complex. Mol. Biol. Evol. 12: 893-901. SAITOU, N., and M. NEI, 1987 The neighbor-joining method: a new
method for reconstructing phylogenetic trees. Mol. Biol. Evol. 4 406-425.
SASTRY, A. N. 1979 Pelecypoda (excluding Ostreidae), pp. 113-292 in Repoduction ofMarine Invertebrates, edited by A. C. GIESE and J. S. PEARSE. Academic Press, New York.
SHIMMIN, L. C., B. H.3. CHANC and W.H. LI. 1993 Maledriven evolution of DNA sequences. Nature 362: 745-747.
SKIBINSKI, D. 0. F.,C. GALLAGHERandC. M. BEYNON, 1994a Mitochon- drial DNA inheritance. Nature 368: 817-818.
Molecular Evolution Mytilus 1357
limited mitochondrial DNA transmission in the marine mussel Mytilus edulis. Genetics 138: 801-809.
STEWART, D. T., C. SAAVEDRA, R. R. STANWOOD, A. 0. BALL and E.
ZOUROS, 1995 Male and female mitochondrial DNA lineages in the Blue Mussel (Mytilus edulis) species group. Mol. Biol. Evol.
12: 735-747.
SWOFFORD, D. L., 1991 PAUP: Phylogenetic Analysis Using Parsimony, version 3.1.1. Illinois Natural History Survey, Champaign. TERRETT, J., S. MILES and R. K. THOMAS, 1994 The mitochondrial
genome of Cepaeu nemmulis (Gastropoda: Stylommatophora): gene order, base composition, and heteroplasmy. Nautilus
WRIGHT, S., 1938 Size of population and breeding structure in rela-
WU, C.-I., and W.-H. LI, 1985 Evidence for higher rates of nucleotide SUPPI. 2: 79-84.
tion to evolution. Science 87: 430-431.
substitution in rodents than in man. Proc. Natl. Acad. Sci. USA
82: 1741-1745.
ZOUROS, E., K. R. FREEMAN, A. 0. BALL and G. H. POCSON, 1992
Direct evidence for extensive paternal mitochondrial DNA inher- itance in the marine mussel Mytilus. Nature 359: 412-414. ZOUROS, E., A. 0. BAIL, C. SAAVEDRA and K R. FREEMAN, 1994a
Mitochondrial DNA inheritance. Nature 368: 817-818. ZOUROS, E., A. 0. BAIL, C. SAAVEDRA and K. R. FREEMAN, 199413
An unusual type of mitochondrial DNA inheritance in the blue mussel Mytilus. Proc. Natl. Acad. Sci. USA 91: 7463-7467. ZUKER, M., and P. STEIGLER, 1981 Optimal computer folding of
large RNA sequences using thermodynamics and auxiliary infor- mation. Nucleic Acids Res. 9: 133-148.