Transactions of the 17th International Conference on Structural Mechanics in Reactor Technology (SMiRT 17) Prague, Czech Republic, August 17 –22, 2003
Paper # H04-6
Simulating Structural Collapse of a PWR Containment
Nawal K Prinja 1), David Shepherd 2)
1) Technical Manager, NNC Limited, Knutsford, Cheshire WA16 8QZ, UK
2) HM Principal Inspector (Nuclear Installations), NII, HSE, St Peter’s House, Bootle, Merseyside L20 3LZ, UK
ABSTRACT
NNC Limited was sponsored by NII, HSE (UK) to conduct finite element analysis to simulate the over-pressurisation tests conducted on a ¼ scale model of a pre-stressed concrete containment vessel (PCCV) by Sandia National Laboratories (SNL). The tests and the results indicated three distinct stages of structural response as the PCCV approached its failure load. The first stage was essentially an elastic response. The second stage displayed nonlinear behaviour, which started after onset of substantial concrete cracking and involved local yielding or fracture of structural components. The third stage involved extensive concrete cracking and rapid increase in strains leading to global structural collapse.
This paper discusses the engineering judgment used to develop the 3D finite element (FE) global model, which was successfully analysed to predict the failure mode. For the Limit State Test (LST), it was shown that the liner ruptures before structural collapse. For the Structural Failure Mode Test (SFMT), the asymmetric behaviour was successfully predicted, identifying the weak area in the PCCV where the structural collapse was initiated. This was possible because the 3D model simulated the interaction of the essential structural features such as the tendons, buttresses, liner, penetrations and the base mat. Explicit modelling of the post-tensioned tendons allowed the model to accommodate frictional loss, simulating realistic reduction in the pre-stress levels in certain areas. Detailed modelling of the penetrations and buttresses simulated local stiffening of the cylindrical wall. The maximum deflection was expected at the mid-height of the wall in the area away from local stiffening and where the pre-stress levels had reduced due to friction. This weak area was identified by the FE model and was confirmed by the test.
KEYWORDS: Limit load analysis, finite element, concrete, containment, structural failure, stress, rupture, cracking, yield, pre-stressed, tendons, steel liner
INTRODUCTION
The U.S. Nuclear Regulatory Commission (USNRC) and the Nuclear Power Engineering Corporation (NUPEC) of Japan sponsored an international round robin analysis to predict the limit load of the ¼ scale PCCV, shown in Figure 1, which was tested at Sandia National Laboratories (SNL) in USA. The aim was to provide experimental data to validate analytical models used to predict the response of containments pressurised at levels far beyond their design basis.
THE TEST MODEL
The PCCV structure built and tested at the SNL [1] was a uniform 1:4 scale model of the containment structure of Unit 3 of the Ohi Nuclear Power Station in Japan. An outline of the test model is shown in Figures 1 and 2 along with some selected output locations where wall displacements were measured. The test model represented all the main structural features of the Ohi-3 containment vessel which is a steel-lined, pre-stressed concrete cylinder with a hemispherical dome and two vertical buttresses. The scaled model was designed by MHI and Obayahsi Corporation with the design pressure, Pd, of 0.39 MPa. It was post-tensioned with 108 hoop and 90 vertical steel tendons that are anchored at the buttresses and basemat respectively. Each hoop tendon covered the full circumference of the vessel and was anchored at the buttresses placed at 90° and 270° azimuths. The tendon gallery enclosed the anchorage for the vertical hair-pin tendons and was located in the basemat. The basemat, a 3500mm thick concrete slab supported the vessel’s superstructure.
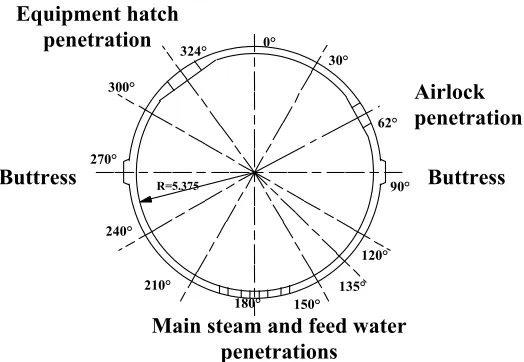
The test model had three main areas of penetrations (Figure 2): the airlock, the equipment hatch and a group of steam/feed water penetrations.
45o
EL 6.20m
EL 0.25 m
1 2
3 4 5 6
EL 4.68m
EL 2.63m
EL 1.43m 7
14 53
Referen ec EL 0
EL -3.5 m EL 10.75 m Spring Line
At 0o azimuth At 135o azimuth
At 324o azimuth
Fig 1. Sectional view of the model indicating instrumentation locations on the wall
324°
Equipment hatch penetration
300°
90°
120°
150° 180°
Main steam and feed water penetrations
210° 240°
135° R=5.375
270°
62° 30° 0°
Airlock penetration
Buttress Buttress
LIMIT LOAD TESTS
The PCCV was subjected to two main structural tests: Limit State Test (LST) and Structural Failure Mode Test (SFMT). In the LST, conducted in October 2000, nitrogen gas was used to pressurise the containment. The test was limited because the vessel leak rates increased beyond the supply limit of the pressurization system. Liner tearing was identified as the mode of failure which dictated the limit load. According to the results presented by SNL[1] the NNC/HSE model was one of the four out of the total of 17 participants, which successfully predicted this failure mode. Whilst the LST achieved a pressure of 1.295MPa (3.3 Pd), well beyond the design basis, the overall PCCV structure remained substantially intact after the LST. The sponsors agreed to extend the test and SNL sealed the leaks and conducted the SFMT by using a water pressurisation system. The SFMT was conducted on 14 November 2001 and achieved its objective of causing global collapse of the PCCV structure, reaching a pressure of 1.423MPa (3.65 Pd).
ENGINEERING JUDGEMENT AND DEVELOPMENT OF FE MODEL
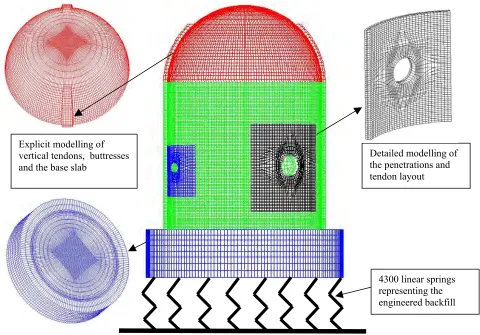
Predicting response of a complex structure like a PCCV, at pressures well beyond the design pressure, requires complex nonlinear analysis. The analysis was conducted by developing a full 3D global model shown in Figure 3 which was analysed by using the general purpose FE code ABAQUS [2]. It was not practical to take account of all the features and variables in one mathematical model. Therefore, engineering judgement was used to select the features and the modelling techniques to represent the important physical aspects which are explained in the following sections.
Explicit modelling of vertical tendons, buttresses and the base slab
4300 linear springs representing the engineered backfill Detailed modelling of the penetrations and tendon layout
Fig 3. Full 3D FE model of the PCCV
Modelling of Structural Features
The liner was modelled using finite strain membrane type elements as they are primarily loaded by in-plane tension and shear. To simulate stretching and shearing of the liner, the liner anchorage stiffness was represented by use of spring elements. The reinforcements were modelled as smeared layer of metal. The horizontal tendons in the hoop direction were expected to expand with the concrete bulk and were modelled using the smeared layer approach, but the vertical tendons in the wall were modelled explicitly using truss elements to allow for relative sliding as the wall bends under pressure loading.
The geometric features of the main penetrations and buttresses were modelled accurately to capture the extra stiffening provided by local thickening of the wall and deviations in the tendon layout. Such features provide local stiffening which influences the structural behaviour and prevent uniform radial expansion of the wall
Modelling of Concrete Material
The ‘smeared crack’ approach was used to simulate concrete cracking as it does not require prior knowledge of the crack location and direction. The ‘smeared crack’ approach involves reduction in the effective stiffness of an element with development of a crack. This leads to numerical problems when extensive cracking occurs at high pressures. This problem was overcome by using the concrete material model ‘ANACAP’ from ANATECH [3] combined with the general purpose FE code ABAQUS [2] from HKS Inc. The concrete model in ABAQUS could not provide converged solution after 0.6 MPa due to onset of extensive cracking. The inclusion of the ANACAP routine, which has smoother curves for tension stiffening behaviour and tension/compression failure surfaces, enabled the analysis to proceed to higher pressure and predicted the failure load and mode of failure with reasonable accuracy. Shrinkage and creep were found not to influence the limit load prediction.
Pre-stressing
Loss of preload due to anchorage transfer and friction effects plays a significant role. This loss of load results in areas of the concrete that are more prone to failure due to cracking. In the vertical direction post-tensioning losses due to friction were ignored. In the hoop direction friction losses determined from the following relationship were included:
(1) )
001 . 0 ( 1
L
e
P
P
=
−µβ−OBSERVED FAILURE MODES
The LST results showed that the failure was due to liner rupture which occurred well before any failure of the pre-stressing tendons. These tears occurred very near the end of the test. The liner strains were less than 0.2% until the pressure passed 1.1MPa (or 2.8Pd), after which they increased very rapidly. Inspection of the liner tears after the LST indicated that all the tears were associated with vertical field welds. The first tears occurred along the edge of the equipment hatch embossment (the edge nearest to the 0o azimuth) at approximately 2.5Pd. The FE analysis predicted the largest strain at this location because of two main reasons: (a) there was a step change in the liner thickness, and (b) the area around 0o azimuth had the lowest pre-stress due to frictional losses. Due to the lack of information about the rupture strain of the welded liner, the analysis could not predict the exact pressure at which the liner rupture would occur but it accurately identified the failure mode and the location.
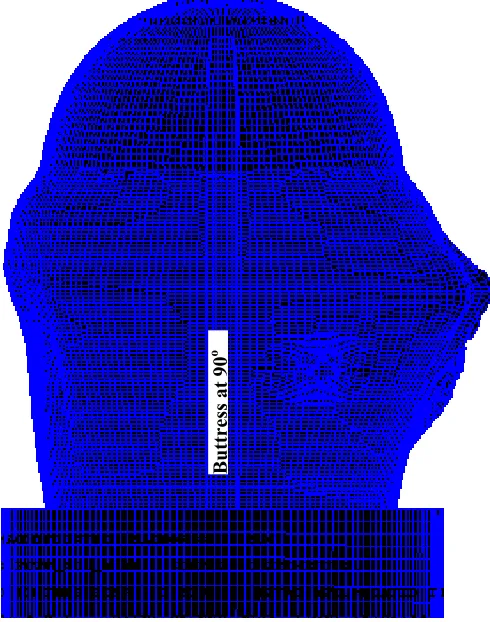
The SFMT resulted in total structural collapse which was initiated by localised rupture approximately at the mid-height of the vessel wall near 0o azimuth. The deformation of the wall captured on film is shown in Figure 4. The sequence of events show that there was shear failure at the wall/base junction which happened after the wall had ruptured.
SIMULATION OF STRUCTURAL COLLAPSE
Fig 4. Localised wall rupture (view from 90o azimuth) followed by total structural collapse during the SFMT (courtesy SNL)
Buttress
at 90
o
(a) 1.0xPd 0 2 4 6 8 10 12
0.00 10.00 20.00 30.00
Radial Displacement (mm)
E le vat io n (m ) Test Analysis (b) 2.0xPd 0 2 4 6 8 10 12
0.00 10.00 20.00 30.00
Radial Displacement (mm)
E lev ati o n (m ) (c) 3.0xPd 0 2 4 6 8 10 12
0.00 10.00 20.00 30.00
Radial Displacement (mm)
E lev at io n ( m ) (d) 3.5xPd 0 2 4 6 8 10 12
0.0 10.0 20.0 30.0 40.0
Radial Displacement (mm)
E lev at io n ( m )
the test is much steeper than that predicted by the analysis. This was expected as the PCCV had pre-existing cracks from previous tests and furthermore the pressure penetration of the cracks during the test was not modelled in the FE analysis. The analysis predicts almost monotonically increasing strain levels whereas the test results show sudden increase or stress reversal, which is possibly due to sudden rupture of the rebars or tendons. The analysis model allows material yielding but does not simulate rupture.
Fig 7. Radial deflection of the wall at location 14
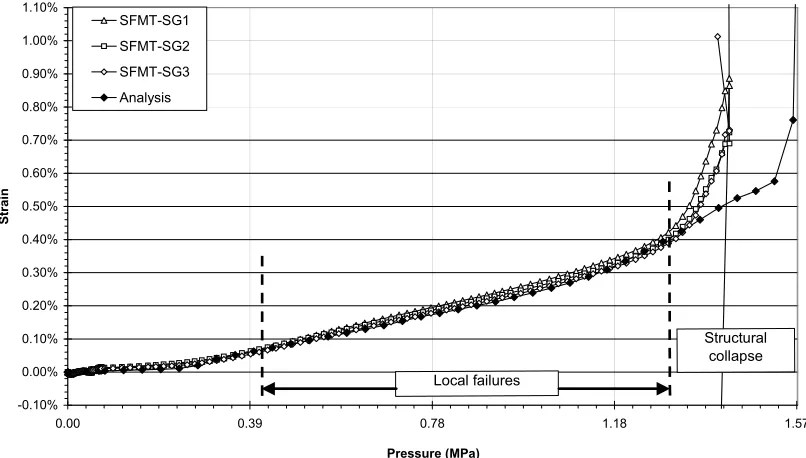
During the SFMT, SNL used three strain gauges to measure strains in the hoop tendon at Location 53 which was very near the rupture location on the wall. Figure 8 indicates that the tendon strains predicted by the analysis at Location 53 agree well with the test results. Again, it should be noted that the FE model allowed tendon yielding but did not simulate tendon rupture.
Fig 8. Strains in the hoop tendon at Location 53 near the failure region 0.00
20.00 40.00 60.00 80.00 100.00
0.00 0.39 0.78 1.18 1.57
Pressure (MPa)
Displace
ment (mm)
Test Analysis
Local failures
Structural collapse
-0.10% 0.00% 0.10% 0.20% 0.30% 0.40% 0.50% 0.60% 0.70% 0.80% 0.90% 1.00% 1.10%
0.00 0.39 0.78 1.18 1.57
Pressure (MPa)
Str
ai
n
SFMT-SG1 SFMT-SG2 SFMT-SG3 Analysis
Local failures
The localised rupture in the PCCV wall occurred due to the asymmetric expansion of the PCCV. As expected, the minimum radial deformation is at the two buttresses at 90o and 270o. This is due to the extra stiffening at the buttresses and the high tendon loads at the anchorage points. The lowest tendon loads (pre-stress) occur at 0o and 180o due to the friction loss. In the vertical direction, due to the stiffening effects of the base and the dome, the maximum radial deformation was expected at the mid-height of the wall. Comparing the two locations (0o and 180o) at the mid-height, there is extra stiffening at 180o provided by the insert plate for the minor penetrations, whereas at 0o there is a zone with no stiffening, minimum pre-stress level and the two stress raising features (i.e. airlock and equipment hatch penetrations). This region experiences high stress levels. The model rightly identifies this area (Fig 6) as the weakest area, which was confirmed by the SFMT (Fig 5). The vessel ruptured at this location.
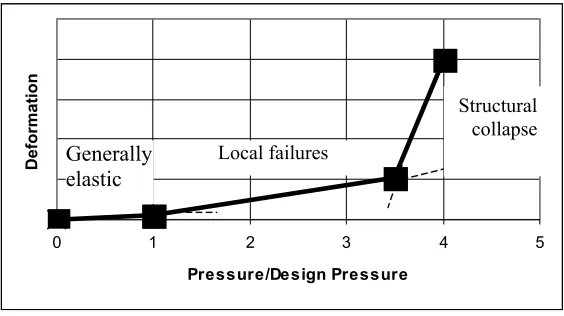
By inspection of Figure 7, showing the maximum radial deflection, and Figure 8, showing maximum strain in hoop tendon, three distinct stages of the PCCV’s behaviour can be seen as it approached the collapse load. The nonlinear behaviour starts soon after the design pressure is exceeded. Between 1Pd and 3.5Pd, local failures mostly due to yielding in the steel components and extensive cracking in the concrete occur. Beyond 3.5 Pd, the global collapse is initiated leading to catastrophic structural failure. This typical deformation behaviour is summarised in Fig 9.
0 1 2 3 4 5
Pressure/Design Pressure
Deformation
Structural collapse Local failures
Generally elastic
Fig 9. Typical deformation behaviour of PCCV when pressurised beyond design pressure
CONCLUSION
It can be concluded from this study that to predict the nonlinear behaviour of a PCCV subjected to pressures beyond the design basis, it is essential to model the mechanical and structural interaction between the main structural features as well as representing material non-linearity. A carefully developed 3D FE model can predict local as well as global behaviour with fair accuracy.
NOMENCLATURE
L = Length of Tendon.
P = Load at β from tensioning end.
P1 = Load at the tensioning end.
Pd = Design pressure of PCCV (0.39MPa)
β = Change of angle from tensioning end.
µ = Friction Coefficient (0.21)
REFERENCES
1. Sandia National Laboratories, Pre-test Round Robin Analysis of a Pre-stressed Concrete Containment Vessel Model, NUREG / CR-6678, SAND 00-1535, Aug 2000.
2. HKS Inc., ABAQUS/ Standard Users’ Manual, Versions 5.8 and 6.2.