CopTight 0 1995 by the Genetics Society of America
Heterozygosity
and
Fitness: No Association
in
Scots
Pine
Outi Savolainen"
and Philip Hedrickt
*Department of Genetics, University of Oulu, FIN 90570, Oulu, Finland and tDepartment of Zoology, Arizona State University, Tempe, Arizona 85287
Manuscript received November 12, 1993 Accepted for publication February 17, 1995
ABSTRACT
The association of six quantitative traits related to fitness with heterozygosity at 12 allozyme loci has been examined in three populations of Scots pine, Pinus sylvestris. Because of several characteristics of this organism and of this extensive data set, it appeared that this study would show a positive association between heterozygosity and these traits if indeed heterozygotes had higher values for these quantitative traits. Using several different statistical techniques including analysis of variance, regression with the scaling recommended from the adaptive distance model, and multiple regression, no evidence of an association was found. For example, only between 7 and 8% of the regression tests were significant at the 5% level and half of these showed a positive association and half showed a negative association. Further, the multiple regression analysis explained on average only 5.8% of the variation observed in the six different traits and only 1.5% of this variation was explained by a positive association. Power analysis was carried out (for the first time on these type of data), both for the single locus heterozygous advantage and the association of individual multiple locus heterozygosity and the quantitative traits. For diameter and height, two traits often used in similar studies, the average power to detect a single locus heterozygous advantage of 0.10 was 0.737 and the average power to detect a mean heterozygote advantage of 0.05 per locus for multiple loci was 0.797. As a result of this study and an examination of the published results from other studies, it appears that what positive associations have been observed are probably not, in large part, due to the presence of intrinsic heterozygote advantage.
T
HE application of protein electrophoresis to docu- ment the large amount of genetic variation in most species was one of the major breakthroughs in evolutionary genetics (see LEWONTIN 1991 ).
However, since this discovery, a heated debate has continued con- cerning the mechanisms responsible for maintaining this genetic variation. Although the overall pattern of variation for allozymes is generally consistent with ex- pectations of neutrality (e.&, KIMURA 1983; NEI 1987),some studies appear to indicate that different allozyme genotypes may have different fitness consequences
(e.g., KOEHN et al. 1988; WATT 1992). Further, there have been reports that the extent of allozyme heterozy- gosity in an individual may be correlated with various quantitative traits, including a number of fitness compo- nents and life-history traits, although this finding is far from universal (for reviews, see MITTON and GRANT
1984; ALLENDORF and LEARY 1986; ZOUROS and FOLTZ
1987; HOULE 1989; BUSH and SMOUSE 1992; POGSON and ZOUROS 1994).
Determining how general the correlation between individual allozyme heterozygosity and fitness compo- nents is, and the specific cause of any such association, is of great significance in evolutionary genetics as well as for several applied areas in which the research find- ings of population genetics have been suggested as the
Cmespondingauthm: Outi Savolainen, Department of Genetics, Uni- versity of Oulu, FIN 90570, Oulu, Finland.
Genetics 140 755-766 (June, 1995)
basis of breeding programs. For example, both in tree breeding and captive breeding of endangered species, it has been suggested that individual allozyme heterozy- gosity be measured and genotypes with the highest het- erozygosity be selected as breeders. Although these ideas have not been widely adopted in silviculture, there is a general interest in finding a molecular genetic ap- proach to complement the recognized plant breeding protocol generally used ( e.g., BUSH and SMOUSE 1992)
.
Similarly, captive breeding decisions in endangered species are still based on minimizing inbreeding levels and retaining population heterozygosity but there has been recurring interest among conservation geneticists in using molecular measures to determine the best indi- viduals for breeding (e.g., ULS and BALLOU 1986).There are three major genetic explanations for the positive associations between individual heterozygosity and components of fitness ( o r other quantitative traits) that have been proposed (e.g., HOULE 1989; CHARLES- WORTH 1991 ) . First, heterozygotes may have an intrinsi- cally higher fitness than homozygotes, ie., there is het- erozygote advantage (or overdominance as it is often called) at the allozyme loci being examined. Although intrinsic heterozygote advantage is a commonly cited mechanism for maintenance of genetic polymorphism, its presence has been inordinately difficult to document both in its simplest form (e.g., ALLISON 1964; BISHOP
756 0. Savolainen and P. Hedrick
ther, TURELLI and GINSBURG (1983) showed that for most stable, multilocus polymorphisms, the fitness of the genotype increases with heterozygosity, suggesting that if the allozyme loci are under a type of selection that leads to a polymorphic equilibrium there should be an association of individual heterozygosity and traits related to fitness.
Second, statistical associations (linkage disequilibria) between the allozyme loci and other selected (and usu- ally linked) loci may result in apparent heterozygote advantage at the allozyme loci. These secondary (un- known) loci may themselves exhibit heterozygote ad- vantage or they may be dominant. In this latter case, several dominant loci together may result in the appear- ance of marginal heterozygote advantage at the allo- zyme loci. This general phenomenon was originally called associative overdominance by FRYDENBERG ( 1963 )
(see also ZOUROS 1993)
.
When only dominant loci are involved, HOULE ( 1989) prefers the term “dominance- correlation heterosis” to indicate that none of the loci involved exhibit intrinsic heterozygote advantage. The linkage disequilibria necessary here between the marker loci and selected loci may be caused by such factors as genetic drift in a small population or by population structure (e.g., HEDRICK et al. 1978).Finally, there may be associations of allozyme geno- types and components of fitness due to the presence of nonrandom mating or different levels of inbreeding in the population, a phenomenon that can be called genotypic association and quantified using the concept of identity disequilibrium (WEIR and COCKERHAM 1973; CHARLESWORTH 1991; see also HALDANE 1949). In this case again, neutral alleles may show apparent selective effects, here due to the genotypic associations caused by inbreeding and generally enhanced by linkage. As a simple example of what may occur even when there is no linkage between the allozyme loci and selected loci, if inbred individuals that have both low allozyme hetero- zygosity and low fitness are pooled in a sample with outbred individuals that have relatively higher values of both heterozygosity and fitness, then a positive associa- tion of allozyme individual heterozygosity and a fitness component may occur ( e . g . , LEDIG et al. 1983; LEDIC 1986; HEDRICK 1990).
In the present study, we have attempted to determine if intrinsic heterozygote advantage is likely to be a major factor causing the correlation between allozyme hetero- zygosity and a number of quantitative traits related to fitness in Scots pine, Pinus sylvestris. Notice that for the operation of the two explanations besides intrinsic het- erozygote advantage given above, a statistical associa- tion between the allozyme loci and other selected loci needs to be generated either by genetic drift, popula- tion structure, or inbreeding. In the present study, there are two factors that indicate that if such a correla- tion is observed, it is very likely to be the result of intrin- sic heterozygote advantage. First, Scots pine has a very
large population size with extensive pollen flow so that any association caused by linkage disequilibrium gener- ated by genetic drift or population structure is unlikely
(e.g., KOSKI 1970; MUONA and SZMIDT 1985; MUONA
and HARJu 1989). Second, even though Scots pine is self-compatible, even at the mature seed stage level <5% selfs remain ( MUONA and
HARJu
1989). While seeds show an excess of homozygosity due to selfing, adult tree genotypes in Scots pine populations are in Hardy-Weinberg proportions (e.g., YAZDANI et al. 1985;MUONA and WJU 1989) and there is no genetic evi- dence of inbreds surviving. Other data, such as the very high genetic load and extremely high seed-to-adult mortality in Scots pine in Finnish forests, also make it extremely unlikely that there are any inbreds among adults ( e.g., SAVOIAINEN and KKRKKAINEN 1992)
.
As a result, it is unlikely that we would observe in Scots pine an association generated by any of the nonselective evo- lutionary factors mentioned above, such as genetic drift, population structure, or inbreeding unless the loci in- volved were very closely linked.In addition, three other experimental aspects of this present study may also allow us to document intrinsic heterozygote advantage in Scots pine if it is indeed pres- ent. First, we measured six different quantitative traits that are related to fitness, including measures related to viability and to both female and male reproduction. Second, genotypes in two of our populations have been cloned and measurements were taken on multiple ra- mets of the same clone so that an excellent measure of the intrinsic genotypic value is possible. We have also conducted an analysis to determine the power that we have to detect a given selective difference between het- erozygotes and homozygotes and for different multiple locus heterozygotes. Finally, because of the high allo- zyme heterozygosity in Scots pine, we have 12 polymor- phic loci in all our populations so that we have a large range of individual heterozygosity.
MATERIALS AND METHODS
Populations: Three populations were examined, two of
which, Viitaselka and Vilhelminmaki, were seed orchard pop- ulations consisting of vegetatively replicated genotypes, while the third, Mlastunturi, was a natural population. The trees in both of the seed orchards are assumed to be random samples of adult Scots pine from the two areas and consisted of individ- uals from an area wide enough that it is unlikely that there was any inbreeding involved among them. The initial
branches were sampled from adult trees in the Finnish forest
so their genotypes composition should reflect the composi-
tion of the trees that have survived to adulthood. The seed-
to-adult survival is perhaps the stage of strongest selection in
this environment where less than one seed in a 1000 will
mature into an adult tree ( MUONA 1990).
The Viitaselka population ( 6 2 15 N, 27 35 E ) was 3.2 ha
in size and had 25 genotypes, each replicated on the average 20 times in the orchard. The genotypes were originally col- lected from southern Finland between latitudes 61 and 62
Heterozygosity and Fitness 757
planted in 1954 in a grid at 7 m intervals and were all 31 yrs old at the time most of the measurements were taken.
The Vilhelminmaki seed orchard (62 05N, 25 15E) has an area of 3 ha and was planted in 1968. The trees were all 17 yr old at the time most of the measurements were taken, with 5 m intervals between trees. This population had 28 genotypes, each replicated on average 35 times. A complete set of data was available on 23 of these genotypes. The trees in these two seed orchard populations are grafted trees in which the branches were picked from representatives of the
two adult wild populations.
The natural population was on the side of the mountain Yllastunturi, close to tree line and above the Arctic Circle (at 450 m above sea level, 67 34N, 24 11E). This population was in an area of about 50 X 100 m in which all adult trees were included, altogether 44 individuals. The age of the trees was measured by core samples at 1.3 m height, and was found to
be, on average, 120 yr. However, it is known that in this ex- treme environment, north of the Arctic Circle, that cores underestimate the age by at least 20 yr ( ILVESSALO 1965), making the average of the trees in this population conserva- tively 140 yr old.
Quantitative traits: The heights and diameters at breast height were measured for Viitaselka and Vilhelminmaki in 1985 and for Mlastunturi in 1989. In Viitaselka, five trees per genotype were measured and in Vilhelminmaki, o n average six trees per genotype were measured. Female fertility was esti- mated as the number of liters of cones per tree in Viitaselka and Vilhelminm2ki in 1985, and in Ml&tunturi in 1991 as the actual number of female cones. Seed weight per 100 seeds was also measured for Viitaselka from the 1987 seed crop.
Male fertility was estimated by counting male strobili in all
of the populations (for Viitaselka and Vilhelminmaki in 1985 and for YlIQtunturi in 1987). For each tree, the trunk was divided into sections of 1 m, from which one representative branch was sampled. All strobili on this branch were counted. For each genotype, 100 male strobili were measured. SARVAS (1962) has shown that, on average, 1 cm of strobilus corre- sponds to 0.028 gm pollen. This allowed estimation of pollen weights for each tree (as in MUONA and HARJU 1989).
In Viitaselka, the timing of pollen shedding was measured for all genotypes. Two trees per genotype were chosen and eight male strobili around the crown were monitored. The data of the start of pollen shedding for each strobilus was recorded, and the mean was used to characterize the tree. For all these variables in the two seed orchard populations, the mean of five or six trees sampled was used to characterize each genotype.
Enzyme loci: The genotypes of all trees were identified for eight enzyme systems (aconitase, fluorescent esterase, gluta- mate dehydrogenase, glutamate-oxalate-transaminase, leu- cine amino peptidase ( two loci ) , malate dehydrogenase ( two loci), &phospho-gluconate dehydrogenase (two loci), and shikimate dehydrogenase (two l o c i ) ) , making a total of 12 loci. Standard methods of protein electrophoresis were used, specific methods and references are given in MUONA et al.
( 1988). All enzyme genotypes of trees indicated as belonging
to the same genotype were verified. For some purposes, the genotypes were pooled to get loci with two alleles. In this case, the most frequent allele was held distinct and the other alleles were pooled into a second class. This pooling occurred in only six heterozygotes out of the 1104 genotypes and is therefore unlikely to have any effect on the statistical analyses described below.
statistical methods: Allele frequencies, observed heterozy- gosities, and the fixation index were estimated for all 12 loci in the three populations using standard techniques ( e.g., HED-
N ( : K 1985). Analysis of variance was conducted between het-
erozygotes and homozygotes at each locus for all quantitative traits (genotypes heterozygous for a minor allele, there were six overall, were categorized as heterozygotes in this analysis and others described below). Regression analysis of all vari- ables was done in several ways. First, each locus was analyzed separately, by using the number of the most common allele in the individual (2, 1 , or 0 ) as the dependent variable. Second, following the adaptive distance scaling approach of SMOUSE ( 1986) and BUSH et al. ( 1987), we scored heterozygotes as 0 and homozygotes as 1 / P,, where P,, is the observed frequency of homozygote A, A , , and carried out the same regression analysis. Third, an analysis was done by using the number of heterozygous loci out of the 12 polymorphic loci as the dependent variable. Fourth, a multiple regression was done by using 12 independent variables, with heterozygosity at indi- vidual loci as independent variables. For all these analyses, age was used as a covariate for the Yllastunturi population. All analyses were done using the SAS 6.1 program package
(SAS 1987).
Power analysis: What is the probability that we would have detected a given level of heterozygote advantage with the number of genotypes we have in our three samples? O r more precisely, what is the power of our test ( eg., SOKAL and ROHLF 1981 ) , i e . , what is the probability that we would accept the false null hypothesis that the heterozygotes and homozygotes do not differ in their values for the quantitative traits?
For the two populations grown in seed orchards in which there were multiple copies of each genotype, we can use the following approach to determine the power. Assume a genetic model of the phenotype
(P)
such thatPzjk = Y + 1,
+
g,+
ek ( 1 )where p is the overall population mean, I , is the mean devia- tion of a heterozygote or a homozygote at a given locus, g, is the genetic deviation due to the other loci, and ek is the deviation of the environment. The population mean we used is that given in Table 2 for the different traits. For heterozy- gotes and homozygotes, the mean values were p
+
I , and p- I , , respectively. The selective disadvantage of homozygotes relative to heterozygotes is sp so that s is defined as a propor- tion of the population mean. The values of g, and ek were generated using random normal deviates with the genetic and environmental variances estimated for the different traits. The difference between the means of the heterozygotes and homozygotes were tested using a t test ( e.g., SOKAL and ROHLF 1981 ) and compared with the one-tailed t value for LY = 0.05 with 23 (Viitaselka) or 21 (Vilhelminmaki) degrees of free- dom. The power was the proportion out of 1000 samples in which for a given s value the calculated t exceeded the tabular value.
The same approach was used for the natural population at Yllastunturi except that since there were no separate estimates
of the genetic and environmental variance, we defined the phenotypic value as
E,
= p+
I , -kp1
( 2 )where the estimate of the phenotypic variance was used to determine the size of a random normal deviate,
p,.
The above approach was expanded to determine the power for the individual heterozygosity for when all the loci were considered. First, the genotype of the most heterozygous indi- vidual in a sample was initially given a genotypic value of 1.0. The value of the other genotypes was initially given as
w, = ( 1 - S ) n ( 3 )
758 0. Savolainen and P. Hedrick
TABLE 1
Frequencies of most common allele
( p ) ,
observed heterozygosities (E&), and fixation indices ( F ) at 12 loci in three population of Finus sylvesErisPopulation
Viitaselka Vilhelminmaki Mlastunturi
Locus
P
H" FP
HO FP
HO FAco 0.90 0.20 -0.11 0.80 0.39 -0.24 0.96 0.09 -0.05
Gdh 0.62 0.56 -0.10 0.61 0.52 -0.10 0.71 0.41 0.02
Lap-1 0.98 0.04 0.04 0.96 0.09 -0.05 0.99 0.02 -0.01
Lap-2 0.88 0.20 0.22 0.96 0.09 -0.05 0.89 0.18 -0.10
F-Est 0.74 0.16 0.69 0.85 0.30 -0.18 0.80 0.36 -0.12
Got-2 0.58 0.52 -0.07 0.59 0.39 0.19 0.53 0.34 0.40
Md h- 1 0.92 0.16 -0.09 0.96 0.09 -0.05 0.99 0.23 -0.01
Mdh-? 0.56 0.40 0.19 0.72 0.57 -0.39 0.59 0.36 0.25
6-Pgd-1 0.48 0.32 0.36 0.61 0.70 -0.46 0.55 0.64 -0.28
6-Pgd-2 0.68 0.48 -0.10 0.63 0.30 0.34 0.63 0.43 0.08
Sdh-1 0.92 0.08 0.46 0.94 0.13 -0.07 0.86 0.25 0.04
Sdh-2 0.96 0.08 -0.04 0.96 0.09 -0.05 0.98 0.05 -0.02
Mean 0.77 0.28 0.12 0.80 0.30 -0.09 0.79 0.26 0.03
Samples sizes: Viitaselka, N = 25; Vilhelminmaki, N = 23; Mlastunturi, N = 44.
example, in Viitaselka the most heterozygous individual was heterozygous at six loci and the least was heterozygous at one locus so that n = 0 to 5. These values were then standardized by the mean value of the trait in the sample so that approxi- mately half had values greater than the mean and approxi- mately half less than the mean. The array of phenotypic values for a sample was generated as above using the estimated ge- netic and environmental variances. We then calculated the power as the proportion of 1000 such samples that gave a P value c0.05 for regression analysis for a given average hetero- zygous advantage per locus.
RESULTS
Population genetic and quantitative trait data: The basic population genetic data, i.e., the frequency of the most common allele, the observed heterozygosity, and the fixation index from these three populations for the
12 polymorphic loci are given in Table 1. Notice that each population has a number of loci that have two alleles in substantial frequency. This results in a fairly high average observed heterozygosity of 0.277 over the
12 loci and 3 populations. The value of the fixation index ( F ) varies considerably with 14 values being posi- tive and
22
negative. However, because of several large positive values, the average F is slightly positive at 0.02 but is not significantly different from 0.0 (using the approach of BROWN 1970, to obtain the variance of the fixation index, the 95% confidence interval width is 0.04). The five largest absolute Fvalues for individual loci, averaged over populations, were Aco (-0.13), F- Est (0.13), Got-2 (0.17), 6-Pgd-1 (-0.13), and Sdh-l (0.14). Only two of these, Aco and 6Pgd-1, had negative averages that could possibly indicate heterozygous ad- vantage and only one of these two loci, AGO, had negative Fvalues in all three samples. In other words, there is no evidence from these genotypic data of consistentdeviations from Hardy-Weinberg proportions, a finding consistent with little selfing or other inbreeding among these adult individuals (and also inconsistent with strong selection for heterozygotes).
The observed number of individuals with different numbers of heterozygous loci (out of the total of 1 2 )
for the three populations was compared with those ex- pected if the heterozygote frequencies of the loci were independent of each other. The observed numbers were not significantly different from those expected in all three populations, with all chi-square values not sig- nificant. As a result, we can assume that there is a non- significant amount of multi-locus association among these electrophoretic loci in these populations.
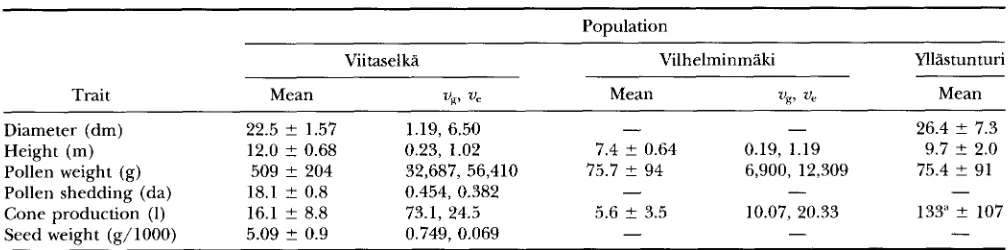
The basic data for the six quantitative traits are given in Table 2. Comparisons over populations should be made with care, because the trees were of different ages when they were measured, i e . , the trees in Viitaselka and Vilhelminmaki were 31 and
17
yr old while the average age in the Yllastunturi population was at least 140. Recall that, in Yllbtunturi, the number given for cone production is the actual number of cones, not liters of cones, as for the other populations. The esti- mates of genetic and environmental variation are also given in Table 2 for Viitaselka and Vilhelminmaki. The overall average broad-sense heritability is 0.415, indicat- ing substantial genetic variation for these quantitative traits within these samples (see also SAVOWNEN et al. 1993).Heterozygosity and Fitness 759
TABLE 2
Means and standard deviations of quantitative traits in three populations of Pinus sylueshis
Population
Viitaselka Vilhelminmaki Yllastunturi
Trait Mean up Ve Mean v e V g , Mean
Diameter (dm) 22.5 2 1.57 1.19, 6.50
-
- 26.4 ? 7.3Height (m) 12.0 2 0.68 0.23, 1.02 7.4 2 0.64 0.19, 1.19 9.7 2 2.0
Pollen weight (g) 509 ? 204 32,687, 56,410 75.7 ? 94 6,900, 12,309 75.4 2 91
Pollen shedding (da) 18.1 t 0.8 0.454, 0.382
-
- -Cone production (1) 16.1 f 8.8 73.1, 24.5 5.6 f 3.5 10.07, 20.33 133" 2 107
Seed weight (g/lOOO) 5.09 ? 0.9 0.749, 0.069
-
--
" Number of cones.
gotes. Overall, of 156 such comparisons, only 12 or
7.7%
were significant, very close to the 5% expected by chance. In addition to looking at individual tests and their significance, we conducted an overall Bonferroni test (see RICE 1989) for the ANOVA values. In this test, the overall level of significance of (Y is obtained bycomparing the individual probability values with (Y
/
kwhere k is the number of tests. If none of the individual
P values are below this level, then there is no signifi- cance. This test showed nonsignificance for all of the populations tested separately ( k = 72, 36, or 48) or jointly ( k = 156).
As another approach to determine whether there is an association between the allozymes and the quantita- tive traits, we calculated a regression of the numbers of the most frequent allele in an individual on the values of the different quantitative traits. Overall, 13 out of
156 of these regressions were significant, or 8.3%, which is again close to the 5% expected by chance.
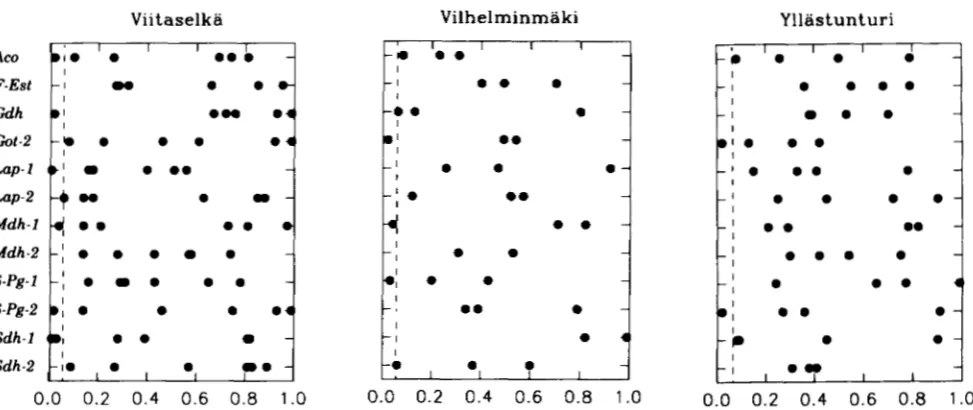
We also looked to see if any loci showed a greater than 5% proportion of tests significant. None of loci had more than two significant ANOVA tests over the three populations and the six different traits, For the regression analysis, the significant locus-trait-popula- tion combinations were generally the same but the lo- cus Sdh-I had four of the significant regression values out of the 13 significant tests found. Further, of the 12 significant tests, the heterozygotes had higher values in six and the homozygotes had higher values in the other six. A useful way to illustrate these results is given in Figure 1 in which the level of significance is given for the three populations and 12 different loci for ANOVA. Obviously, there is no pattern for these results, sug- gesting that there is no locus specific effect on these traits, either favoring heterozygotes or homozygotes.
The Viitaselka population had the highest number, 15 out of 144 or 10.4%, of the tests significant while Vilhelminmaki had 6 of 72 or 8.3% significant and Mia- stunturi had four of 96 or 4.1% significant. These sig- nificant tests were evenly divided between ANOVA and regression with 8, 3, and 2 significant ANOVA tests for Viitaselka, Vilhelminmakii, and Yllistunturi, respec-
tively. Because the quantitative traits in both Viitaselka and Vilhelminmakii were based on means of five or six trees of the same genotype, one might expect if there was any intrinsic association that it would be most likely picked up in these populations. On the other hand, the Yllastunturi population is in a very extreme environ- ment at tree line above the Arctic Circle and one might expect that any associations would be more apparent in such a marginal environment. In any case, the pro- portion of significant tests in all the populations is quite close to 5%, suggesting that these effects had only mar- ginal, if any, influence.
Finally, we checked to see if any trait had a particu- larly high number of significant tests. The traits with the highest proportion of significant tests, three out of 24 or 12.596, were pollen-shedding time and seed weight, both of which we only had measurements on in Viitaselka. In these cases, two of the significant tests were in one direction and one in the other direction. Because we do not have any measurements on these traits in the other populations, we cannot judge whether these higher proportions are just due to chance or might reflect some real effect on these traits. Because these traits individually appear to be unre- lated to the allozyme variants, we made a simple com- posite measure of the traits that may give a measure more closely related to overall fitness. Each of the traits were first standardized to 0 mean and unit variance (after LANDE and ARNOLD 1983). We then defined a simple measure of fitness ( w ) which was equally weighted for viability and reproduction so that
zu = uiability
+
reproduction2 ( 4 )
As a measure of viability, we then gave equal emphasis to seed weight, as an indicator of early survival, and height, as an indicator of late survival, so that
uiability = seed wt.
+
height2 ( 5 a )
760 0. Savolainen and P. Hedrick
tl
0 0 0
I
0.0 0.2 0.4 0.6 0.8 1.0
FIGURE 1.-The probability of significance level for a difference between heterozygotes and homozygotes from the ANOVA for the 12 polymorphic loci in the three different populations. The individual points are the probability level for a given quantitative trait. The vertical broken lines indicate significance at the 5% level.
value to pollen weight and pollen-shedding time to indi- cate male reproductive value. This value can then be equally weighted with cone production, as an indicator of female reproductive value, so that
pollen wt.
+
pollen shed.+
2 ( cone prod. ) 4reprod. =
( 5 b )
This composite measure of fitness can be calculated for each tree and then used in both the ANOVA and regression analysis. None of these tests were significant for the three populations. In other words, this compos- ite measure of fitness does not detect any effects of the allozymes that were missed by examining only one of the quantitative traits related to fitness.
To examine if there are significant associations that are not seen by this approach but are detected by using the adaptive distance scaling suggested by SMOUSE
( 1986), we also carried out the 156 combinations of regressions using the adaptive distance values. Of these tests, 11 (
7%
) were significant at the 5% level. For these significant regressions, the coefficient was positive in six cases and negative in the other five. Most of these significant values were for the same combinations as for the previous regressions.As another approach to examining the association of heterozygosity and the various quantitative traits, we looked at the association of the number of heterozygous loci in individual trees and the value of the six different traits in the three populations using multiple regression (Table 3 )
.
Out of 16 combinations of traits and popula- tions, none were significant at the 5% level. The combi- nation of highest significance was diameter at Yllastun- turi which was significant at the7%
level. However, association of diameter and heterozygosity at Yllastun- turi was negative and, in addition, for Yllastunturi theR' values include the effect of age and that the variabil- ity of diameter in Yllastunturi was mainly due to age. Over all these combinations, only 5.8% of the variation (average R2 value) was explained by the multiple re- gression analysis. In fact, much of this variance was ex- plained by a negative association of heterozygosity and the quantitative traits (see negative values indicated by an asterisk in Table 3 ) and if these negatives values were set to zero only an average of 1.5% of the variance was explained by a positive relationship of heterozygos- ity with the quantitative traits.
As a graphical way to illustrate these results, Figure
2 gives for different numbers of heterozygous loci, the mean values of three traits, pollen production, cone production, and height, for the three different popula- tions. Recall that because there is high polymorphism at a number of loci in these populations, the range of individual heterozygosity is high (compared with many other studies), i.e., from 0 to
7
in Yllastunturi and 1 to 6 in the other two populations. Obviously, there is no apparent positive association in Figure 2 , i.e., low values for these traits having low individual heterozygosity and high trait values having high heterozygosity. In fact, there appears to be a general lack of pattern between these traits (and the other traits that are not shown here) and individual heterozygosity.Power analysis: Because there were replicates of the
Heterozygosity and Fitness
TABLE 3
Significance of regression (R2 and p ) of quantitative characters on number of heterozygous loci per individual and significance of multiple regression using heterozygosity at individual
loci as independent variables in three populations of P. s y Z v e s h . i s
761
Population
~~ ~ ~ ~ ~~
Viitaselka Vilhelminmaki Yllastunturi“
R2 P R‘ P R2 P
Number of heterozygous loci per individual
Diameter 0.04h 0.33
-
-
0.36h 0.07Height 0.01* 0.63 0.09 0.15 0.02h 0.43
Pollen weight 0.01 0.69 0.02 0.48 0.03” 0.53
Pollen shedding 0.02b 0.47 -
-
--
Cone production 0.01 0.70 0.ogh 0.16 0.06 0.42
Seed weight 0.01 0.63 -
-
--
Fitness 0.01 0.81 0.02 0.48 0.16’ 0.1 1
Heterozygosity at individual loci
Diameter 0.40 0.75
-
-
0.15 0.04Height 0.47 0.59 0.63 0.29 0.29 0.49
Pollen weight 0.51 0.47 0.61 0.33 0.24 0.70
Pollen shedding 0.67 0.12 -
-
- -Cone production 0.47 0.58 0.58 0.40 0.22 0.81
Seed weight 0.72 0.08 -
-
-
-Fitness 0.38 0.82 0.56 0.47 0.33 0.36
For the Yll&tunturi population, age of the tree was used “
-
as a covariate in the multiple regression analysis. Negative value.is no genetic variance, then the power is that of a sample that is equal to the number of genotypes times the number of replicates examined per genotype. In the data here, the broad-sense heritability estimates, defined as between genotype variation over total phe- notypic variation, average 0.485 for the six traits at Viitaselka and 0.276 for the three traits at Vilhelmin- makii so that the power appears to be in between these two extremes. An additional factor determining the power is the relative size of the variances to the mean of the trait (see below)
.
To illustrate the power to detect a difference between heterozygotes and homozygotes of 0.05 and 0.1, we calculated the power for a locus which had 10 hetero- zygotes and 15 homozygotes and five replicates per genotype (as an example for Viitaselka) and nine het- erozygotes and 14 homozygotes and six replicates per genotype (as an example for Vilhelminmakii)
.
There were four loci in each of the populations that had this level of polymorphism or greater (equal to or more heterozygotes than this).As can be seen in Table 4, the power of the tests is greatly dependent on the trait. For diameter and height, the power to determine a selective difference of 0.05 in the seed orchards is substantial (average of 0.564) and a difference of 0.1 is quite high (average of 0.953). We should note that in many of the published reports, it is size or growth rate that is being measured (see DISCUSSION below). Our trees were of even age
in the seed orchards (age was used as a covariate in Yllastunturi)
.
In other words, our measures of height and diameter are the data that are most comparable with other studies and they both have good power. For seed weight in Viitaselka, the power was fairly good for a selective difference of 0.1. On the other hand, for pollen weight and cone production, the power was quite low. This resulted because for these traits, the standard deviation is of the same relative size as the mean, making the detection of a 5 or 10% difference between the heterozygotes and homozygotes very un- likely. The overall power to detect a 10% heterozygous advantage ranged in the seed orchards from 0.062 to 1.0 with a mean value of 0.521.762 0. Savolainen and P. Hedrick
Viitaselka Vilhelminmaki Yllastunturi
s
v 1000
.CI 600
e
p. e 100
200 e e 100
- 0
a"
0 1 2 3 4 5 6 7 0 1 2 3 4 5 06 17 2 3 4 5 6 70 1 2 3 4 5 06 17 2 3 4 5 06 17 2 3 4 5 6 7
e e
e e
10 e e
7.5
5.0
e
6 e
0 1 2 3 4 5 60 71 2 3 4 5 60 71 2 3 4 5 6 7
Number of hetemzygoua loci
FIGURE 2.-The phenotypic values of three quantitative traits, height, cone production and pollen production, for clonal means (Viitaselka and Vilhelminmaki) or individuals (Yllastunturi) with different numbers of heterozygous loci.
replicate measurements was marginal with the sample tively small. The overall power to detect an average size either N
>
30 or N>
40 for all cases. heterozygous advantage of 5% ranged from 0.056 to Table 5 gives the power for the multiple locus data. 1.0 for several trait-population combinations with a Again the power is generally highest for diameter and mean of 0.473.height, the traits often used in other studies, suggesting that we would have found a significant effect if it had
indeed been present. For some of the other traits with In this study of Scots pine, a number of factors (see high variance-to-mean ratio, again the power was rela- Introduction) should have enabled us to document an
DISCUSSION
TABLE 4
The power to reject the null hypothesis that there is no difference between heterozygotes and homozygotes
Trait
Diameter Height Pollen weight Pollen shedding Cone production Seed weight Mean
Viitaselka Vilhelminmaki
s = 0.05 s = 0.1
0.569 0.976
0.727 0.999
0.079 0.155
0.928 1.000
0.090 0.115
0.171 0.395
0.427 0.607
s = 0.05 s = 0.1
-
-
0.397 0.885
0.060 0.062
0.069 0.102
-
-
0.175 0.350
Yllastunturi
s = 0.05 s = 0.1
0.210 0.329
0.210 0.497
0.062 0.073
0.082 0.103
0.128 0.250
- -
763 Heterozygosity and Fitness
TABLE 5
The power to reject the null hypothesis that there is not a significant regression at the 5% level in a multilocus genotype
Population
Viitaselka Vilhelminmaki Yll&tunturi
Trait s = 0.02 s = 0.05 s = 0.02 s = 0.05 s = 0.02 s = 0.05
Diameter 0.554 0.998
-
- 0.103 0.385Height 0.747 1
.ooo
0.283 0.965 0.134 0.639Pollen weight 0.068 0.154 0.057 0.056 0.060 0.081
Pollen shedding 0.943 1
.ooo
-
--
-
Cone production 0.047 0.112 0.062 0.071 0.061 0.089
Seed weight 0.123 0.594
-
--
-
Mean 0.414 0.643 0.134 0.364 0.090 0.299
association of allozyme heterozygosity and quantitative traits related to fitness due to intrinsic heterozygote advantage if it had been present. Examining our data using both ANOVA and regression analysis, we found for 312 tests that 8.0% were significant at the 5% level, indicating that there is little obvious effect of allozyme heterozygosity on fitness components in our popula- tions. In fact, in half of these significant cases, the ho- mozygotes were worse than the heterozygotes. Further, using the scaling suggested by SMOUSE (1986) in his adaptive distance approach, we found similar results. Overall,
7%
of the adaptive distance regressions were significant at the 5% level and approximately half of these had positive values and half had negative values. Even for a composite measure of fitness that combined the six quantitative traits related to fitness, we foundno significant associations out of 72 tests for the three populations tested by both ANOVA and regression anal- ysis. Finally, a multiple regression analysis using all 12 polymorphic loci in an individual heterozygosity mea- sure, explained only a small proportion ( <6%) of the variation observed in the six different traits and less than one-third of this variance was due to positive associ- ations of heterozygosity with the quantitative traits.
We carried out an analysis to determine the power we had to detect a difference between heterozygotes and homozygotes and the regression of multiple locus heterozygosity on the various traits in our samples. To
our knowledge, this is first time that a power analysis has been carried out on such a data set and it gives insight into where we might have detected heterozygote advantage. For several traits often used in similar stud- ies, diameter and height, the power to detect a single- locus difference of 5 or 10% or a multiple locus effect averaging 2 or 5%, given that it was present, was very high. In carrying out this analysis, it was obvious that the power was quite dependent on the level of the envi- ronmental variance for a given trait when there were replicate measurements of genotypes. In addition, it was obvious that the power was very dependent on the relative size of the phenotypic variance and the mean of a given trait. We recommend that any further studies
of the association of heterozygosity and fitness include an analysis to determine the power to detect given selec- tive differences.
A number of previous studies have searched for a relationship between individual heterozygosity and traits related to fitness in trees. We do not know how many studies have found no such association and have not reported their results but any such reporting bias would overestimate the ubiquity of the phenomenon
(for a discussion of an analogous bias for selection stud- ies, see ENDLER 1986). In addition, a majority of the positive reports in trees have been made by a relative few researchers and their colleagues, suggesting that there may be some bias from these researchers in re- porting only results that show a positive association be- tween heterozygosity and a trait related to fitness. Fi- nally, in our opinion, the support for a positive association due to intrinsic heterozygote advantage is not very strong even in the studies reporting a positive relationship if they are critically evaluated (see below)
.
The initial studies in trees dealt mostly with growth rate in natural populations. For example, MITTON and GRANT ( 1980) reported a positive relationship between individual heterozygosity and growth rate among 100 clones in Populus tremuloida from the Rocky mountains. However, this study included only three polymorphic loci and because of the high degree of asexual repro- duction in the species, correlation with other loci is very likely. The number of heterozygous loci was not related to mean growth rate in P. contorta and in P. ponderosa, “predominately heterozygous” individuals grew more slowly than “predominately homozygous” individuals ( KNOWLES and MITTON 1980).
In natural population of ponderosa pine, LINHART and MITTON( 1985) did not find any relationship between heterozy- gosity and mean growth or with mean female or male reproduction.
764 0. Savolainen and P. Hedrick
ysis of the same data led BUSH et al. (1987) to conclude that specific loci were responsible for the observed asso- ciation. Recently, EGUIARTE et al. (1992) reported a positive relationship between heterozygosity and growth
(but not fecundity) in a tropical palm, Astrocaryum mexi- canum. In this study, the mean fixation index at the seed level was -0.2 and at the adult stage was -0.4, suggesting that further study is called for to understand the basis of these findings.
Some later studies have included experimental stands. STMUSS and LIBBY (1987) studied clonal repli- cates of about l0-yr-old P. radiata seedlings, and con- cluded that overdominance was a very unlikely explana- tion for an association of allozyme heterozygosity and quantitative traits. STMUSS (1986) also studied a more controlled situation, where he included selfs and crosses between different trees of P. attenuata. Out- crosses did not show consistent relationships, but among the inbreds, heterozygosity was positively corre- lated with trunk growth and cone production. A study of family mean heterozygosity versus growth rates pro- vided no evidence for heterozygote superiority for growth in Pseudotsuga menziesii (BONGARTEN et al. 1985). BUSH and SMOUSE (1991 ) studied selfs and crosses in P. taeda and found little evidence for over- dominance.
There have also been a large number of studies exam- ining the association of individual heterozygosity and quantitative traits, particularly growth rate, in mollusks (see ZOUROS and FOLTZ 1987). However, in many of the studies that do show a positive relationship between heterozygosity and a quantitative trait, there also ap- pears to be a deficiency of heterozygotes in the early age classes (e.g., GAFFNEY et al., 1990). This suggests that there may be population structure or some other factor influencing genotypic frequencies and also caus- ing an association between the allozyme loci and loci affecting the trait being examined [see the exchange of letters by KOEHN ( 1990) and ZouROs ( 1990)
1 .
In a sophisticated extension to the previous ap- proaches, POGSON and ZOUROS (1994) detected some positive association between multiple locus heterozy- gotes and height in scallops for allozyme loci but not for other loci identified by DNA markers in the same population. However, only one allozyme locus had a significant positive effect and regression analysis ex- plained only 3% of the variance for the allozyme data.
As they state, “the differences observed between the effects of allozyme and RFLP heterozygosity on growth rate provide evidence against the associative overdomi- nance hypothesis, but a strong case against this explana- tion must await corroboration from similar studies in different species.”
SMOUSE (1986) proposed a technique, called the adaptive distance model, to analyze heterozygosity and quantitative trait data. As we have shown above, it does not appear that the adaptive distance model finds more
association between allozyme genotypes and quantita- tive traits in our data set than does ANOVA or the regression model using the number of copies of the most frequent allele. SMOUSE (1986) also suggested that the adaptive distance model could be used to dis- tinguish between effects due to heterozygote advantage and those due to dominance. These conclusions were based on the assumption that the rarer of two homozy- gotes for a biallelic locus with heterozygote advantage would have a lower fitness and that the population is panmictic and at equilibrium. It has been shown, how- ever, in the absence of panmixia, that the rarer homozy- gote for a neutral locus (at which alleles are associated with alleles at dominant loci) will also have a lower fitness (OHTA 1971; OHTA and COCKERHAM 1974; CHARLESWORTH 1991). HOULE (1994) has recently shown that when the association is the result of inbreed- ing or finite population size the adaptive distance model cannot distinguish between heterozygote advan- tage and associative overdominance caused by domi- nant loci.
In a large and comprehensive laboratory study in Drosophila melanogaster, HOULE ( 1989) looked for associ- ations of allozyme heterozygosity and size, develop- mental rate, and fluctuating asymmetry for size. As is the case for Scots pine,
D.
melanogaster is unlikely to exhibit either extensive linkage disequilibrium or geno- typic associations because of its large population size and lack of any type of inbreeding. In other words, any observed associations would likely be the result of intrinsic heterozygote advantage. Overall, HOULE found no significant correlation of heterozygosity at eight different loci for four different traits in two differ- ent experiments. Based on these results and a review of the literature, he concluded that “Until there is evi- dence that allozyme heterosis occurs in large, panmic- tic, natural populations, the hypothesis of functional overdominance must be regarded with considerable skepticism.”Heterozygosity and Fitness 765
cases but it would be difficult to support it over tradi- tional techniques in tree breeding (e.g., ZOBEL and
TALBERT 1984) or conservation genetics (e.g., HEDRICK
and MILLER 1992).
We especially thank P. SMOUSE for his detailed commentary and opinion on the manuscript, D. CHARLESWORTH for her insightful comments and encouragement, R. BUSH, D. HOULE, R. KOEHN, S. STRAUSS, and E. ZOUROS for their helpful comments, and an anony- mous reviewer for urging us to carry out power analysis. KATRI KjiRK- KAINEN helped in collecting some of the field data. This research was
financially supported by the Finnish Research Council for Agriculture and Forestry ( O S and P.W.H.) , the Cultural Foundation of North- ern Ostrobothnia ( O S . ) , and the National Science Foundation
(P.W.H.) .
LITERATURE CITED
ALLENDORF, F. W., and R. F. LEARY, 1986 Heterozygosity and fitness in natural populations of animals, pp. 57-76 in Consmation Biol-
ogy: The Science of Scarcity and Diversity, edited by M. SOULE. Si-
nauer, Sunderland, MA.
ALLISON, A. C., 1964 Polymorphism and natural selection in human populations. Cold Spring Harbor Symp. @ant. Biol. 2 4 137-149. BENNET, J. H., and F. E. BINET, 1956 Association between Mendelian
factors with mixed selfing and random mating. Heredity 10: 51-55. BISHOP, J. A., 1981 A neodarwinian approach to resistance: exam- ples from mammals, pp. 27-51 in Genetic Consequences of M a n Made Change, edited by J. A. BISHOP and L. M. COOK. Academic Press, New York.
BONGARTEN, B. C., N. C. WHEELER and K S. JECH, 1985 Isozyme heterozygosity as a selection criterion for yield improvement in Douglas fir, pp. 121-127 in Proc. 20th Meeting of the Canadian Tree Improvement Association: New Ways in Forest Genetics, edited by F. CARON, A. G. CORR~VEAU and T. J. B. BOYLE. Canadian Forestly Service, Ottawa, Canada.
BROWN, A. H. D., 1970 The estimation of Wright's fixation index from genotypic frequencies. Genetica 41: 388-406.
BUSH, R. M., and P. E. SMOUSE, 1991 The impact of electrophoretic genotype on life history traits in Pinw taeda. Evolution 45: 481-498. BUSH, R. M., and P. E. SMOUSE, 1992 Evidence for the adaptive
significance of allozymes in forest trees. New For. 6 179-196. BUSH, R. M., P. E. SMOUSE, and F. T. LEDIG, 1987 The fitness conse-
quences of multiple-locus heterozygosity: the relationship be- tween heterozygosity and growth rate in pitch pine (Pinus rigzda
Mill.). Evolution 41: 787-798.
CHARLESWORTH, D., 1991 The apparent selection on neutral marker loci in partially inbreeding populations. Genet. Res. 57: 159-175. EGUIARTE, L. E., N. PEREZ-NASSER, and D. PINERO, 1992 Genetic structure, outcrossing rate and heterosis in Astrocaryum mexi- canum (tropical palm) : implications for evolution and conserva- tion. Heredity 69: 217-228.
ENDI.ER, J. A,, 1986 Natural Selection i n the Wild. Princeton Univ. Press, Princeton, NJ.
FRYDENBERG, O., 1963 Population studies of a lethal mutant in Dre
sophila mdanogaster. I. Behavior in populations with discrete gen- erations. Hereditas 50: 89- 116.
GAFFNEY, P. M., T. M. SCOTT, R. K. KOEHN, and W. J. DIEHL, 1990 Interrelationships of heterozygosity, growth rate and heterozy- gote deficiencies in the coot clam, Mulinia lateralis. Genetics 124: 687-699.
GURIES, R. P., and F. T. LEDIG, 1982 Genetic diversity and popula-
387-402.
tion structure in pitch pine (Pinus rigzda Mill.). Evolution 36: HALDANL, J. B. S., 1949 The association of characters as a result of
inbreeding and linkage. Ann. Eugenics 1 5 15-23.
HEDRICK, P. W., 1985 Genetics ofPopulations. Jones and Bartlett, Bos- ton, MA.
HEDRICK, P. W., 1986 Genetic polymorphism in heterogeneous envi- ronments: a decade later. Annu. Rev. Syst. Ecol. 17: 535-566. HEDRICK, P. W., 1990 Mating systems and evolutionary genetics, pp.
83- 114 in Population Biology: Ecological and Euolutionaly V i q o i n t s ,
edited by K. WOHRMANN and S. JAIN. Springer-Verlag, New York.
HEDRICK, P. W., and P. S. MILI.ER, 1992 Conservation genetics: tech- niques and fundamentals. Ecol. Appl. 2: 30-46.
HEDRICK, P. W., E. EWING, and M. GINEVAN, 1976 Genetic polymor- phism in heterogeneous environments. Annu. Rev. Syst. Ecol. 7:
HEDRICK, P. W., S. K. JAIN and L. HOLDEN, 1978 Multilocus systems
HOULE, D., 1989 Allozyme-associated heterosis in Drosophila melane
HOULE, D., 1994 Adaptive distance and the genetic basis of hetero-
~ V E S S A L O , Y., 1965 MetsAnaRuiointi. WSOY, Helsinki (in Finnish). KIMURA, M., 1983 The Neutral T h e q of Molecular Evolution. Cam-
bridge Univ. Press, Cambridge.
KNOWLES, P., and J. MITTON, 1980 Genetic heterozygosity and radial growth variability in P i n w contorts. Silvae Genet. 29: 114-1 17. KOEHN, R. K., 1990 Heterozygosity and growth in marine bivalves:
comments on the paper by Zouros, Romero-Dorey, and Mallet (1988). Evolution 44: 213-216.
KOEHN, R. K., W. J. DIEHI., and T. M. SCOTT, 1988 The differential contribution by individual enzymes of glycolysis and protein ca- tabolism to the relationship between heterozygosity and growth rate in the coot clam Mulina lateralis. Genetics 118: 121-130. KOSKI, V., 1970 A study of pollen dispersal as a mechanism of gene
flow. Commun. Inst. For. Fenn. 70.4 1-78.
LANDE, R., and S. J. ARNOLD, 1983 The measurement of selection
on correlated characters. Evolution 37: 1210-1226.
LEDIG, F. T., 1986 Heterozygosity, heterosis, and fitness in outbreeding plants, pp. 77-104 in C m m a t w n Biology: The Science of Scarcity and Diversity, edited by M. SOUIX. Sinauer Assoc., Sunderland, MA.
LEDIG, F. T., R. P. GURIES, and B. A. BONEFIELD, 1983 The relation of growth to heterozygosity in pitch pine. Evolution 37: 1227-
1238.
LEWONTIN, R. C., 1991 Twenty-five years ago in GENETICS. Electro- phoresis in the development of evolutionary genetics: milestone
or millstone. Genetics 1 2 8 657-662.
LINHART, Y., and J. MITTON, 1985 Relationships among reproduc- tion, growth rates, and protein heterozygosity in ponderosa pine.
MITTON, J. B., and M. C. GRANT, 1980 Observations on the ecology and evolution of quaking aspen, Populw tremuloides in the Colo- rado Front Range. Am. J. Bot. 67: 202-209.
MITTON, J. B., and M. C. GRANT, 1984 Associations among protein heterozygosity, growth rate, and developmental homeostasis. Annu. Rev. Ecol. Syst. 15: 479-499.
MUONA, O., 1990 Population genetics in forest tree improvement, pp. 282-298 in Plant Population Genetics, Breeding, and Genetic Resources, edited by A. BROWN, M. CLEGG, A. KAHLER, and B. WEIR. Sinauer Assoc., Sunderland, MA.
MUONA, O., and A. HARJU, 1989 Effective population sizes, genetic variability, and mating system in natural stands and seed orchards of Pinus syluestris. Silvae Genet. 38: 221-228.
MUONA, O., and A. E. SZMIDI', 1985 A multilocus study of natural populations of Pinus syluestris, pp. 226-240 in Population Genetics in Forestry, Lecture Notes in Biomathmatics 60, edited by H. R. GRE- GORIUS. Springer-Verlag, Berlin.
MUONA, O., A. HARJU, and K. KARKKAJNEN, 1988 Genetic compari- son of natural and nursery grown seedlings of Pinus syluestris
using allozymes. Scand. J. For. Res. 3: 37-46.
NEI, M., 1987 Molecular Euolutionaly Genetics. Columbia Univ. Press, New York.
OHTA, T., 1971 Associative overdominance caused by linked detri- mental mutations. Genet. Res. 18: 277-286.
OHTA, T., and C. C. COCKERHAM, 1974 Detrimental genes with partial selfing and effect on a neutral locus. Genet. Res. 23: 191-200.
POGSON, G. H., and E. ZOUROS, 1994 Allozyme and RFLP heterozy- gosities as correlates of growth rate in the scallop Placopecten
Genetics 137: 221-231.
magellanicusr a test of the associative overdominance hypothesis.
RAILS, K, and J. BALLOU, 1986 Proceedings of the Workshop on Genetic Management of' Captive Populations. Zoo Biol. 5: 81- 240.
RICE, W. R., 1989 Analyzing tables of statistical tests. Evolution 43:
SARV.6, R., 1962 Investigations of the flowering and seed crop of 1-32.
in evolution. Evol. Biol. 11: 104-184.
gaster. Genetics 123: 789-801.
sis. Evolution 1410-1417.
Am. J. Bot. 72: 181-184.
223-225.
766 0. Savolainen and P. Hedrick
SAS, 1987 SAS/STAT Guide for personal computers, Version 6.1
Edition. Gary: NC: SAS Institute Inc.
SAVOIAINEN, O., and K. KARKKAINEN, 1992 Effect of forest manage- ment on gene pools. New For. 6: 329-345.
SAVOWNEN, O., K. KARKKAINEN, A. HAPJU, T. NIKKANEN, and M. RUSANEN, 1993 Fertility variation in Pinus sylvestris: a test of the sexual allocation theory. A m . J. Bot. 8 0 1016-1020.
SMOUSE, P. E., 1986 The fitness consequences of multiple-locus het- erozygosity under the multiplicative overdominance and in- breeding depression models. Evolution 40: 946-957.
SOW, R. R., and F. J. ROHLF, 1981 Biometly Ed. 2, W. H. Freeman, San Francisco.
STRAUSS, S. H., 1986 Heterosis at allozyme loci under inbreeding and crossbreeding in Pinus attenuatu. Genetics 113: 115-134. STRAUSS, S. H., and W. J. LIBBY, 1987 Allozyme heterosis in radiata pine
is poorly explained by overdominance. Am. Nat 130: 879-890. TumI.l.1, M., and L. V. GINSBURG, 1983 Should individual fitness
increase with heterozygosity? Genetics 104 191-209.
WATT, W. B., 1992 Eggs, enzymes, evolution: natural genetic variants change insect fecundity. Proc. Nat. Acad. Sci. USA 8 9 10608-
10612.
WEIR, B. S., and C. C. COCKERHAM, 1973 Mixed selfing and random mating at two loci. Genet. Res. 21: 247-262.
YAZDANI, R., 0. MUONA, D. RUDIN, and A. E. SZMIDT, 1985 Genetic structure of a Pinus syluestris L. seed tree stands and naturally regenerated understory. For. Sci. 31: 430-436.
ZOBEL, B., and J. TALBERT, 1984 AppliedForest TreeZmpl-wuaent. John Wiley, New York.
ZOUROS, E., 1990 Heterozygosity and growth in marine bivalves: response to Koehn’s remarks. Evolution 44: 216-218.
ZOUROS, E., 1993 Associative overdominance: evaluating the effects
of inbreeding and linkage disequilibrium. Genetica 89: 35-46. ZOUROS, E., and D. W. FOLTZ, 1987 The use of allelic isozyme varia-
tion for the study of heterosis. Isozymes 1 5 1-59.