Copyright 0 1991 by the Genetics Society of America
Length and Sequence Variation
in Evening Bat D-Loop
mtDNA
Gerald
S.
Wilkinson and Alyson
M.
Chapman
Department of Zoology, University of Maryland, College Park, Maryland 20742 Manuscript received November 12, 1990
Accepted for publication March 2 1, 199 1
ABSTRACT
Length variation in D-loop mitochondrial DNA was observed after amplification with the polym- erase chain reaction (PCR) in 28% of 195 evening bats, Nycticeius humeralis, from seven colonies. Nucleotide sequences of PCR products show that this heteroplasmy is characterized by an 81-bp region which is tandemly repeated five to eight times. Southern blots using PCR products as probes on HaeIII genomic digests confirm the presence of heteroplasmy. Furthermore, densitometry of electrophoresed PCR products from 109 mother-offspring pairs indicate that heteroplasmy is stably transmitted from mother to offspring with one exception: a heteroplasmic offspring had a homo- plasmic mother and sib. Nucleotide sequences from this family reveal that a repeat duplication and deletion occurred. The observed mutation rate per generation, p, for length polymorphism is comparable to an independent estimate, p = 1 O-', based on hierarchical diversity statistics. With the exception of the repeat nearest the proline tRNA gene, sequence similarities between repeats within bats are consistent with a model of concerted evolution due to unidirectional replication slippage. Selection is inferred to act on the first repeat because in comparison to other repeats it has the least sequence divergence among bats, the fewest transversions, and the lowest minimum free energy associated with folding.
M
ITOCHONDRIAL DNA of most animalsranges in size from 16 to 18 kb and contains 13 protein genes, 22 transfer RNAs, 2 ribosomal RNAs, and a regulatory region known as the control region in invertebrates or the displacement loop (D- loop) in vertebrates. T h e D-loop lies between the phenylalanine tRNA (tRNAPhe) and the proline tRNA (tRNAP'") and is so named because the two parent strands are displaced by a short, variable length rep-
lication product known as
7s
mtDNA (CLAYTON1982). T h e presence of this single-stranded compo- nent enables this region of the mtDNA molecule to
bind hydrophobic regulatory proteins (ALBRING,
GRIFFITH and ATTARDI 1977) and to undergo dupli- cation and deletion events when repeats are present (BUROKER et a l . 1990). Comparison of rat, mouse, human, cow and Xenopus laevis D-loop sequences re- veal that most of the D-loop is A
+
T rich with the exception of a central G+
C rich region containing an open reading frame that shows substantial similar- ity across species at the level of amino acid function (SACCONE, ATTIMONELLI and SBISA 1987).Substantial length variation has recently been found in or near the control region or D-loop of many animal mtDNAs. For example, three species of bark weevils possess mitochondria ranging in size from 30 to 36 kb (BOYCE, ZWICK and AQUADRO 1989) because an 0.8-2.0-kb sequence is tandemly repeated adjacent to the control region. All individuals sampled had more than one mtDNA form, i.e. were heteroplasmic. Het-
Genetics 128: 607-617 (July, 1991)
eroplasmy has also been attributed to variable copy number of tandem repeats in the control region of sea scallop (LA ROCHE et al. 1990), Drosophila mauri-
tiana (SOLIGNAC, MONNEROT and MOUNOLOU 1986),
and field crickets (RAND and HARRISON 1989), and in the D-loop of shad (BENTZEN, LEGGETT and BROWN 1988), sturgeon (BUROKER et al. 1990), whiptail lizards (MORITZ and BROWN 1987), and rabbit (MIGNOTTE et al. 1990). In humans, heteroplasmy is rare but has been detected in association with several disorders as an 8-kb duplication encompassing the D-loop (POUL- TON, DEADMAN and GARDINER 1989) and as a series of multiple deletions within the D-loop (ZEVIANI et al.
1989). Length variation between humans, in contrast,
is well-known for D-loop mtDNA (CANN and WILSON
1983; GREENBERG, NEUBOLD and SUGINO 1983). T h e apparent scarcity of heteroplasmy among mammals has prompted some investigators (e.g. RAND and HAR- RISON 1989) to speculate that homeotherms, due to their higher metabolic rates, may experience stronger selection for smaller and less variable mtDNAs than poikilotherms.
In addition to length variation, substantial nucleo- tide sequence variability in the D-loop has been re-
corded both within (AQUADRO and GREENBERC 1983)
and between species (FORAN, HIXSON and BROWN
replication of the heavy (H) strand is primed by D- loop light (L) strand RNA (CHANG and CLAYTON
1985), several workers (GREENBERG, NEUBOLD and SUGINO 1983; BROWN 1985; CHANG et ai. 1985; FORAN,
HIXSON
and BROWN 1989) have claimed that the species-specificity of the D-loop sequence is evi- dence for nuclear-mitochondria1 genome coevolution. This interpretation assumes that mitochondrial D- loop nucleotide sequences have been under selection for their ability to facilitate nuclear enzyme binding. An alternative, although not exclusive, hypothesis is that D-loop sequence variability between species may be the result of concerted evolution, i.e. the creationof tandemly repeated sequences through replication slippage or unequal crossing over (OHNO 1970; HILLIS
et al. 1991). Concerted evolution could generate spe- cies-specific D-loop sequences independent of func- tional differences if separate lineages accumulate sub- stitutions independently.
In this paper we use the polymerase chain reaction (PCR) to characterize length and sequence variation in the D-loop of evening bat (Nycticeius humeralis)
mitochondrial DNA. By examining PCR product sizes and sequences between known mother-pup pairs we verify that length heteroplasmy is transmitted mater- nally and is caused by a duplication or deletion of an 8 1-bp sequence that is tandemly copied five to eight times in the D-loop. By convention we use the term heteroplasmy to refer to multiple mtDNA genomes within an individual rather than within a cell. But, in contrast to prior studies in which length variation is
assessed using restriction enzyme digests of DNA ex- tracted from an organ or the entire animal, we can localize heteroplasmy to relatively few cells within an individual using PCR. By comparing nucleotide se- quence similarity between 81-bp repeats within bats to sequence similarity of corresponding repeats in different bats, we evaluate concerted evolution and nuclear-mitochondria1 coevolution as possible alter- native explanations for creating and maintaining the substantial nucleotide sequence variation observed be- tween bats both between and within nursery colonies.
MATERIALS AND METHODS
Study sites: Tissue samples were taken from adult female evening bats, a small (10 g) insectivorous Vespertilionid bat, at seven attic nursery colonies (Table I), six in northern Missouri and southern Iowa and one in North Carolina (G.
S. WILKINSON, unpublished) during the summer between 1987 and 1990. At these sites, females migrate in April from winter hibernacula and faithfully return to their natal nursery colonies in either hollow trees or attics (WATKINS
1970).
T o document transmission of length and sequence var- iants, 58 pregnant females were kept in captivity through parturition until their young were large enough to sample. In 1988 we kept ten bats and in 1989 nine bats from the Hutton colony and in 1989 we also kept nine bats from the
608 G. S . Wilkinson and A. M. Chapman
Grim colony. In 1990 we kept 30 females captured in an attic in Edenton, North Carolina. All bats were released near the site of capture before the young were old enough to feed independently.
Sample collection and preparation: Bats were captured with hoop or mist nets as they departed from attics at dusk. After banding and measuring, each adult bat's chest fur was clipped, a 3-mm excision was made, and approximately 1-3 mg of pectoral muscle was excised while applying ethylene chloride topically as a local anesthetic. Tissue samples were stored in liquid nitrogen until returned to the laboratory where they were kept at -80" until DNA was extracted.
Muscle biopsies were minced in 300 p1 of buffer (0.05 M
Tris/HCl pH 8.0, 0.1 M EDTA, 0.1 M NaCI, and 1 % SDS), incubated overnight at 55" with proteinase K (0.5 pg/ml), and then kept at 37" for 1 h with RNase (0.1 pg/ml) prior to several phenol/phenol:chloroform:isoamyl/chloro-
form:isoamyl alcohol extractions (SAMBROOK, FRITSCH and MANIATIS 1989). The resulting supernatant contained 50- 1000 ng of genomic DNA and was purified and concen- trated using Centricon-30 microconcentrators following manufacturer's instructions (Amicon Division, Danvers, Massachusetts).
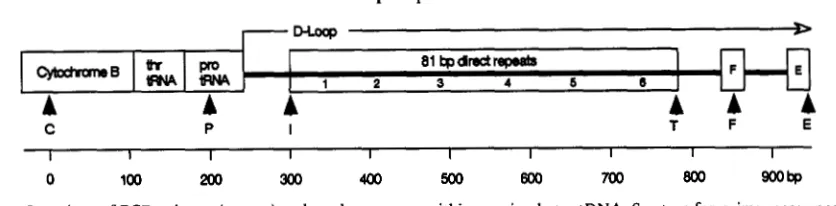
PCR primers and reactions: Three pairs of 20-bp se- quences were used as primers to amplify and sequence mtDNA (Figure 1). The location, abbreviation, sequence and orientation (L or H) of each strand is cytochrome B (C):
5'-TCCTACCATCAGCACCCAAAGC-3', initiation of the repeat array (I): L, 5"TGAAAAAACTACACA- CATGTAC-3', termination of the repeat (T): H, 5'-T- TGACTGTATGGGGTATG TAC-3', conserved se- quence block F (F): H, 5"GTTGCTGGTTTCA-
CGGAGGTAG-3', and conserved sequence block E (E): H,
5'-CCTGAAGTAGGAACCAGATG-3'. Conserved se- quence blocks (CSB) are highly homologous regions that have been found in dolphin, cow, human and mouse mtDNA (SOUTHERN, SOUTHERN and DIZON 1988). While the I and T primers are specific for evening bats, the other two pairs of primers will amplify D-loop mtDNA from at least five families of bats (G. S. WILKINSON and A. M. CHAPMAN, unpublished).
Double-stranded amplifications using the PCR were per- formed following standard protocol (Perkin-Elmer-Cetus, Norwalk, Connecticut) and included a control with no tem- plate DNA. Forty cycles of 95" for 1 min, 55" for 1.5 min and 72" for 2 min were followed by 7 min at 72". PCR product size was determined by agarose gel electrophoresis and ethidium bromide staining (see Figures 2 and 3).
T o quantify the relative amount of each PCR product, Polaroid photographs of UV illuminated gels were digitized with a video camera, 16-bit frame-grabber board, and Ma- cintosh computer and then measured using the program Image 1.24. The average inverse pixel value within an 8 by 40 pixel rectangle positioned over each band was recorded for each fragment and for an adjacent background sample. To compute relative frequencies, the background value was subtracted before normalizing each fragment value for an individual to sum to one. Only relative frequencies greater than 0.05 are recorded. This technique provided a rapid and highly repeatable measure of fragment frequency.
Southern blot analysis: To corroborate estimates of het- eroplasmy based on PCR products we digested purified genomic DNA with HaeIII. This enzyme cuts the mtDNA outside each end of the tandem repeat array. Digested DNA was electrophoresed through 1 .O% agarose, blotted to Zeta- Probe (Bio-Rad, Richmond, California) nylon and probed with a PCR product obtained using the C and F primers.
Bat D-Loop Sequence Variation 609
I-
>
81 tpdrectrepeatr
I
1 1 2 3 4 6 S ]
C P I T F E
A
A
A
A
A
A
I I I I I I I I I I
0 100 200 300 400 500 600 700 800 mbp
FIGURE 1 .-Locations of PCR primers (arrows) and tandem repeats within evening bat mtDNA. See text for primer sequences.
The probe was labeled with "P using a random primer labeling kit (United States Biochemical, Clevelend, Ohio). Prehybridization and hybridization were carried out using Denhardt's reagent as a blocking agent (SAMBROOK, FRITSCH and MANIATIS 1989). Mitochondrial DNA fragments that hybridized to the PCR probe were visualized after 3 days of exposure to x-ray film.
DNA
sequencing: Sequencing of double-stranded (ds) and single-stranded (ss) DNA was performed by the dideoxy chain termination method (SANGER, NICKLEN and C O U L ~ ~ N1977) using a Sequenase kit (United States Biochemical). Double-stranded DNA was obtained from PCR products that had been cut from an agarose gel and purified using glass beads (GENECLEAN, BIO 101 Inc., La Jolla, Califor- nia). Single-stranded DNA was created either by denaturing dsDNA or by asymmetrical PCR (GYLLENSTEN and EHRLICH
1988). Single-stranded binding protein (SSB, 0.5 rg) was added to the labeling mix to eliminate compression zones in the gel. The SSB was inactivated by incubating each termi- nation reaction at 95 O for 15 min with 0.1 Pg of proteinase
K. The sequencing reaction products were separated in an 8.0% acrylamide/urea gel for which the top buffer was 0.5 X TBE (SAMBROOK, FRITSCH and MANIATIS 1989) while the bottom buffer was 1 X TBE and 3 M sodium acetate in a
2:l ratio. These procedures allowed us to score approxi- mately 350 bp from each 50-cm lane.
Sequences were obtained starting with either the C or P primer and moving into the D-loop or using the E or T primers and sequencing toward the tRNAPro gene. These primer pairs allowed us to sequence complimentary strands through the region of overlap in the middle of the tandem repeats and provided an average of 64 bp of single-copy sequence between the C primer and the I primer that included part of the cytochrome 6 gene and the tRNAThr gene. Substantial sequence similarity between evening bat and other mammalian sequences for these genes confirmed that we were amplifying and sequencing mtDNA.
Statistics: T o apportion the variability in fragment num- ber within individuals, among individuals within colonies, and among colonies we used the diversity indices (BIRKY, MARUYAMA and FUERST 1983), Ki = 1
-
S xV2, where xV is the frequency of the jth size class in the ith level. In this study we consider three levels for i: individual, colony and region. T o maintain consistency with BIRKY MARUYAMA and FUERST (1983) and RAND and HARRISON (1989) we denote the diversity index within individuals as Kb, among individuals within colonies as K,, and among colonies within regions as Kd. T o quantify relative variation in diversity at each level we used three C statistics (RAND and HARRISON1989). The frattion of diversity found within individuals is given by CI = &/&. The fraction among individuals within colonies is CIC = (Kc
-
k)/& and the frac5on among colonies within regions is given by CCR = ( K d-
Kc)/&.To test for differences in genotype or size class frequen- cies among colonies we used a Monte Carlo randomization procedure (ROFF and BENTZEN 1989) for computing the significance associated with obtaining a contingency chi-
square value as large or larger than that observed. This technique permits inclusion of categories in which cell values are small by randomizing elements while keeping row and column totals constant.
To assess the difference between nucleotide sequences from the same repeat we calculate the expected number of substitutions per site using the Jukes-Cantor distance,
d = % In (3/(4q
-
1))where q is estimated as the fraction of homologous nucleo- tides which have the same base. We use this distance metric rather than 1
-
q because q overestimates true similarity due to multiple substitution events and because d scales linearly with time if substitution rates are equivalent at all sites (JUKES and CANTOR 1969).We apportion the similarity between sequences to differ- ent regions analogous to the diversity statistics described above by computing the average number of nucleotide substitutions either between pairs of bats from the same colony, from different colonies or from different regions. The proportion of DNA divergence attributable to each level is then found by taking the difference in average substitution rates and scaling by the substitution rate for bat pairs from the highest level, i e . in different regions (NEI
1987).
Descriptive statistics are given as mean f one standard error.
RESULTS
Repeat inheritance
and
mutation: PCR resulted inamplification products that varied in length both within and between individuals (Figures
2
and 3). Direct sequencing of each product revealed thatfrag-
ments differ in size d u e to the addition or deletion of an 81-bp sequence that is tandemly repeated five toeight times in the D-loop (Figure 1). Southern blot
analysis of Hue111 digested genomic DNA obtained
from muscle tissue and probed with PCR product confirmed the same pattern of fragments among and within individuals as obtained by PCR (Figure 2).
PCR band patterns are very similar among females and pups from the same family (Figure 3). To quantify this similarity we estimated the repeatability, R , within families of the arcsin-square root transform of the six repeat frequency obtained by densitometry. With an average of 2.9 bats measured in each of 58 families,
610 G . S. Wilkinson and A. M. Chapman
1
2
3
4
5
B
'-
1 2 3 4 5
FIGURE 2.-PCR products using the C-E primer pair (A) and Southern blots of HuellI-digested genomic DNA probed with a P-
E PCR product (B) from five bats. Lane I contains a blot from a bat that was homoplasmic for five repeats, lanes 2 and 3 contain siblings' blots that were heteroplasmic for five and six repeats, lane
4 contains a blot of a bat heteroplasmic for six and seven repeats, and lane 5 contains a blot of a bat homoplasmic for seven repeats. Outside lanes in (A) contain length standards.
1 2 3 4 5 6 7 8 9 1 0 1 1 12
1
1018 bp b
516 bp b
394 bp b
298 bp b
FIGURE 3.-PCR products from three families resulting from amplification using the P-E primer pair. Lanes 1 , 5 and 9 are length standards. Lanes 2, 6 and 10 contain samples from adult females while the two lanes following them contain samples from their two pups. Lanes 10-12 display heteroplasmy for fragments with five and six 8 1-bp repeats.
while its mother and sibling produced just one. Thus, a length mutation must have occurred in the mother. Given that we scored 109 meiotic events, the effective rate at which such mutations can be scored in each zygote by PCR is 1/109 = 0.0092 -C 0.0091. Note that this is not the mutation rate per mitochondrion because we have not assessed the number or distri- bution of mitochondrial types per gamete. Further- more, this is a lower estimate of mutation rates per zygote because PCR cannot detect simultaneous du- plication and deletion events. As shown below, these do occur.
Because each maternal repeat had a characteristic pattern of base substitutions, we were able to deter-
1 .o 38
0.8
-
0.6
-
0.4 -
0.2 -
: Y o
0.0
0.0 0.2 0.4 0.6 0.8 1.0
Maternal Frequency
FIGURE 4.-Frequency of six repeat PCR products for 109 mother-offspring pairs. The box indicates an offspring which was heteroplasmic with a homoplasmic mother. Numbers indicate r e p licate values for homoplasmic pairs. The least squares regression equation is y = 0.0029
+
0.986x, r2 = 0.98.-1
1 . 2 - 3 . 4 . 5FIGURE 5.-Diagram of the positions of identical repeat se- quences in the one family in which a homoplasmic mother had a heteroplasmic offspring. Note that repeat 3 duplicated in all off- spring arrays while repeat 4 was deleted in the 5 repeat offspring fragments.
mine how the length change in this family occurred. T h e six repeat offspring fragment is one repeat longer than the maternal fragment because repeat three has been duplicated (Figure 5). Furthermore, the five repeat fragment for the heteroplasmic pup and its homoplasmic sib share this duplication but lack ma- ternal repeat four. Thus, the five repeat fragments of both pups also show a deletion and concordant dupli- cation of internal maternal repeats while the six repeat fragment of the heteroplasmic pup is due just to a duplication.
Over 500 bp of nucleotide sequence for five other families, i.e. all repeats for a mother and her two pups, were also obtained. In all mother-offspring compari- sons, including a five repeat family and a seven repeat family, both pup sequences were identical to the ma- ternal sequence.
Occurrence of heteroplasmy: Of the 195 adult bats
Bat D-Loop Sequence Variation 61 1
TABLE 1
Frequency of mtDNA size classes and heteroplasmy, and diversity indices among sites
Site (n)
Total (1 95) Missouri (1 66)
Busby ( 1 7) Grim (1 4) Easton (37) Smith (23) Zion (48) Hutton (27) North Carolina (29)
~~ P(5) 0.313 0.279 0.218 0.268 0.264 0.133 0.205 0.601 0.509 P(6) 0.643 0.677 0.7 14 0.696 0.693 0.705 0.790 0.397 0.446 P(7) 0.040 0.039 0.068 0.036 0.044 0.130 0.005 0.002 0.045 P(8) 0.004 0.004 0.000 0.000 0.000 0.03 1 0.000 0.000 0.000
P ( H )
0.277 0.295 0.294 0.357 0.324 0.304 0.292 0.222 0.172
a
0.125 0.133 0.126 0.186 0.139 0.135 0.135 0.094 0.080 K c 0.487 0.462 0.439 0.443 0.449 0.467 0.333 0.481 0.540 ArcsinG(6)1.005 f 0.046 1.059 k 0.048 1.103 k 0.148 1.064 f 0.149 1.08 1 f 0.098 1.114 f 0.132 1.243 k 0.071 0.627 f 0.134 0.692 f 0.134 Site indicates the location where the sample was obtained, i.e. either state or cdony. n = sample size, p(5) = frequency of the size class containing 5 tandem repeats, p ( H ) = frequency of heteroplasmic individuals, K b = mean diversity index over all individuals at that
site, K c = diversity index for that site, and arcsinG(6) = mean arcsinG(6) over all individuals. TABLE 2
Frequencies of mtDNA genotypes at each site
Site (n) f ( 5 ) f(6) f ( 7 ) f(56) f ( 6 7 ) f ( 5 6 7 ) f ( 7 8 )
Total ( 1 95) 40 97 3 38 12 3 2
Missouri ( 1 66) 27 87 2 34 1 1 3 2
Busby ( 1 7) 3 9 0 1 3 1 0
Grim (1 4) 2 6 0 4 2 0 0
Hutton (27) 1 3 8 0 5 0 1 0
Easton (37) 5 1 9 1 9 3 0 0
Smith (23) 1 1 4 1 3 2 0 2
Zion (48) 3 3 1 0 12 1 1 0
North Carolina (29) 13 10 1 4 1 0 0 Site indicates the location where the sample was obtained, i e .
either state or colony. n = sample sizef(56) = number of individuals which are heteroplasmic for 5 and 6 tandem repeats,f(5) number o f individuals which are homoplasmic for 5 repeats.
not sufficient to cause heteroplasmy frequency to vary significantly among colony sites
(x'
= 1.77, d.f. = 6,P = 0.939).
These results are consistent both with an analysis of variance on
Kb
and with the hierarchical C statistics. The within individual diversity, Kb, does not differ significantly among colonies (F6,188 = 0.596,P
=0.733). In terms of relative diversity, the variation
among colonies, CCR = 7.2%, is much less than either the diversity among individuals within colonies, CIc =
66.8% or the diversity within individuals,
CI
= 25.6%.Population subdivision: In contrast to the lack of
variation in the proportion of heteroplasmic individ- uals within each colony, significant variation does occur among colonies in genotype frequencies
(x'
=70.431, P
<
0.001, 1000 randomizations, Table 2)and in the arcsin-square root transform of the fre- quency of six repeats (F6,188 = 4.523, P = 0.0003,
Table 1). Note that the genotype frequencies only score the presence or absence of a size class while the frequency of six repeats is calculated from the individ- ual frequencies obtained from densitometric measure- ments. Application of Fisher's partial least squares differences (PLSD) posthoc comparison to the arcsin-
square root transformed frequencies indicates that this variation is caused by two colonies, Hutton and the North Carolina colony, which have lower frequen- cies of six and higher frequencies of five repeats than the remaining Missouri colonies (Table 1). Similar results are obtained for genotype frequencies upon posthoc comparison (Table 2). The genotype frequen- cies at the Hutton and Edenton colonies are inde- pendent of colony (?? = 3.266, P = 0.91,500 random- izations) as are those at the five other Missouri colonies
(X2
= 29.256, P = 0.17, 500 randomizations). Thus,although differences in both genotype and repeat frequency can be demonstrated between colonies, they do not increase with geographic distance.
Sequence similarity among sites: To determine if
there were more nucleotide substitutions between bats from different colonies or different regions than within colonies we computed the Jukes-Cantor dis- tance between all possible pairs of the 52 unrelated bats for which sequence data was obtained for six repeats. This gave 549 pairs of bats from the same colony, 630 pairs from two different colonies in the same region, and 147 pairs from different regions- one from a Missouri colony and the other from the North Carolina colony. We tested for differences be- tween these three sets of pairs by taking 1000 samples of 549 pairs of distances at random without regard to the identity of the bats, ordering the means, and then counting the number of sampled means less than the observed mean obtained from bats, in this case, from the same colony. Identical randomization tests were conducted with 630 pairs and 147 pairs to determine
if two bats from different colonies in the same state or two different states, respectively, have more or fewer nucleotide substitutions than expected by chance.
612 G.'S. Wilkinson and A. M. Chapman
5
0.022
0.01 b.I-.
C
td
Y a, -J 2
n nn _."
1 2 3 4 5 6
Repeat Position
FIGURE 6.-Jukes-Cantor distances between pairs of bats in the same colony, in different colonies in Missouri, or between bats from Missouri and North Carolina colonies. The distances for pairs within ;I colony include sequences for 33 bats at the Zion colony, four bats from the Hutton colony, and three bats at each of the other five colonies. Sequences were obtained either from bats homoplasmic for six repeats or from the six repeat fragment of a heteroplasmic bat. Asterisks indicate those sets of paired distances that were significantly different from the overall mean distance according to r.;lndomi;lation tests as described in the text. Repeat position 1 is closest to the tRNA"'" gene.
cleotides at the beginning of the D-loop. Most individ- uals had seven adenosine residues at this position, but both six and eight were recorded. However, random- ization tests indicated that no significant differences exist between any of the three sets of pairs and the overall mean. T h e overall average Jukes-Cantor dis- tance between bat pairs was 0.0044 f 0.0003. In contrast, if the sequence data from all six repeats is pooled, a significant difference is obtained for pairs of bats within colonies versus pairs between colonies o r between regions ( P C 0.001). T h e average Jukes- Cantor distance within the repeat region is 0.0143 f
0.0002 indicating greater sequence divergence be-
tween bats within the repeat region than outside the repeats. To determine if any nucleotide sequence heterogeneity exists among the six repeats, we analyze each repeat separately below.
Although heterogeneity exists among the mean dis- tances for all repeats depending on whether the pairs were from the same or different colonies, the most instructive difference between these groups occurs in repeat one, that repeat closest to the tRNA"'" gene (Figure 6). This repeat is the most conserved repeat in that it shows significantly less divergence between pairs of bats than any of the other repeats. In com- parison to the within repeat nucleotide substitution rate between regions, 25.5% of the genetic differen- tiation observed at repeat one is due to variation within colonies, 30.9% is due to variation between colonies, and 43.6% is due to sequence variation be- tween regions. In contrast, repeat six shows much greater divergence between bats, although bats within the same colony do not have consistently more similar sequences at repeat six than bats from different colo-
0.1 5
0.1 0
0.05
0.00
0
0
3
yj
4
No.
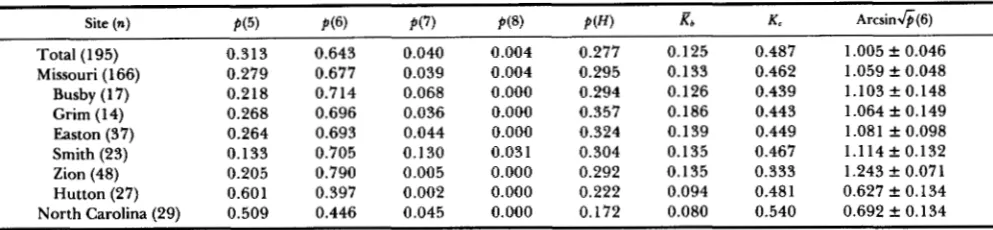
Intervening RepeatsFIGURE 7.-Jukes-Cantor distances between the sequences of two 81-bp repeats within each of 52 bats. The number of repeats separating the two repeats is indicated on the abscissa. Sequences were obtained either from bats homoplasmic for six repeats or from the six repeat fragment of a heteroplasmic bat. Error bar indicates one standard error obtained by bootstrapping.
nies (Figure 6). Internal repeats show distances be- tween individuals which are intermediate to those for repeats one and six, and also fail to show consistently greater divergence between bats from different colo- nies.
Sequence similarity among repeats within bats: If either unequal crossing over or replication slippage causes heteroplasmy, then the greatest sequence sim- ilarity should occur between those repeats that most frequently undergo duplication events (OHTA 1980).
Under this premise, duplication almost certainly is restricted to neighboring repeats because of the 52 bats sequenced, adjacent repeats are most similar and the distances between repeat sequences diverge at an exponentially increasing rate as the number of inter- vening repeats increases (Figure
7).
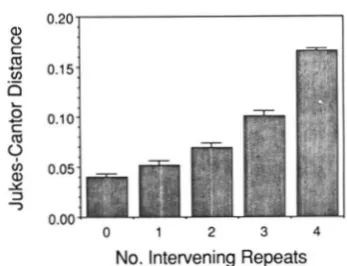
Because the adjacent repeat category in Figure
7
pools all pairs of adjacent repeats together, any effect of repeat position on adjacent repeat sequence simi- larity is obscured. Figure 8 shows that repeat location does affect the similarity between adjacent repeats. Adjacent pairs of repeats in the middle of the tandem repeat region show the most sequence similarity whereas adjacent repeats at each end of the repeat region show significantly greater distances. However, this divergence in sequence similarity is asymmetrical in that the repeat furthest from the tRNAPr", repeat six in most individuals, shows much greater differen- tiation from its neighboring repeat than does the repeat closest to the tRNA"'". Note, however, that repeat one is much less similar to repeat two than internal adjacent repeats. Thus, repeat one is unlikely to be the result of a recent duplication event.Bat D-Loop Sequence Variation 613 0.15
8
6 0.10 b
K
a
v)
c.
c
c
v
0.05nr
v) a,
Y
3 7
0.00
1-2 2-3 3-4 4-5 5-6
Repeat Pair Position
FIGURE Il.-Jukes-Cantor distances between adjacent 81-bp re- peats w i t h i n each of 52 bats. Sequences were obtained either from Ixlts homophsmic for six repeats or from the six repeat fragment of a heteroplasmic bat. Repeat positions are the .same as in Figure
6. Error bar indicates one standard error obtained by bootstrapping.
TABLE 3
Substitution bias within each repeat using all pairs of 52 sequences
Transver- Percent
Repeat Transversions Transitions sions
1 0 497 0
2 100 1718 5.5
3 192 1411 12.0
4 194 1130 14.6
5 378 1050 26.5
6 1253 784 61.5
Total 21 17 6590 32.1
~~ ~ ~
5 (6.1 %) guanosine, 9 (1 1.1
5%)
cytosine, 29 (35.8) thymidine and 38 (46.9) adenosine bases. Given these base pair frequencies, transversions should represent 78.4% of all substitutions. Instead, only 32.1 % of all substitutions are transversions. Transversions increase progressively from 0% in repeat one to 61.5% in repeat six (Table 3).Furthermore, the distribution of transversions is not random with respect to nucleotide position within a repeat (Figure 9). T h e transversions in repeats two through five are all due to an A-T substitution at position 40 in the repeat. Although substitutions have occurred at least once at 2 1 of the 8 1 sites in a repeat (Figure 9) only 11 sites have altered in repeats two through five. Nine of those 11 sites have also changed in repeat six, but only two of the 11 sites have ever changed in repeat one. Both repeat one and repeat six have substitutions at an additional five sites each. Some, but not all, of these substitutions occur in bulge areas or are paired with complimentary substitutions in stem regions of secondary structures (Figure 10) that can be computed, as described below, for each repeat.
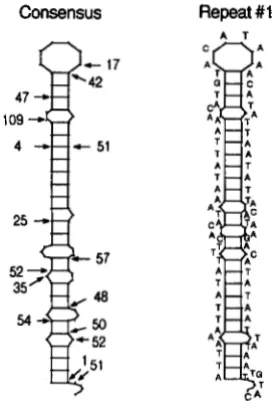
Repeat secondary structures: T h e most common sequence of the L strand first repeat, as well as all other repeat sequences, forms a secondary structure
(Figure 10) with a stem and terminal loop when the sequence is folded to minimize the free energy of the structure (ZUKER and STIECLER 198 1). Comparison of the minimum free energies associated with all first, second and end repeats, of which there are 9, 13 and
17 haplotypes, respectively, shows a significant differ- ence among the mean binding energies (F2.155 =
68.14, P = 0.0001). Fisher PLSD tests indicate that significant differences exist between all three repeats. Note, however, that repeat one shows noticeably lower average free energies than either repeat t w o or six (Table 4).
T h e sequence in the terminal loop of all structures formed is of interest because it includes the first 7 bp,
5’-ACATAAA-3‘, which DODA, WRIGHT and CLAY-
TON (1981) identified in humans as being 51-53 bp upstream from the termination of replication of the 7 s daughter strand. In the mouse, there are four such termination-associated sequences (TAS), one of which is the same as the human, and the other three differ by 1 bp, i.e. 5”ACATTAA-3
’.
T h e 7-bp human TAS also appears along one side of the stem in the second- ary structures. T h e probability of finding these 7 bp together anywhere in the 81-bp repeat, given the frequency of each nucleotide in the most common first repeat, is 0.069. T h e probability of finding these 7 bp in the terminal loop is 0.00086. Thus, the consistent location of this 7-bp sequence in the ter- minal loop can be considered a nonrandom event.As with sturgeon mtDNA repeats (BUROKER et al.
1990), lower free energies are obtained when more than one repeat is allowed to fold into a secondary structure. For example, folding repeat one and two for one bat gave a minimum free energy of -25.4, repeats one through three gave -40.9, repeats one through four -51.2, and repeats one through five -64.4. All of these structures were two-branched stem-loops with 5’-ACATAA-3’ in each terminal loop.
DISCUSSION
614 G . S. Wilkinson and A.
M.
ChapmanATTAAACTAT ATTCCACATG AATATTAAAC ATGTACATAA ATATATTAAT ATTACATAAG ACATATAATG TATAATTGTAC
1:.C....T
. . .
T...G.A. . .
. . .
o w w o w
N O D w N h )
.CG...
. .
...
00
NN
2 : . . .
...
.CC...A. .
...
G....
T 1. . .
A...
Lnw N o w N P W 0 m 0
4
3:...T... .CC...A
...
G....
T. . .
A...
. .
0N W o l w P N 4 0 03 0 N
4:
...
T... .CC. . .
G....
T C. . .
A. . .
C.....
. .
0 P O W
.
0 0.
N VIN P m N N 0 N 0
...
...
...
5:
...
.C...
A...
G. T A C.......
P 0 W P 0
0 h) W 0 3 N 0 N
.c..
.
0
N
2 3
6:
...
T... .CC...A...
C..G. . A...
T C...G.. 4...
T...
G.... CG....C....
P0
. .
o w 0 b , ? Io 0
. .
4 W P . P '9 4 4 0 0 0 w w w 0 0 w w. J O 4 w
FIGURE 9.-Location and frequency of substitutions within the 3' to 5' consensus sequence of the light strand of the 81-bp repeat. The proportion of the 52 bats carrying a particular substitution in each repeat is indicated below the respective base. Each substitution involved only one base pair change as indicated with four exceptions: ') one of three changes was A to G , ') one of two changes was T to A, ') one of two changes was G to C, and ') one of 39 changes was A to G .
Consensus Repeat #I
A T
FIGURE 10.-Secondary structures for the most common first repeat and the consensus sequence obtained by minimizing the free energy according to the Zuker-Stiegler method. The location and number of substitutions observed among repeats two through six for 5 2 bat sequences are indicated on the consensus repeat.
TABLE 4
Minimum free energies associated with stem-loop secondary structures of each repeat
~
Mean No. of different Repeat (kcal/mole) SE structures
1 -9.78 0.09 9
2 -8.03 0.13 13
6 -7.44 0.22 17
PCR of mtDNA can be used in parentage studies when maternal relationships are unknown.
Utility for matriline assignment: A high mutation rate for length variation reduces genetic differentia- tion of colonies. In the evening bat D-loop, mutation rates for length polymorphism are too high to allow fixation of different length variants in isolated popu- lations, but not high enough for most of the variation to be present within an individual. Thus, the fre- quency of mtDNA size classes within an individual can be used as a first approximation to assign individuals to matrilines because the most likely source for a length variant is through a common maternal ancestor rather than from a mutational event. However, a more accurate classification can be made by comparing the sequence patterns within repeats because there are many more unique repeat genotypes than length var- iants and the per generation mutation rate for a nucleotide substitution in each repeat is much smaller than the mutation rate for length polymorphism. Thus, by compiling a catalog of repeat haplotypes and then comparing the sequences of the repeats, rather than the nucleotides, it is not only possible to identify individuals to matrilines (G. S. WILKINSON unpub- lished), but also to track repeat evolution.
Bat D-Loop Sequence Variation 615
bats, Myotis lucijigus and Eptesicus fuscus (G. S. WILK- INSON and A.
M.
CHAPMAN, in preparation). Rabbits exhibit similar length variation except that the tandem repeats lie between the CSBs and the tRNAPhe (MIG- NOTTE et al. 1990). Although the frequency of heter- oplasmy in evening bats, 28%, is lower than that estimated in G y l l u s f i r m u s , 60%, or Gryllus pennsyl- uanicus, 45%, (RAND and HARRISON 1989), the diver- sity indices of all hybrid crickets, K c = 0.471 andKc
=0.149, are very similar to the diversity indices for all evening bats, K c = 0.487 and E b = 0.125. These
indices show that most of the length variation, 66.8% in evening bats and between 61.3 and 67.4% for crickets, occurs within a colony, or in the case of crickets, lineage. T o maintain this level of length variation in the absence of selection, the mutation rate for length polymorphism must be relatively high and/ or the population size must be large to counteract the effects of random assortment of mitochondria into gametes which will rapidly remove variation unless the pool of mitochondria per gamete is very large (CLARK 1988).
If the effective number of females is known and transmission is strictly maternal, then K , = 2Np/ (2Np
+
1) where N is the number of breeding females in the population and p is the mutation rate per individual (BIRKY, MARUYAMA and FUERST 1983). If we substitute the observed mutation rate of 0.0092 and the observed K , of 0.487 into this equation then N = 52. Because this estimate of population size is very close to the average number of adult females in the seven colonies we sampled, we conclude that the per generation mutation rate is near 9 X This mutation rate is about 20 times greater than that estimated for field crickets (RAND and HARRISON1989).
The length mutation event described in this paper required both a duplication and a deletion event. Initially, a duplication must have occurred in repeat three which presumably affected at least some of the maternal mtDNA molecules in the ovaries. In other words, the mother must have had different mtDNA forms in different tissues. This would explain why the maternal sequence amplified from a chest muscle bi- opsy could differ from both offspring sequences. The duplication event was apparently followed by a dele- tion of repeat four in some mtDNA molecules. If an ovum received one mtDNA type, a homoplasmic off- spring would result; if it received both types, the offspring would be heteroplasmic.
Mechanisms for length variation: Four different mechanisms have been proposed to account for length variation in mitochondrial DNA: intra- and intermo- lecular recombination (RAND and HARRISON 19$9), slipped mispairing (STREISINGER et al. 1966; EFSTRA- TIADIS et al. 1980), illegitimate elongation (BUROKER
et al. 1990), and transposition (RAND and HARRISON 1989). The recent documentation of DNA being transferred into mitochondria by a protein (VESTWE- BER and SCHATZ 1989) opens the possibility that trans- position could occur among mitochondria. Transpo- sition would not, however, produce both a duplication and deletion nor would it result in adjacent internal repeats being more similar than external repeats. Thus, transposition cannot account for the patterns of sequence variation we observe in N. humeralis, but it may account for the origin of the tandem repeat unit. Although both intra- and intermolecular recom-
bination is frequent in plant mtDNA (SEDEROFF
1987), no direct evidence of recombination has yet been found for animal mtDNA. As RAND and HAR- RISON (1 989) point out, intermolecular recombination results in molecules of differing sizes which have not yet been found. However, intramolecular recombi- nation between, for example, 7 s and parent mtDNA, need not alter molecule size and would be very diffi- cult to distinguish from replication slippage.
Although the slipped mispairing model was pre- sented to explain deletions which are flanked by short direct repeats (EFSTRATIADIS et al. 1980), a similar process could also produce duplications. Instead of the parental strand forming a single-stranded loop which gets excised before replication occurs, forma- tion of a single-stranded loop in the daughter strand will result in a repeat duplication after DNA replica- tion and resolution of the heteroduplex molecule. This is, in fact, the essence of the illegitimate elonga- tion model (BUROKER et al. 1990). Both processes are clearly a form of replication slippage. BUROKER et al.
(1990) claim that illegitimate elongation is unique to mitochondrial replication because of its triplex nature. An alternative and perhaps more revealing distinction is that mtDNA, unlike nuclear DNA, replicates each strand independently. In the D-loop this process is unidirectional for
7s
mtDNA because the L strand does not begin replicating until H strand replication reaches the L strand origin of replication, a conserved noncoding region between the tRNAAsn and the tRNACys genes (CLAYTON 1982). Unidirectional rep- lication is significant because repeat duplication can only occur in one direction. Thus, the most recently duplicated repeat should be at the end of an array unless the last repeat in the array is protected in some way from undergoing a deletion event.616 G . S. Wilkinson and A. M. Chapman cated recently. Presumably, the first and last repeats
in the array undergo duplication and deletion events at much lower rates, if at all, than the internal repeats.
Evidence for selection: If a duplication event is not
always accompanied by a corresponding deletion, then copy number will change in one strand and hetero- plasmy will result. Thus, partial independence be- tween duplications and deletions can account for het- eroplasmy, but cannot explain why we usually found six but never less than five or more than eight repeats. If our estimate of p is correct and the occurrence of tandem repeats predates the origin of the genus, as their presence in both Myotis and Eptesicus indicates, then there has been ample time for more variation in repeat copy number to occur unless selection also acts to maintain an optimal number of copies. One possible reason for an intermediate number of repeats is that a large secondary structure composed of five, six or more repeats may form when a
7s
strand binds to a protein. If such protein binding occurs, then an opti- mal number of repeats probably exists and more or fewer repeats should decrease binding efficiency. Un- der this scenario we might expect to find repeat number, as well as nucleotide sequence, differing be- tween related species.The explanation just provided is insufficient by itself, however, to explain the patterns of nucleotide sequence similarity we found between bats at each repeat. If substitution rates are equal along each re- peat and selection is absent, then all repeats, even those that duplicate, should diverge between bats at equal rates. Thus, in the absence of selection the nucleotide differences between bats from different states should be the same for each repeat. However, the repeat nearest the tRNAP'" is much more con- served between bats than the other five repeats indi- cating that substitutions are either less frequent or less tolerated in this repeat. The hypothesis that repeat one is under purifying selection is consistent with the absence of transversions in this repeat but not in other repeats and with repeat one having the lowest average free energy associated with a folded stem-loop struc- ture. Therefore, an alternative interpretation of these findings is that only one repeat is necessary for protein binding. Some other explanation must then be pro- vided to explain the apparent limitation on copy num- ber within a tandem array. If true, this latter scenario implicates concerted evolution as the mechanism caus- ing sequence similarity among internal repeats and within, but not necessarily between, bats while nu- clear-mitochondrial coevolution is likely to be respon- sible for sequence similarity between bats at the first
repeat. Comparison of repeat sequences among
closely related species should help to resolve where and how selection acts on length and sequence varia- tion in this region.
We thank W. STEPHAN, A. CLARK and two anonymous reviewers for helpful comments on the manuscript, F. MAYER, D. O'REILLY, A. SCHERRER, S. STEELE, P. TRAIL, R. WILLIAMS and L. WOLFEN-
BARGER for assistance in the field, and the Smith, Grim, Hutton, Busby, Easton, and McLain families for access to bat colonies. We are grateful to T. KOCHER for providing the C and E primers and to W. RASBAND for providing the image analysis program. Sup- ported by a Searle Scholar Award/Chicago Community Trust and by a biomedical research support grant from the University of Maryland.
LITERATURE CITED
ALBRING, M., J. GRIFFITH and G. ATTARDI, 1977 Association of a protein structure of probable membrane derivation with HeLa cell mitochondrial DNA near its origin of replication. Proc. Natl. Acad. Sci. USA 74: 1348-1352.
AQUADRO, C. F., and B. D. GREENBERG, 1983 Human mitochon- drial DNA variation and evolution: analysis of nucleotide se- quences from seven individuals. Genetics 103: 287-312. BECKER, W. A., 1975 Manual of Quantitative Genetics, Ed. 3. Wash-
ington State University, Pullman.
BENTZEN, P., W. C. LEGGETT and G. G. BROWN, 1988 Length and restriction site heteroplasmy in the mitochondrial DNA of American shad (Alosa sapidissima). Genetics 118: 509-518.
to population and evolutionary genetic theory for genes in mitochondria and chloroplasts, and some results. Genetics 103:
513-527.
BOYCE, T. M., M. E. ZWICK and C. F. AQUADRO, 1989 Mitochondrial DNA in the bark weevils: size, structure and heteroplasmy. Genetics 123: 825-836.
BROWN, W. M., 1985 The mitochondrial genome of animals, pp. 95-130 in Molecular Evolutionary Genetics, edited by R. J. MACINTYRE. Plenum, New York.
BUROKER, N. E., J.R. BROWN, T. A. GILBERT, P. J. O'HARA, A. T. BECKENBACH, W. K. THOMAS and M. J. SMITH, 1990 Length heteroplasmy of sturgeon mitochondrial DNA: an illegitimate elongation model. Genetics 124: 157-163.
CANN, R. L., and A. C. WILSON, 1983 Length mutations in human mitochondrial DNA. Genetics 104: 699-7 1 1.
CHANG, D. D., and D. A. CLAYTON, 1985 Priming of human mitochondrial DNA replication occurs at the light-strand pro- moter. Proc. Natl. Acad. Sci. USA 82: 351-355.
CHANG, D. D., T. W. WONG, J. E. HIXSON and D. A. CLAYTON, 1985 Regulatory sequences for mammalian mitochondrial transcription and replication, pp. 135-144 in Achievements and Perspectives of Mitochondrial Research, edited by E. QUAGLI-
ARIELLO, E. C. SLATER, F. PALMIERI, C. SACCONE and A. M. KROON. Elsevier, New York.
CLARK, A. G., 1988 Deterministic theory of heteroplasmy. Evo- lution 42: 621-626.
CLAYTON, D. A., 1982 Replication of animal mitochondrial DNA. Cell 28: 693-705.
DODA, J. N., C. T. WRIGHT and D. A. CLAYTON, 1981 Elongation of displacement-loop strands in human and mouse mitochon- drial DNA is arrested near specific template sequences. Proc.
Natl. Acad. Sci. USA 78: 61 16-6170.
EFSTRATIADIS, A., J. W. POSAKONY, T. MANIATIS, R. M. LAWN,
c.
O'CONNELL, R. A. SPRITZ, J. K. DERIEL, B. G. FORGET, S. M. WEISSMAN, J. L. SLIGHTOM, A. E. BLECHL, 0. SMITHIES, F. E. BARALLE, C. C. SHOULDERS and N. J. PROUDFOOT, 1980 The structure and evolution of the human &globin gene family. Cell 21: 653-668.FORAN, L. A., J. E. HIXSON and W. M. BROWN, 1989 Similarities of ape and human sequences that regulate mitochondrial DNA transcription and their DNA synthesis. Nucleic Acids Res. 17:
BIRKY, C. W.J., T. MARUYAMAand P. FUERST, 1983 An approach
Bat D-Loop Sequence Variation 617
GREENBERG, B. D., J. E. NEUBOLD and A. SUGINO, 1983 Intraspecific nucleotide sequence variability surround- ing the origin of replication in human mitochonrial DNA. Gene 21: 33-49.
GYLLENSTEN, U. B., and H. A. EHRLICH, 1988 Generation of single-stranded DNA by the polymerase chain reaction and its application to direct sequencing of the HLA-DQa locus. Proc. Natl. Acad. Sci. USA 85:7652-7655.
HARRISON, R. G., 1989 Animal mitochondrial DNA as a genetic marker in population and evolutionary biology. TREE 4: 6- 1 1 .
HILLIS, D. M., C. MORITZ, C. A. PORTER and R. J. BAKER, 199 1 Evidence for biased gene conversion in concerted evo- lution of ribosomal DNA. Science 251: 308-310.
LA ROCHE, J., M. SNYDER, D. I. COOK, K. FULLER and E. ZOUROS, 1990 Molecular characterization of a repeat element causing large-scale size variation in the mitochondrial DNA of the sea scallop Placopecten magellanicus. Mol. Biol. Evol. 7: 45-64.
JUKES, T. H., and C. R. CANTOR, 1969 Evolution of protein molecules., pp. 21-132 in Mammalian Protein Metabolism, ed- ited by H. N. MUNRO. Academic Press, New York.
MICNOTTE, F., M. GUERIDE, A.-M. CHAMPAGNE and J.-C. MOUNO- LOU, 1990 Direct repeats in the noncoding region of rabbit mitochondrial DNA: involvement in the generation of intra and inter-individual heterogeneity. Eur. J. Biochem. 194: 561- 571.
MORITZ, C., and W. M. BROWN, 1987 Tandem duplications in animal mitochondrial DNAs: variation in incidence and gene content among lizards. Proc. Natl. Acad. Sci. USA 8 4 7183- 7187.
NEI, M., 1987 Molecular Evolutionary Genetics. Columbia Univer- OHNO, S., 1970 Evolution by Gene Duplication. Springer Verlag, OHTA, T., 1980 Evolution and Variation in Multigene Families.
Springer Verlag, Berlin.
POULTON, J., M. E. DEADMANand R. M. GARDINER, 1989 Tandem duplications of mitochondrial DNA in mitochondrial myopa- thy: analysis of nucleotide sequence and tissue distribution. Nucleic Acids Res. 17: 10223-10229.
RAND, D. M., and R. G. HARRISON, 1989 Molecular population sity, New York.
Berlin.
genetics of mtDNA size variation in crickets. Genetics 121: ROFF, D. A., and P. BENTZEN, 1989 The statistical analysis of mitochondrial DNA polymorphisms:
'
x
and the problem of small samples. Mol. Biol. Evol. 6 539-545.SACCONE, C., M. ATTIMONELLI and E. SBISA, 1987 Structural elements highly preserved during the evolution of the D-loop- containing region in vertebrate mitochondrial DNA. J. Mol.
SAMBROOK, J., E. F. FRITSCH and T. MANIATIS, 1989 Molecular Cloning: A Laboratory Manual, Ed. 2 (3 vols.). Cold Spring Harbor Laboratory, Cold Spring Harbor, N.Y.
SANGER, F., S. NICKLEN and A. R. COULSON, 1977 DNA sequenc- ing with chain-terminating inhibitors. Proc. Natl. Acad. Sci.
SEDEROFF, R. R., 1987 Molecular mechanism of mitochondrial genome evolution in higher plants. Am. Nat. 130: S30-S45. SOLIGNAC, M., M. MONNEROT and J.-C. MOUNOLOU,
1986 Concerted evolution of sequence repeats in Drosophila
mitochondrial DNA. J. Mol. Evol. 2 4 53-60.
SOUTHERN, S. O., P. J. SOUTHERN and A. E. DIZON, 1988 Molecular characterization of a cloned dolphin mito- chondrial genome. J. Mol. Evol. 28: 32-42.
STREISINGER, G., Y. OKADA, J. EMRICH, J. NEWTON, A. TSUGITA, E. TERZAGHI and M. INOUYE, 1966 Frameshift mutations and the genetic code. Cold Spring Harbor Symp. Quant. Biol. 31:77-84.
VESTWEBER, D., and G. SCHATZ, 1989 DNA-protein conjugates can enter mitochondria via the protein import pathway. Nature
WATKINS, L. C., 1970 Observations on the distribution and nat- ural history of the evening bat (Nycticeius humeralis) in north- 551-569.
EvoI. 2 6 205-21 1 .
USA 74: 5463-5467.
338: 170-172.
western Missouri and adjacent Iowa. Trans. Kans. Acad. Sci. 72: 330-336.
ZEVIANI, M., S. SERVIDEI, C. GELLERA, E. BERTINI,
s.
DIMAUROand S. DIWNATO, 1989 An autosomal dominant disorder with multiple deletions of mitochondrial DNA starting at the D-loop region. Nature 3 3 9 309-3 1 1 .ZUKER, M., and P. STIEGLER, 1981 Optimal computer folding of large RNA sequences using thermodynamics and auxiliary information. Nucleic Acids Res. 9: 133-148.