Mixed Segregation of Chromosomes During Single-Division Meiosis of
Saccharomyces cerevisiae
Gil Sharon' and Giora Simchen
Department of Genetics, The Hebrew University of Jerusalem, Jerusalem 9 1 9 0 4 , Israel Manuscript received August 20, 1989
Accepted for publication March 9, 1990
ABSTRACT
Normal meiosis consists of two consecutive cell divisions in which all the chromosomes behave in a concerted manner. Yeast cells homozygous for the mutation cdc5, however, may be directed through a single meiotic division of a novel type. Dyad analysis of a cdc5/cdc5 strain with centromere-linked markers on four different chromosomes has shown that, in these meioses, some chromosomes within a given cell segregate reductionally whereas others segregate equationally. The choice between the two types of segregation in these meioses is made individually by each chromosome pair. Different chromosome pairs exhibit different segregation tendencies. Similar results were obtained for cells homozygous for c d c l 4 .
M
EIOSIS in eukaryotes consists of two consecu- tive nuclear divisions. In the first division cen- tromeres segregate reductionally and in the second divide equationally. Diploid sporulating cells of Sac- charomyces cerevisiae undergo a meiotic process, which is similar to that of most other eucaryotic organisms. Usually, the products of meiosis in yeast are four haploid spores, a tetrad, held together in an ascus. However, certain mutations result in aberrant forms of meiosis, which give rise to unusual spores. When diploid strains homozygous for either of the temper- ature-sensitive mutations cdc5 or cdcl4 are shifted to the restrictive temperature after initiating the first meiotic division, they form dyads (two-spored asci) rather than tetrads (SCHILD and BYERS 1980). Each dyad contains two viable diploid spores. Genetic analy- sis of such spores has shown that they result from asingle division in which centromeres have gone
through a first-division segregation (SCHILD and
BYERS 1980). Strains homozygous for $ p o l 2 and/or s p o l 3 also tend to form diploid dyads, but in these cases each ascus usually appears to have resulted from a single division in which the centromeres have under-
gone a second-division segregation (KLAPHOLZ and
ESPOSITO 1980). It seems, therefore, that a successful equational division is not essential for spore formation and maturation, nor is it necessary to have a successful reductional division prior to the equational one. In all of these mutants, meiotic events known to precede the divisions, such as formation of synaptonemal com-
plexes and meiotic recombination, have been ob-
served.
During meiosis, a temperature shift from 23" to
' Present address: Department of Biological Chemistry, T h e Hebrew University of Jerusalem, Jerusalem 91 904, Israel.
Genetics 125: 475-485 (July, 1990)
34" can cause an arrest of cdc5/cdc5 diploids prior to either the first or the second division, depending on the time of the shift. If the shift is made at the beginning of meiosis, arrested cells are mononucleate. Ultrastructural analysis of these cells has shown
(SCHILD and BYERS 1980) that they have two spindle poles, situated on opposite sides of the nucleus. The microtubules from the poles are not interconnected, but extend into the nucleus. If the shift is made after the cells have already gone through the first meiotic division they do not go through the second one. Two spindles which are unable to elongate are observed, and the four spindle poles encapsulate into two viable diploid spores (SCHILD and BYERS 1980). We wanted to investigate the effects of a late release of cdc5 homozygotes arrested at the mononucleate stage. Our initial attempt was to test whether cells, under these conditions, could advance to the second meiotic divi- sion without going through the first one. Somewhat unexpectedly we found that although diploid dyads were produced, their chromosome segregation pat- tern was neither that of the first meiotic division nor that of the second. Genetic analysis of colonies pro- duced by these spores, using markers linked to four centromeres, has shown that in most cases, some of the centromeres within a single sporulating cell have segregated reductionally whereas the others have seg- regated equationally. The apparent independence in segregation of individual chromosomes demonstrates that the decision as to how to segregate is made at a subcellular level. Significant differences in the tend- ency to segregate either reductionally or equationally
were detected among the four chromosomes that were
476 G. Sharon and G. Simchen
pendently at the level of each chromosome pair. Sim- ilar "mixed" segregations were also observed in a strain homozygous for the mutation c d c l 4 .
MATERIALS AND METHODS
Yeast strains:
Strain 11:MATa,cdc5-l,ura3,canl-ll,adel,leul,metl4.
Strain 22: MATa, cdc5-1, cdc7, ura3, lys2.
Strain 33: M A T a , c d c 1 4 - 3 , a d e l , t r p l , his2, l e u l , m e t l 4 . Strain 44: MATa, cdc14-3, ura3, canl-11.
These strains were derived from crosses among labora- tory strains of various origins.
Strain 1 122 is a diploid constructed by mating strain 11 with strain 22.
Strain 11 22-IU was constructed by integrative transfor- mation (ORR-WEAVER, SZOSTAK and ROTHSTEIN 1981) of strain 1122 with the plasmid pJM82. In order to direct the integration into the desired location, the plasmid was cleaved by Hind111 within the chromosomal insertion. The integration placed the external U R A 3 gene as well as pBR322 sequences close to C E N 7 , on the right arm of chromosome VII which carried the allele l e u l . As a result, U R A 3 and LEU1 in this strain were situated in trans, on opposite arms of chromosomes VII. Strain 3344 is a diploid constructed by mating strain 33 with strain 44.
Plasmids: The plasmid pJM82 was obtained fromJEANNE P. MARGOLSKEE. It consists of the plasmid YIp5 (SCHERER and DAVIS 1979) with an insertion of a 1.5-kb, BamHI-EcoRI DNA fragment from the right arm of chromosome V U , 34 kb from CEN7
(J.
P. MARGOLSKEE, personal communica- tion).Media: Liquid culture media PSP2 and SPM were pre- pared according to SIMCHEN, PINON and SALTS (1 972). MIN (minimal solid medium) is a minimal glucose medium. Com- plete solid synthetic medium was prepared in the same way but included adenine and uracil, as well as amino acids, as described previously (SHILO, SIMCHEN and SHILO 1978). Selective nledia did not include the component selected for. Canavanine solid medium has been described (KASSIR and SIMCHEN 1985). SPO solid sporulation medium has been described (HICKS and HERSKOWITZ 1976).
Shift-down experiments: Cells were transferred to liquid sporulation medium (SPM) after reaching a titer of l o 7 cells/ml in presporulation medium (PSP2) at 23". Half an hour after the transfer to SPM, the cells were shifted to the restrictive temperature (34"), thus allowing ''late'' cells to complete the mitotic cycle before imposing the temperature regime. At different times, subcultures were shifted down to the permissive temperature (23") and cells were allowed to continue sporulation under permissive conditions. T h e frequencies of tetrads, dyads and monads (one-spored asci) were scored 60 hr after transfer to sporulation medium.
Scoring of temperature-sensitive alleles: Three cell-di- vision cycle genes with temperature-sensitive alleles were used and scored in these experiments, namely cdc5, cdcl4, and cdc7. The temperature-sensitive phenotype was scored by replica plating on prewarmed YEPD plates followed by incubation at 37" for 2 days. When temperature-sensitive alleles at two different loci were examined in the same set of progeny, for instance both cdc5 and cdc7, segregation was scored by mating to testers carrying only one of the t s mutations, followed by replication of the resulting diploids onto YEPD at 37 O .
Spore analysis: Tetrads or dyads were dissected as de- scribed by DAVIDOW, GOETSH and BYERS (1 980). Each dyad was placed separately next to a droplet of full-strength
TABLE 1
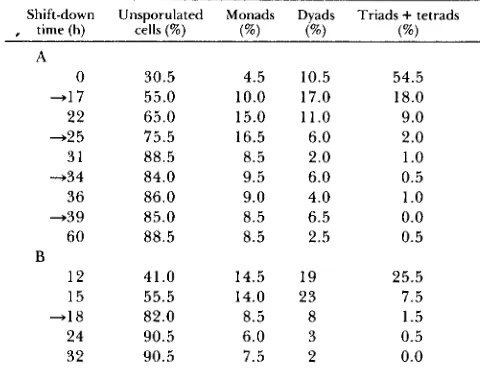
Frequencies of asci of cdcS/cdcS strain following temperature shift-down at various times during arrested sporulation
, time (h) cells (%) (%) (%) (%) Shift-down Unsporulated Monads Dyads Triads
+
tetradsA
0 -1 7 22 -2 5 31 +3 4 36 -39
60
12 15 -18
24 32
B
30.5 55.0 65.0 75.5 88.5 84.0 86.0 85.0 88.5
41.0 55.5 82.0 90.5 90.5
4.5 10.5 10.0 17.0 15.0 11.0 16.5 6.0 8.5 2.0 9.5 6.0 9.0 4.0 8.5 6.5 8.5 2.5
14.5 19 14.0 23 8.5 8 6.0 3
7.5 2
54.5 18.0 9.0 2.0 1
.o
0.5 1.o
0.0 0.525.5 7.5 1.5 0.5 0.0 Sporulation was initiated by the transfer of diploid cells of strain 1122 from PSP2 to SPM media at 23". Half an hour later, the temperature was shifted to 34". At various times after the initiation of sporulation, aliquots were shifted down to 23". Asci frequencies in the aliquots were scored 60 h after the initiation. A and B are two independent experiments. Monads, dyads, triads and tetrads are one-spored, two-spored, three-spored and four-spored asci, respectively (sample size 200-300 cells). -, Shift-down times from which genotypes of dyads and spores were analyzed.
TABLE 2
Spore viability in dyads of strain 1122-1U (shift-down at 18 hr)
No viable One viable T w o viable
Both spores are ala 0 0 97
(89 were analyzed)
is ala (105 were (all were
analyzed) analyzed) One of the spores 0 109 4 8"
Others" 618 701 469
Totdl 2042 618 810 - -
-
614 The 48 dyads in which only one of the spores was a diploid a/a consisted of 27 in which the other spore was either a or a, and
2 1 in which the other spore was unidentified (a nonmater that could not sporulate).
This category consists of dyads of which both spores did not germinate and therefore could not be characterized, and dyads which could not be analyzed because none of the spores gave rise to sporulating a/a diploids. This latter group consisted of maters
(as or as) and of nonmaters which had not undergone sporulation for unidentified reasons (of 538 spores from dyads having two viable spores, 19 were nonmaters but could not sporulate).
dure which is fast and simple but can be somewhat imprecise. In cases where a precise determination was required, we identified the genotype of the colonies by progeny-tetrad analysis as well. The results obtained by both methods were in complete agreement. Random spore analysis was per- formed as follows. Ascus walls were digested for three hours at 37" with Glusulase diluted 1/10 in water. The asci were then sonicated with Branson Sonifier microtip at level 7 for approximately 40 sec (six doses of 7 sec each). The spores were plated on YEPD, incubated for 5 days at 23" and the resulting colonies were analyzed by replica plating.
Adjustments for comparison analysis: Segregation of markers among dyads having a single viable spore was determined by analyzing one spore per dyad, whereas in dyads having two viable spores, segregation was determined by analysis of both spores. In order to compare the distri- bution of genotypes among dyads with only one viable spore with dyads containing two viable spores, an adjustment had to be made. The one-viable spore dyads were scored sepa- rately and each was given half a weight in the analysis, compared to dyads with two viable spores. I n dyads where gene conversion of a given marker took place, the segrega- tion of the marker in one spore appeared to be different from its segregation in the other. Such markers were there- fore scored as two half-weight cases, each contributing to the overall size of a different category of segregants. An- other adjustment had to be made in cases where one of the two viable spores of a dyad was an a/a and the other was either an a or an a mater. In these cases, only the a/a spore was analyzed and given half a weight in the analysis.
RESULTS
Analysis of diploid dyads (two-spored asci): Cells of strain 1 122-1U, homozygous for cdc5, were shifted down from restrictive to permissive temperature at various times after the onset of meiosis (see MATERIALS AND METHODS for details). A relatively high propor- tion of dyads was observed in subcultures of inter- mediate shift-down times (12-22 hr, see Table 1 for results obtained in two independent experiments). At later shift-down times, there was a decline in the frequency of dyads but it was less pronounced than the decline in the frequency of tetrads. Preliminary experiments (not shown) demonstrated that some of the dyads, especially ones which belong to early shift- down subcultures were haploid-spored. In order to minimize the proportion of these dyads among the ones examined, we analyzed dyad populations from intermediate and late shift-down subcultures (shifted at 17, 18, 25, 34 and 39 hr after the transfer to SPM medium, see Table 1). All these populations gave similar results. Observations from the most thor- oughly studied population (shifted-down 18 hr after transfer to SPM, in experiment B listed in Table 1) are described below:
Of the 2042 dyads isolated and dissected (see MA- TERIALS AND METHODS), 6 14 had two viable spores, 8 10 had one viable spore (the other spore did not give rise to a colony) and 618 had two inviable spores (Table 2). ala diploid spores (which gave rise to nonmater colonies with sporulation ability) were fur-
CHROMOSOMES a a D Y A D S CELL
IN PARENT
:HROMOSOMES I1 PARENT
o a : Y A : ~
\
b
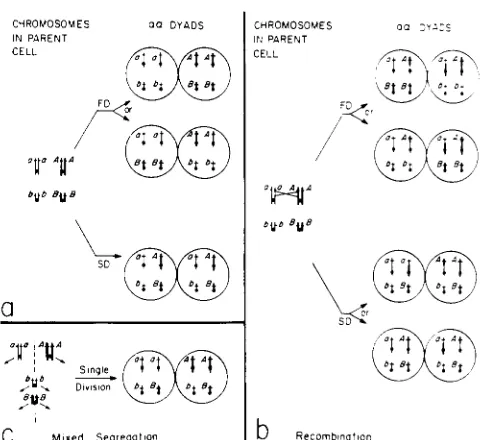
RecomblnaflorFIGURE 1 .-Products of single-division meiosis. Homologous chromosomes are drawn similar in length and shape but different in width. A and B indicate dominant alleles of centromere-linked markers on different chomosomes. a and b indicate the respective recessive alleles. Black circles indicate centromeres. (a) Simple seg- regations in a single division: top, two alternatives of FD (first division) segregation; bottom, SD (second division) segregation. (b)
A single crossover event between marker A and the centromere followed by either FD or SD segregation. (c) Autonomous segre- gation of independent chromosomes; one pair of chromosomes undergoing FD segregation and another going through SD segre- gation (within the same cell).
ther analyzed by resporulation of these colonies and progeny-testing, in order to determine their geno-
types (see MATERIALS AND METHODS). To determine
which meiotic division had taken place, we examined the dyads that had two viable diploid spores (89 out of 97). Such dyads held all the meiotic products of a given meiosis and therefore contained complete infor- mation concerning it. We expected these dyads to have resulted from cells which had either gone through the first or the second meiotic division (the mating type locus is 25 cM away from the centromere
of chromosome
ZZZ
(MORTIMER and SCHILD 1980),allowing the formation of a/a diploid dyads in either case). A diploid strain which is heterozygous for cen- tromere-linked markers is expected to give rise to homoallelic spores following a first meiotic division, or alternatively, to heteroallelic spores following a second meiotic division. We followed the segregation patterns of markers on four chromosomes. T h e ex-
pected segregation patterns of centromere-linked
markers are shown in Figure 1, a and b. Surprisingly, many of the diploid dyads exhibited a mixed-segre-
gation phenotype. Some of the centromere-linked
478 G. Sharon and G. Simchen
TABLE 3
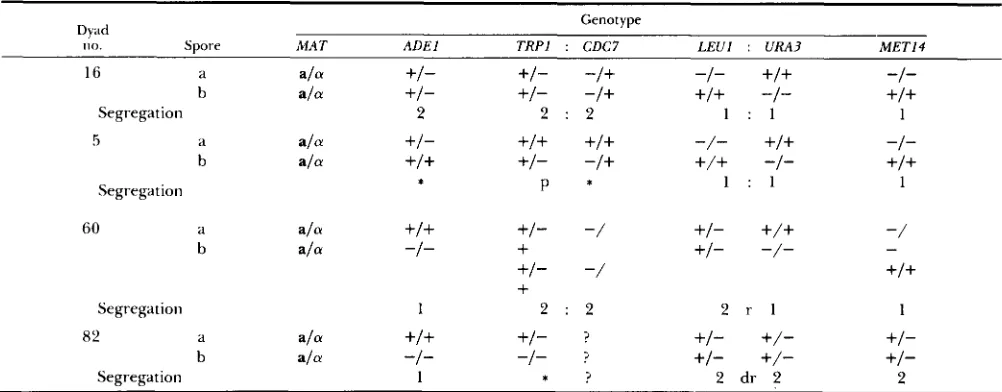
Detailed segregations of centromere-linked markers in four dyads carrying two viable diploid a/a spores
Dyad Genotype
1 1 0 . Spore MAT ADEl TRPl ; CDC7 LEU1 : URA3 MET14
16 a ala +I- +/- -/+ -1-
+/+
-I-ala +/- +/- -/+
+/+
-1- +I+5 a ala +/-
+/+
+/+
-/-+/+
-I-b
Segregation 2 2 : 2 1 : l 1
b ala +I+ +/- -/+
+/+
-1- +I+Segregation : 1 : l P * 1
60 a ala +I+ +I" -/ +/-
+/+
-/b a/. -I-
+
+/- -/--
+I- -/ +I+
+
Segregation 1 2 : 2 2 r l 1
82 d a/. +I+ +/- ? +/-
+/-
+/-ala -I- -/- ? +/-
+/-
+/-b
Segregation 1 : ? 2 dr 2 2
A detailed presentation of four of 89 dyads which had two viable ala diploid spores (see Table 4). 1, 1st meiotic segregation; 2, 2nd meiotic segregation; :, linked genes; r, single recombination between linked genes; dr, double recombination between linked genes; :, gene conversion; p, (pms) postmeiotic segregation (in this case spore b gave rise to a culture with two types of tetrads with respect to T R P l
segregation, ?+:2- and 0+:4-; spore a gave rise to 4+:0- tetrads and therefore the projected original segregation was 5:3); ?, not checked.
perature (G. SHARON, unpublished data). Four exam- ples of the phenotype, some of which are quite rare, are shown in Table 3 to illustrate the method of analysis. A summary of the data from 89 dyads is shown in Table 4. T h e results demonstrate that most dyads (54 out of 89) exhibit a mixed-segregation phenotype. Table 5 shows the segregation patterns of markers in a/a spores from dyads with a single viable a/a spore (105 such spores, see Table 2), or dyads with two viable spores, one of which is ala and the other either a, a , or undetermined (48 such spores, see Table 2). Again, most of these spores exhibit mixed segregation patterns rather than a 1st meiotic segregation pattern (class no. l), or a 2nd meiotic segregation pattern (class no. 16).
Recombination does not explain mixed segrega- tion patterns: The mixed segregation of the markers could reflect a genuine heterogeneity in the segrega- tion patterns of chromosomes, or could result from exceptionally high recombination rates between the centromeres and the various markers (see Figure 1 b). In order to obtain recombination frequencies in the centromeric regions and follow the segregation pat- terns of chromosomes, we examined chromosomes bearing pairs of centromere-linked markers, on both sides of the same centromere. T h e recombination frequency between a pair of centromere-bracketing markers in the diploid dyads could be compared to the frequency in tetrads. An additional bonus of such a design is that the segregation pattern of a given centromere can be determined with a higher certainty by following the segregation of the markers on both sides of the centromere.
Chromosomes ZV of strain 1122 are heterozygous in trans for trpl (which is located on the right arm, about 2.3 cM from CEN4, see Table 6) and cdc7 (which is located on the opposite arm, 4.4 cM distal from CEN4, see Table 6). Thus the genotypes at both loci, T R P l and CDC7, were used to follow the segre- gation of CEN4. In order to follow the segregation of
centromere-bracketing markers on another pair of
chromosomes, we integrated a URA3 gene into the right arm of one of the chromosome VZZ homologs,
7.7
cM away from CEN7 (leu1 is located on the leftarm of the same chromosome, 4.1 cM from CEN7,
see Table 6). T h e strain in which URA3 is integrated near CEN7 is called 1122-1U, and was used for all of the experiments reported here.
In the dyads, the recombination distances between T R P l and CDC7 and between LEU1 and the inte- grated URA3 were 1.9 and 13.6 cM, respectively. In tetrads the distances were 5.9 and 15.4 cM, respec- tively (see Table 6). T h e differences between dyads and tetrads may be due to sample size. At any rate, high frequency of recombination around the centro- meres as the cause of the mixed segregation pheno- type, can be ruled out.
TABLE 4
Diploid dyads with two viable ala spores: segregation of centromere-linked markers
I IV VI1 x 1
A T:C L:U M
1 IV VI1 x1
A T:C L:U M
2 2 1 * * 2 1 2 1 * * * * 1 2 1 1 2 1 1 * * * P * * 2 1 1 *
1-1 2 *
2-2 2-2
2-2 2-2
2-2 2-2
p * 1-1
1+2 2-2
1-1 2-2
2-2 2-2
2-2 1+2
2-2 1+2
1-1 2+1
2-2 2-2
1-1 1-1
1+2 2+2
2-2 1-1
2-2 1-1
2-2 1-1
1-1 1-1
1-1 1-1
* 2 1-1
1-1 * 2
2-2 2-2
* 2 2-2
1-1 1-1
2-2 2+2
2-2 1-1
2-2 2-2
1 ? 1+2
p 2 1-1
1 dis
1 1 dis
1 dis
1
1 dis
1 dis
2 2 dis
2 1 1
* dis
1 1 2 1
1
2 dis
2 1 2 1 dis
1 1 2 1 * *
* ? 1 * l d i s
1 2-2 2-2 2
1 2-2 1-1 2
1 1-1 1-1 1 dis
* 1-1 1-1 1
2 1+2 1 * 1
* 1-1 1-1 1
1 1-1 1-1 1
2 1-1 * * 1 dis
2 1-1 1-1 1
1 1-1 1-1 1
2 2-2 1-1 1
1 2-2 2 1
* 2-2 2+1 1
1 1-1 1-1 1
1 1-1 1-1 1
2 2-2 1-1 2dis
2 2-2 1-1 1
1 1 * 1-1 1
1 1-1 1-1 1
* 2-2 1-1 2
* 1-1 2-2 * d i s
1 1-1 1-1 1
2 1-1 2+1 *dis * 1-1 1-1 1 dis
2 2-2 2-2 1
1 2-2 2-2 2
2 2-2 2-2 2
2 1-1 1+2 1
1 1-1 1+2 1
1 2-2 2+1 1 dis
1 2 ? 2+1 1
1 2-2 1-1 1
2 2-2 2-2 *
* 1-1 1-1 1 dis
* 2-2 2+2 *
1 1-1 1-1 1
1 2-2 1-1 2dis
* 2-2 * 1 1 dis
1 2-2 1+2 1 dis
1 1-1 1-1 1
2 1-1 2-2 1 dis
1 1-1 1-1 1
2 1-1 2-2 1
1 2 ? 1+2 1 dis
1 2-2 1-1 *
1 2-2 2-2 1 dis
1 2-2 1+2 1
1 1-1 1-1 1
* 2-2 1-1 1 dis
1 2-2 2-2 1
* 1-1 1-1 1
1 1 ? 2 x 2 2
2 2-2 * 2 2
2 2-2 2-2 2
* 1-1 1-1 1
* * * 1-1 1
1 2-2 2-2 1 dis
2 1-1 1-1 1
2 2-2 1-1 1 dis
Summary: segregation frequencies of each of the markers (gene conversion cases are excluded)
A D E l
T R P l CDC7 LEU1 uRA3 MET14
Equational segregation/total 24/63 43/82 4718 1 32/84 33/86 18/8 1
38.1% 52.4% 58.0% 38.1% 44.2% 22.2%
1, 1st meiotic division segregation; 2, 2nd meiotic division segregation; A, T, C, L, U, M, the markers ADEl, TRPl, CDC7, LEUl, LIRA3,
MET14, respectively; p, (pms) postmeiotic segregation; *, gene conversion; dis, genotype checked by dissection of tetrads of the diploid colonies formed by each of the dyad’s spores; ?, genotype was not checked; :, linked markers; -,
+,
X, recombination between two linked markers: no crossing over, single, and double crossovers, respectively (corresponding to PD, TT, and NPD in tetrads, respectively).and a recessive allele of the other. In diploid dyads, a reductional division segregation would result in one spore being
+-
and the other being-+
for thephenotypes of the two markers (and
+-/+-
and-+/
-+,
respectively, for the genotypes). An equational division would result in the two spores being of phe- notype++
(and genotype+-/-+).
All single cross- over events between the markers and most of the possible double crossover events would result in chro- matids marked in cis and thus be identified.Double crossover events, in which only two of the four chromatids were involved, appear as noncros- sover cases. Such cases in which the first crossover was between the centromere and one marker, and the second was between the centromere and the other marker, could be misleading because reductional seg- regations in these cases would seem as equational and one half of the equational segregations would seem as
reductional ones. Two-strand double crossovers con- stitute 0.25 of the possible double crossover cases. Considering the genetic distances of the markers from their respective centromeres, and assuming no inter- ference, the expected frequency of double crossovers of the relevant types is 0.101% (0.046 X 0.088 X 0.25) for chromosomes
N ,
and 0.316% (0.082 X 0.154 X 0.25) for chromosomes VZZ. The frequency of cases in which one pair of chromosomes could have erroneously seemed to have segregated differently from the other pair due to double crossover is there-fore expected to be 0.417% (0.023%
+
0.164%). Theactual frequency of such segregations was 25% (18/
480 G. Sharon and G . Simchen
TABLE 5
Segregation of the four centromere-linked markers in dyads where only one of the spores could be scored (16 possible
classes)
Markers Dyad type
Class A D E TRP LEU MET A B C
1) 1 1 1 1 27 11 5
2) 1 1 1 2 2 1
3) 1 1 2 1 7 1
4 ) 1 2 1 1 8 2
5 ) 12 1 1 12 1
6 1) 2l 2 4 2
7 ) 14 23 21 1
8 ) 2 2 1 1 7 2
9 ) 1 2 1 2 2 2
10) 2 1 2 1 2 1
11) 2 1 1 2 0
12) 2 2 2 1 10 3 4
1 3 ) 2 2 1 2 5
15) 1 2 2 2 8 2 1
14) 2 1 2 2 2
16) 2 2 2 2 5 2 4
Total 105 27 21
~
1 , 1st meiotic segregation; 2, 2nd meiotic segregation; A, dyads having a single viable spore; B, dyads having one a/a spore and m o t h e r spore which is either an a-mater or an a-mater; C, dyads having one a/a spore and another, undertermined spore ( a non- mater which is unable to sporulate).
mosome pair was 2 1 % (1 5/7 1, see Table 4). Had the mixed segregation phenotype been the outcome of double crossing over, its frequency should have been much lower than the frequency of detected single crossover events (assuming that the frequency of dou- ble crossovers equals the product of probabilities of single crossovers). We conclude that the differences between the segregation patterns of the centromere-
bracketing markers of these two chromosomes (ZV
and V U ) , and most likely also the patterns of the centromere-linked markers of the other two chromo- somes ( I and XZ), are not due to increased recombi- nation between the markers and the centromeres. Rather, these segregation patterns must have resulted from a mixed segregation of chromosomes, namely some of the chromosomes have segregated reduction- ally, whereas others, within the same cells, have seg- regated equationally.
No aberrant segregations were observed among the diploid dyads: By analyzing colonies of 89 a/a diploid dyads with two viable spores, we followed the segregation of 529 cases of centromere-linked mark- ers (89 x 6 markers - 5 cases in which the segregation of cdc7 was not checked, see Table 4). In 10% of the segregations (53 cases), one diploid colony seemed heterozygous, whereas the other seemed homozygous for a given marker. Such a phenomenon could have resulted from one of three possible events: (1) gene conversion, (2) nondisjunction and ( 3 ) chromosome loss. Gene conversion would give rise to two normal
TABLE 6
Map distances of the genetic markers
Segre-
Ascus type
Chromosome
no.
(no.) (no.)
Interval FD SD PD NPD T ( i n cM\ Map distance
A 1 IV IV VI1 VI1 XI B
IV VI1
ADEI-CENI 148 2 3 TRP1-CEN4 163 8 CEN4-CDC7 31 3 LEUI-CEN7 159 1 3 CEN7-intURA3 66 12 METI4-CENl1 169 2
6.7 2.3 4.4 4.1
7 . 7
0.6
TRP1-CDC7 30 0 4 5.9
LEUI-intURA3 59 1 18 15.4
IV TRPl-CDC7 76 0 3 1.9
VI1 LEUI-intURA? 64 1 16 13.6
Map distances between markers in strain 11 22 and derivative strains. FD, first division segregation; SD, second division segrega- tion; PD, parental ditype; NPD, nonparental ditype; T, tetratype:
A, map distances of the markers from their respective centromeres (tetrad analysis); B, map distances of linked markers (tetrad analysis):
C, map distances of the same markers in dyads (as calculated from the data in Table 4); intURA3, a URA3 marker integrated at a centromere-linked site in the right arm of chromosome V I I .
diploid spores, one heterozygous and one homozygous
Mixed Meiotic Segregation
TABLE 7
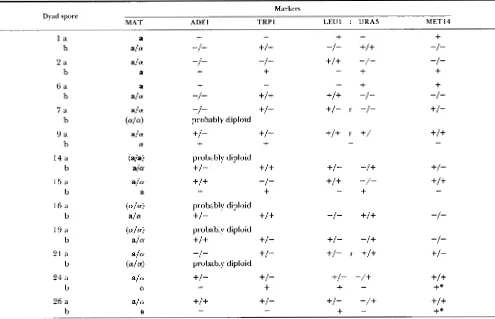
Genotype of dyads having one diploid ala spore and another which is either a or a
Markers
MAT T R P l A D E l LEU1 : URA3 MET14
Dyad spore
l a
b
+
-"I" +I +
+
-
+
-1-
+/+
-I-2 a a/ a -I - -I -
+/+
-/- -I-
b a
+
+
-
+
+
6 a a
+
b a/ a -I- +/ +
-
-
+
+
+/+
-1- -/-7 a a/ CY -I - +I - +/- r -1- +/-
b ( a l 4 probably diploid
9 a a/
b Ly
+I -
+
+I+
-+/+
- r+/
14 a (ala) probably diploid
b ala +/- +I+ +/- -/+ +I -
15 a a/ a
b a
+I+ -I-
+/+
-/--
+
-+
16 a (.I4 probably diploid
b a/ 01 +I - +I+ -1-
+/+
-I -19 a ( 4 4 probably diploid
b a/ a +I + +I
-
+/- -/+ -I-
21 a a/ 01 -I- +/ - +/- r
+/+
.+/-b ( 4 4 probably diploid
24 a a/ 01 +I - +I
-
b
+/-
-/+
01
-
+
+
-+I -t
+*
26 a a/ 01 +I+ +I - +/-
-/+
+I+b a - -
+
-
+*
*, Gene conversion; :, linked genes; r, recombination between linked genes.
are consistent with previous data, showing high meiotic gene conversion rates in cdc51cdc5 diploids (SIMCHEN et al. 198 1).
Dyads with a diploid a/a spore and a haploid spore: In 27 of 6 14 dyads with two viable spores, the colony formed from one spore was a nonmater that could sporulate and the colony from the other spore was either an a or an a-mater. Twelve of these dyads were analyzed genetically (Table 7). All the nonmat- ing colonies were shown by marker segregation in tetrad analysis to be ala diploids.
In order to determine the genotype of the mater colonies we mated them to haploid tester strains. Each colony was mated to two such testers, one proto-
trophic and the other auxotrophic for the centromere- linked markers, and the sporulation products of each
cross were analyzed. Tetrads from crosses to seven of the colonies had four viable spores, and segregation of the markers was as expected of a diploid. T h e original colonies were therefore haploids. Thus in the original 7 (out of 12) dyads, one spore was an ala diploid and the other a mater haploid (either a or a).
Meioses in which diploid and haploid spores were produced within the same ascus have been reported
previously (THOMAS and BOTSTEIN 1986). Those asci
were interpreted to have resulted from a meiosis in which only one of the two first-division products had gone through a second (equational) division. In our analysis, four of the seven diploid-haploid dyads (nos. 1,
2,
6 and 15 in Table7)
could fit into that category (because the diploid appears to be the product of a reductional division). An additional haploid product in each ascus might have degenerated during the sporulation process. Colonies formed by the diploid spores of the other three dyads (nos. 9a, 24a and 26a) exhibited a mixed segregation of chromosomes, or possibly, in dyad no. 26, even an equational segrega- tion (because of a gene-conversion event at M E T 1 4 ) . Note, that the latter case might also have been a mixed segregation that was not detected as such, because segregation patterns of only three out of 16 chromo- somes were determined.Crosses of the other five mater colonies, gave rise to strains with very poor spore viability and most likely resulted from triploid segregations, the triploid hav- ing been generated by the mating of a diploid mater segregant to the haploid tester. If so, both spores of these dyads were diploid, with one of the MAT alleles having undergone gene conversion.
482 G. Sharon and G. Simchen
cies: Although there was no rigid rule as to which of the chromosomes underwent a reductional or an equational segregation in any single event of mixed
meiotic segregation, a summary of many events
showed significant differences between the four chro-
mosomes (Table 4). Chromosome IV (marked by
T R P I ) , for example, had segregated equationally in 52% of the examined cases whereas chromosome X I (marked by MET1 4 ) , had segregated equationally only in 22% of these meioses. T h e differences between the
segregation frequencies of the four chromosomes
were highly significant = 15.85) (SNEDECOR and
COCHRAN 1967). T h e pairwise comparisons of segre- gation frequencies between chromosomes I and X I , IV and X I , VII and X I showed significant differences. T h e difference I-VII was, of course, not significant, whereas the I-IV and IV-VII comparisons were of borderline significance.
Effects of lethality and gene conversion on seg- regation tendencies: Since spore viability was not high (Table 2), it seemed possible that differential lethality affected the results. Selection against certain segre- gation products could account for the observed dif- ferences in segregation frequencies. In order to test this possibility, we have compared chromosome seg- regation patterns between dyads of two categories, those having two viable spores and those having only one viable spore per dyad. In case of selection, dyads of the first category were expected to have reduced frequencies of certain genotypes. Dyads of the second category on the other hand, were expected to have increased frequencies of these same genotypes (be- cause lethality of a spore in a given dyad would with- draw the dyad from the first category and place it in the second one).
Comparison between dyads with two viable spores and those with one viable spore was carried out after necessary adjustments were made (see MATERIALS AND
METHODS). The adjustments were required because, in some cases, information about each meiosis was obtained from analysis of two spores, whereas in oth- ers it was obtained from analysis of only one spore. T h e comparison was carried out as follows. Dyads of the two categories were distributed between different segregation classes (according to the way the markers had segregated), and the numbers of dyads or spores in the different classes were compared. Due to the limited size of the two categories, we performed four tests analyzing three markers in each instead of per- forming one test analyzing four markers (in every test we ignored a different marker). By doing so, we followed 8 (Z3) possible segregation classes in every test (instead of 16, see Table 8), and the number of expected cases in each class was sufficient to be tested statistically. The comparisons showed that the segre- gation differences between two-spore dyads and “one-
spore” dyads were not significant (Table 8) and spore lethality may be considered random. T h e differences in segregation frequencies must therefore reflect a dissimilarity in the segregation tendencies of different chromosomes at the given conditions.
We also asked whether the relatively high rate of gene conversion had an effect on the segregation
tendencies of the marked chromosomes. We per-
formed a similar comparison in which all dyads with two viable spores having gene-conversions or post- meiotic segregations were excluded. T h e differences were still not significant (Table 8). T h e effects of gene conversion and post-meiotic segregation are therefore negligible.
Mixed meiotic segregation in cdcl4 homozygotes: c d c l 4 homozygotes were also sporulated under shift- down conditions as described above. Analysis of 62 dyads of strain 3344 (marked by A D E I , T R P I , LEU1 and M E T l 4 , see MATERIALS AND METHODS), showed
43 to have undergone mixed meiotic segregation for the marked centromeres. T h e tendencies of the four marked chromosomes to segregate equationally were 42% for ADEI, 58% for T R P I , 29% for LEU1 and
27.4% for MET14. These relative tendencies are sim-
ilar to the ones observed for cdc5 homozygotes. We conclude that the mixed segregation phenotype is not unique to cdc5 mutants.
DISCUSSION
Meiosis usually consists of two divisions which follow a single replication of the genome, resulting in a
reduction in the number of chromosomes per nucleus.
Every diploid cell undergoing meiosis gives rise to four haploid nuclei. T h e main difference between the first and the second divisions of meiosis is that, in the first, the two homologous chromosomes segregate from each other while the sister-centromeres are held together and migrate to the same pole, whereas in the second division, the sister-centromeres segregate from each other, pulling the chromatids to opposite poles. When only a single division occurs in meiosis instead of the usual two, two products are obtained which are diploid rather than haploid. Such dyads (two-spored asci) with diploid spores were observed in meiosis of yeast mutants in which only the first (SCHILD and BYERS 1980) or the second meiotic division (KLA-
PHOLZ and ESPOSITO 1980) took place. T h e determi-
nation as to which of the two divisions took place was based on the segregation of centromere-linked mark- ers. In the case we present here, most of the diploid spores resulted from single divisions in which some centromeres segregated reductionally, whereas 0th- ers, in the same cell, segregated equationally.
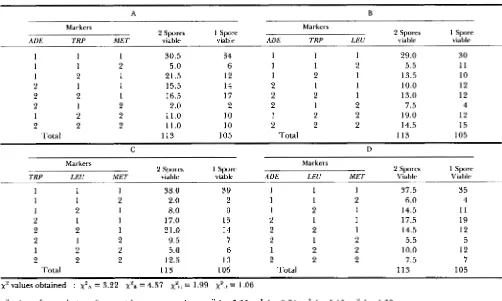
TABLE 8
Distribution of segregants: comparison between dyads having two viable (viab.) spores (sp.) and dyads with one viable spore
A B
Markers Markers
2 Spores 1 Spore
ADE TRP MET viable viable ADE TRP LEU viable viable
2 Spores 1 Spore
1
1 1 2 2 2 1 2
Total
30.5 5.0 21.5 15.5 16.5 2.0 11.0 11.0 113
34 6 12 14 17 2 10 10 105
1 1
1 1
1 2
2 1
2 2 2 1
1 2
2 2
Total
29.0 5.5 13.5 10.0 13.0 7.5 19.0 14.5 113
30 1 1
10
12 12 4 12 15 105
C D
Markers Markers
2 Spores 1 Spore
TRP LEU MET
2 Spores
viable viable ADE LEU MET Viable Viable
1 Spore
1 1
1 1
1 2
2 1
2 2
2 1
1 2 2 2
Total
38.0 2.0 8.0 17.0 21.0 9.5 5.0 12.5 113
39 2 9 15 14 7 6 13 105
1 1
1 1 1 2 2 1 2 2 2 1 1 2 2 2
Total
37.5 6.0 14.5 17.5 14.5 5.5 10.0 7.5 113
35 4 11 19 12 5 12 7 105
x 2 values obtained : x P A = 3.22 x P B = 4.57 xpc = 1.99 xsu = 1.06
x‘ values after exclusion of cases with gene conversion : xSA’ = 5.33
x28’
= 9.64 x2c’ = 5.18 xSu’ = 1.39A-D, four comparison tests. A total of 137 dyads with two viable spores were analyzed: 89 of them had two a/a diploid spores and 48 had only one ala spore. Due to comparison considerations, the latter spores were calculated as “half cases” (see MATERIALS AND METHODS). The total number of two-viable-spores dyads was therefore calculated as 11 3. A total of 105 dyads with one viable spore were analyzed. In each test, the segregation of three of the four markers is shown (in each table the segregation of a different marker is ignored). 1, 1st division segregation; 2, 2nd division segregation. The eight possible segregation-categories are shown at the left side of each test. The right and middle columns of each test show the distribution of dyads having one viable and two viable spores, res ectively, among the different segregation cate ories. A chi-square test was performed for each table (SNEDECOR and COCHRAN 1967), xFA-xSD. The second set of chi- square values, X-A’-X~U’, was obtained after exclusion of cases where one or more of the relevant markers had undergone gene-conversion or postmeiotic segregation (the second set of tables is not shown, only the final results are given). The value of
x 2
for P 5 0.05 (7 d.f.) is14.07. This value is much higher than any of the values obtained.
F
sulted from precocious separation of sister chroma- tids, followed by independent distribution between the two diploid spores, as this would produce a high frequency of aberrant segregations. Our data indicate therefore that every chromosome pair in those dyads underwent a genuine segregation, either reductional
or equational. We term the phenomenon of mixed
reductional and equational chromosome segregation “mixed meiotic segregation.”
In normal meiosis all the chromosomes segregate reductionally in the first division and equationally in the second, pointing to the existence of a mechanism that controls the type of segregation at the cellular level. From the occurrence of “mixed-meiotic segre- gation,’’ we infer that chromosome segregation must also be regulated individually for each pair of homol- ogous chromosomes. Furthermore, each chromosome pair has a unique segregation tendency. Chromosomes
ZV
tend to undergo reductional segregation, whereasthe homologs of chromosome X I tend to go through
equational segregation. Chromosomes
Z
and VZZ have intermediate segregation patterns.T h e differences between these tendencies cannot be explained by high rates of nondisjunction or chro- mosome loss, by increased recombination near the centromeres, or by gene conversion, for the following reasons:
1 . Neither nondisjunction nor chromosome loss was detected in any of the dyads examined.
484 G. Sharon and G. Simchen
tendencies, such as the ones recorded for chromosome pairs
Z
or VZZ.3. Statistical analysis has shown that the effeco of gene conversion on segregation tendencies were neg- ligible (although the frequency of gene conversion events was quite high).
The unique segregation tendencies of different chromosomes show that some factor, specific for each chromosome pair, influences the type of segregation they go through. Chromosome length does not seem to be this factor. Chromosome ZV is the longest yeast chromosome, whereas chromosome
Z
is the shortest. Chromosome X I , with the highest tendency to segre- gate reductionally, has an intermediate length (CARLE and OLSON 1985). Experiments reported in a compan-ion study (SHARON and SIMCHEN 1990) demonstrate
that these putative chromosome-specific factors are located near, or at, the centromeres of the given chromosomes.
T h e roles of the CDCS and CDC14 gene products in nuclear division are unknown. They are required for both mitosis and meiosis because cdc5 and c d c l 4 mutants arrest at high temperatures in mitosis as well as in the first and second divisions of meiosis (SCHILD and BYERS 1980; G. SHARON, unpublished results). One possibility is that the CDCS and CDC14 products take part in the interaction between the centromeres and the spindle fibers, an interaction which is respon- sible for the segregation of each chromosome pair. However, it is possible that the unique chromosome behavior is not directly related to the specific cdc5 or cdcl4 defects, but is rather related to the general transient arrest or slowing down of meiosis in these mutants.
The mixed meiotic segregation behavior is not unique to cdc5 or cdcZ4 mutants. It has also been
observed among $012 and s p o l 3 dyads (KLAPHOLZ
and ESPOSITO 1980), which usually but not always result from failure of the first meiotic division. Fur- thermore, haploid s p o l 3 strains disomic for chromo- some
IZZ
and going through “haploid meiosis,” show a high frequency (around 40%) of the equivalent of “mixed meiotic segregation,” namely the chromo- somes 111 segregate reductionally, whereas the otherchromosomes divide equationally (WAGSTAFF, KLA-
PHOLZ and ESPOSITO 1982; HOLLINGSWORTH and
BYERS 1989). Among the haploid-meiosis products,
many (10-30%) were monosomic or trisomic for chro-
mosome
ZZZ,
suggesting a general inaccurate disjunc- tion of chromosomes. In this respect meiosis in s p o 1 3 mutants appears to be more aberrant than the single- division segregations reported here for cdc5 homozy- gotes.Since no ultrastructural analysis of “mixed segre- gation” has been done so far, we do not have a definite picture as to how many spindle poles are involved in
the phenomenon. It could either be two or four spindle poles. In the former case, different bivalents are oriented in two different ways on one spindle. In the latter case, four spindle poles are present in a common nucleus (as was the phenotype of late ar- rested cells, observed by SCHILD and BYERS 1980). Although we cannot discard the latter possibility, we favor the former for the following reasons: ( 1 ) At the time of the release from the temperature block, the arrested mononucleated cells had one spindle. Since cells were permitted to complete the meiotic process, there is no reason to assume that they were arrested at a second arrest point.
(2)
T h e detection of some cells which were able to undergo an additional division following the “mixed” one (dyads 9, 26 and possibly 24 in Table 7), suggests the existence of only one spindle at the stage of the “mixed” segregation. It also suggests that the reductional and equational segrega- tion of the different chromosomes occur simultane- ously. However, since this observation is based on a very small number of cases, it should be regarded cautiously. It should also be noted that in these dyads, an equational segregation of nine of the chromosomes was followed by another segregation. Pairs that have segregated equationally during the first meiotic divi- sion are expected to have difficulties in segregating again: homologs can not separate efficiently from one another without a first-division machinery. A high rate of aberrant segregation was therefore expected among these chromosomes, but none was found.By micromanipulation, NICKLAS (1977) has trans- ferred chromosomes undergoing meiosis in male gras- shoppers from one spindle to another. He reported that first-division bivalents placed in a second-division spindle continued their reductional separation,
whereas second-division chromosomes in a first-divi- sion spindle continued to divide equationally. This finding further supports the interpretation of single- division meiosis given above, namely that on a single spindle apparatus, some chromosomes segregate re- ductionally while others do so equationally.
We thank DAVID GRANOT for suggesting the possibility of “mixed meiotic segregation,” SHOSHANA KLEIN and YONA KASSIR, for val- uable comnlents on the manuscript, and JEANNE P. MARCOLSKEE
for plasmids. This research was supported by grant 84-00231 from the United States-Israel Binational Science Foundation (BSF), and by grant 1-59-283.3/87 from the German Israeli Foundation for Scientific Research and Development (GIF).
LITERATURE CITED
CARLE, G. F., and M. V. OLSON, 1985 An electrophoretic kary- otype o f yeast. Proc. Natl. Acad. Sci. USA 82: 3756-3760. DAVIDOW, L. S . , L. GOETSCH and B. BYERS, 1980 Preferential
occurrence of non-sister spores in two-spored asci of Saccharo-
myces cerevisiae: evidence for regulation of spore-wall formation
by the spindle pole body. Genetics 94: 581-595.
in yeast. Cold Spring Harbor Symp. Quant. Biol. 43: 1325- 1341.
HICKS, J. B., and I . HERSKOWITZ, 1976 Interconversion of yeast mating types. I. Direct observations of the action of the hom- othalism (HO) gene. Genetics 83: 245-258.
HOLLINGSWORTH, N. M., AND B. BYERS, 1989 H O P I : a yeast meiotic pairing gene. Genetics 121: 445-462.
KASSIR, Y., and G. SIMCHEN, 1985 Mutations leading to expres- sion of the cryptic HMRa locus in the yeast Saccharomyces cerevisiae. Genetics 109: 481-492.
KLAPHOLZ, S., and R. E. ESPOSITO, 1980 Recombination and segregation during the single-division meiosis in spol2-1 and
spoljr-1 diploids. Genetics 96: 589-61 1.
MORTIMER R. K., and D. SCHILD, 1980 Genetic map of Saccharo- myces cerevisiae. Microbiol. Rev. 4 4 5 19-57 1.
NICKLAS, R. B., 1977 Chromosome distribution: experiments on cell hybrids and in vitro. Philos. Trans. R. SOC. Lond. 277:
267-276.
NICOLAS, A,, D. TRECO, N. P. SCHULTES and J. W. SZOSTAK, 1989 An initiation site for meiotic gene conversion in the yeast Saccharomyces cerevisiae. Nature 338: 35-39.
ORR-WEAVER, T. E., J. W. SZOSTAK and R. J. ROTHSTEIN, 1981 Yeast transformation: a model system for the study o f
recombination. Proc. Natl. Acad. Sci. USA 78: 6354-6358. ROTHSTEIN R. J., 1983 One-step gene disruption in yeast. Meth-
ods Enzymol. 101: 202-21 1.
SCHERER, S., and R. W. DAVIS, 1979 Replacement ofchromosome segments with altered DNA sequence constructed in vitro. Proc. Natl. Acad. Sci. USA 76: 4951-4955.
SCHILD, D., and B. BYERS, 1980 Diploid spore formation and other meiotic effects of two cell division cycle mutations of Saccharomyces cerevisiae. Genetics 96: 859-876.
SHARON, G., and G. SIMCHEN, 1990 Centromeric regions control autonomous segregation tendencies in single-division meiosis
o f Saccharomyces cerevisiae. Genetics 125: 487-494.
SHILO, V., G. SIMCHEN and B. SHILO, 1978 Initiation of meiosis in cell cycle initiation mutants of Saccharomyces cerevisiae. Expt. Cell Res. 112: 241-248.
SIMCHEN, G., R. PINON and Y. SALTS, 1972 Sporulation in Saccha- romyces cerevisiae: premeiotic DNA synthesis, readiness and commitment. Expt. Cell. Res. 75: 207-218.
SIMCHEN, G., Y. KASSIR, 0. HORESH-CABBILLY and A. FRIEDMANN, 198 1 Elevated recombination and pairing structures during meiotic arrest in yeast of the nuclear-division mutant cdc5. Mol. Gen. Genet. 184: 46-5 1.
SNEDECOR, G. W., and W . G. COCHRAN, 1967 Statistical Methods,
Ed. 6. Iowa State University Press, Ames, la.
THOMAS, J. H., and D. BOTSTEIN, 1986 A gene required for the separation of chromosomes in the spindle apparatus in yeast. Cell 44: 65-76.
WAGSTAFF, J. E., S. KLAPHOLZ and R. E. ESPOSITO, 1982 Meiosis in haploid yeast. Proc. Natl. Acad. Sci. USA 79: 2986-2990.