hobo Enhancer Trapping Mutagenesis in Drosophila Reveals an
Insertion Specificity Different from
P
Elements
Desmond Smith,* Jay Wohlgemuth,*' Brian R. Calvi,* Ian Franklint4 and William
M.
Gelbart*'
*Department of Cellular and Developmental Biology, The Biological Laboratories, and tMuseum of Comparative Zoology, Harvard University, Cambridge, Massachusetts 02138
Manuscript received March 3 1, 1993 Accepted for publication August 1 1, 1993
ABSTRACT
P element enhancer trapping has become an indispensable tool in the analysis of the Drosophila
melanogaster genome. However, there is great variation in the mutability of loci by these elements
such that some loci are relatively refractory to insertion. We have developed the hobo transposable element for use in enhancer trapping and we describe the results of a hobo enhancer trap screen. In addition, we present evidence that a hobo enhancer trap element has a pattern of insertion into the genome that is different from the distribution of P elements in the available database. Hence, hobo insertion may facilitate access to genes resistant to P element insertion.
T
HE hobo and P transposable elements are both members of a family of transposons with termi- nal inverted repeats which probably transpose via DNA intermediates [for reviews of P elements see Engels (1989) and Rio (1 990); for reviews of hobo elements see BLACKMAN and GELBART (1989) and Gelbart and Blackman (1989)l. However, despite the similarities between the elements, there are also some differences between them. There is little obvious sim- ilarity between the 8-bp host genomic sequences du- plicated upon insertion of hobo and P elements, with the possible exception of the last two nucleotides, which may show a preference for the sequence AC (STRECK, MACGAFFEY and BECKENDORF 1986). In ad- dition, there is no homology between the P transpos- ase and the putative hobo transposase (CALVI et al.199 1). For prokaryotic inverted repeat transposons it is well established that the structure of the transposase affects the DNA sequences in which the transposon inserts (PLASTERK 1990).
T h e advent of single P element insertional muta- genesis has revolutionized Drosophila molecular ge- netics (COOLEY, BERG and SPRADLING 1988; COOLEY, KELLEY and SPRADLING 1988; BERG and SPRADLING 1991). In this technique, just one marked P element is used to mutagenize the genome and the subsequent molecular analysis of the resulting mutants is thereby greatly simplified in comparison to previous ap- proaches using P-M hybrid dysgenesis in which mul- tiple unmarked elements were mobilized. This ap- proach has been usefully extended by the enhancer
Road, Palo Alto, California 94304.
Blacktown, New South Wales 2148, Australia.
' Present address: Stanford University School of Medicine, 851 Welch
* Present address: CSIRO, Division of Animal Production, P.O. Box 239,
'
TO whom correspondence should be addressed.Genetics 135: 1063-1076 (December, 1993)
trap technique in which a reporter gene driven by a weak promoter is placed within the P element (O'KANE and GEHRING 1987; BELLEN et al. 1989; BIER et al. 1989; WILSON et al. 1989). T h e weak promoter is susceptible to the influence of adjacent genomic enhancers and the resulting pattern of re- porter gene expression may reveal the pattern of expression of the gene into which the P element has landed. Tens of thousands of single P element en- hancer trap lines have been generated (O'KANE and GEHRING 1987; BELLEN et al. 1989; BIER et al. 1989; WILSON et al. 1989). However, it is unlikely that a complete sampling of the genome will be achieved using P elements alone, since genes display a wide variation in their receptivity to insertion (KIDWELL
1986; ENGELS 1989). Some genes are hot spots for P element insertion, whereas others are cold spots and are therefore relatively refractory to insertion. One example of an apparent cold spot is the ADH gene, for which 10 million flies from a P-M hybrid dysgenic cross were screened without successfully obtaining a P element insertion (KIDWELL 1987). It has been estimated that roughly 50% of Drosophila genes are mutable by P-M hybrid dysgenesis (KIDWELL 1986) and it is thought that a similar proportion of genes is mutable using single P element mutagenesis (COOLEY, KELLEY and SPRADLING 1988). These observations suggest that many genes will not be readily identified using P element mutagenesis alone.
Hsp7O
3' UT
FIGURE 1.-The hobo enhancer trap H[pHl.u12]. Km', kanamyrin resistance: Ori, plasnlid origin of replication: larZ, @-galactosidase gene: 3' U T . 3'-untrans-
A'sil Hind111
' I
H[pHLw2]
I
select w+, cy+
&
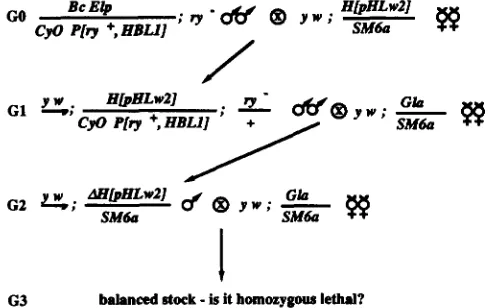
map, balance new insertions FIGURE 2.-The genetic scheme by which the hobo enhancer trap was mobilized from the X chromosome to the autosomes.
lated region. Restriction enzyme sites useful for plasmid rescue are shown.
TABLE 1
Jump rates of hobo insertions in the X chromosome
chromosome Donor
A B
c
D
E A + C
Cytological
location of No. of G I No.
oi
Jump rare' hobo crosses' jumps (%)1 E l . 2 157 6 4
7D14-17 59 1 5
17D 204 20 10
20C 49 2 4
ND' 50 0 0
3E1.2
+
17D 195 32 16and compared the pattern of insertion of the hobo enhancer trap into the genome with that of reported P elements in order to address whether the two ele- ments preferentially insert into different regions.
MATERIALS A N D METHODS
Construction of pHLw2: Molecular biology techniques were performed as previously described (SAMBROOK, FRITSCH and MANIATIS 1989). The EcoRI site at nucleotide 1 159 of pHFLl (CALVI et al. 199 1) was disabled by digestion with EcoRl and filling in with Klenow. The resulting plasmid was digested with EcoR1, the ends filled in using Klenow and the D N A digested with HindIII. The resulting 6.2-kb fragment was ligated to the 4.8-kb KpnI-Hind111 fragment from pHZ5OPL (HIROMI and GEHRING 1987), the Kpnl terminus having been polished using T 4 DNA polymerase. The 6.5-kb Bsu361-XbaI fragment from this plasmid was ligated to the 5.9-kb Bsu36I-XbaI fragment from pFZ (MLODZIK and HIROMI 1992). T h e resulting plasmid was digested with XbaI and ligated to the 4.2-kb SpeI fragment from pcahsneo-miniwhite (V. PIRROTTA, personal commu- nication) thus generating pHLw2. This plasmid contains 0.3 kb of upstream sequences from a Hsp70 gene at cytological band 87C1 linked upstream of the lac2 gene. The lac2 gene is driven by the Hsp70 T A T A box which acts as a weak promoter but lacks the heat shock-inducible sequences. Trailer sequences (0.9 kb) from a Hsp70 gene at cytological band 87A7 are attached downstream of the lac2 gene. pHLw2 also contains the mini-white gene (PIRO-ITA, STELLER and BOZZETTI 1985) and pHSS7 (SIEFFERT et al. 1986) which can be used for plasmid rescue (PIROTTA 1986). Another plasmid, pHLr 1, consisted of the lac2 gene fused in frame
Number of fertile crosses.
Jumps were defined following COOLEY, BERG and SPRADLING
( 1 988) as the number of G I vials containing at least one fertile up+ son that does not contain P[ry+, H B L I ] .
' Jump rate was defined following COOLEY. BERG and SPRADLING ( 1 388) as the percent of jumps/fertile G I cross.
ND = not determined.
to the putative hobo transposase (CALVI et al. 199 l), such that the hobo promoter would act as an enhancer trap, but the construct did not appear to be effective in this regard (D. SMITH, B. R. CALVI and W. M. GELRART, unpublished data).
Genetic strains: All mutations are described in LINDSLEY and ZIMM (1992). Unless otherwise indicated all strains are E, that is, devoid of hobo elements (STRECK, MACCAFFEY and BECKENDORF 1986; B. R. CALVI and W. M. GELRART, unpublished data).
Production of transgenic flies: y w~~~~~ embryos were injected as described (SPRADLING 1986) with pHLwr2 DNA (0.6 mg ml-I) together with pHBLl (0.15 mg r n 1 - I ) helper DNA (CALVI et al. 1991). Go flies were mated singly and transgenic flies selected as w+ G I progeny. Insertions were
mapped and balanced using the strains y w ~GlalSM6a ~ ~ ~ ~ ; and y wh7"'; D' gllTM3, Sb Ser.
Transposition crosses: A stable source of hobo transpos- ase, P[ry+, HBLI], on the Cy0 chromosome (CALVI et al.
hobo
TABLE 2
1065
Mode of production of the hobo enhancer trap lines
No. of lines mapping to chromosomes X, Donor element No. of lines 2 or 3 analyzed by in situ hybridization Injection' 30 (including 2 on X chromosome) 16 (including 2 on X chromosome)
A 195 59
C 234 68
A and C 104 12
Miscellaneousb 49 (including 6 on X chromosome) 7 (including 3 on X chromosome)
Total lines 6 12 (including 8 on X chromosome) 162 (including 5 on X chromosome)
Approximately 1,000 embryos were injected and 320 fertile GO adults were obtained from these embryos.
These lines were produced as a result of mobilization of hobo insertions from the autosomes. These mobilizations were performed in order to obtain further X insertions for transposition to the autosomes as described in RESULTS.
anced using the strains y w67c23; GlalSM6a and y w67c23; D3 gl/ TM3, Sb Ser.
Synthesis of a recombinant X chromosome containing two hobo enhancer trap insertions: In order to increase the jump rate, a recombinant X chromosome containing two
insertions of the hobo enhancer trap (insertions A and C, see RESULTS) was synthesized using the fact that the mini-white gene confers a less than wild type level of w+ eye color upon the flies (PIROTTA, STELLER and BOZZETTI 1985). This means that flies with two copies of a transposon bearing the
mini-white gene possess a darker w+ eye color than flies bearing one copy. The fact that the recombinant chromo- some contains two transposons was confirmed by in situ
hybridization.
Embryonic @-galactosidase staining: Embryos were stained for &galactosidase activity (BELLEN et al. 1989; BIER
et al. 1989) and with anti-@-galactosidase antibodies as de- scribed (BIER et al. 1989).
In situ hybridization: Chromosomal in situ hybridization was performed as described (ENGELS et al. 1986) using pHLw2. In addition to the hobo enhancer trap, this probe hybridized positively to the white gene at 3C2 and with variable strength to the Hsp70 genes at 87A7 and 87C1. For homozy ous lethal hobo insertions on the second chro- mosome, y W ' ~ ' ~ ' ; H [ P H L W ~ ] / S M ~ ~ males were mated withy
w67c23;Bc Elp/CyO virgin females. Cy+ males resulting from this cross were mated with y w67c23 virgin females and Bc+ larvae resulting from this cross were used for chromosomal
in situ hybridization. For homoz ous lethal hobo insertions on the third chromosome, y w6'2';H[pHLw2]/TM3, Sb Ser
males were mated with ru h th st cu sr e' Pr ca/TM6B, Tb
virgin females. Sb+, Pr+ males resulting from this cross were mated withy w~~~~~ virgin females and Tb+ larvae resulting from this cross were used for chromosomal in situ hybridi- zation.
RESULTS
Jump rates of H[pHLw2]: Five separate X-linked insertions of the hobo enhancer trap H[pHLw2] (Fig- ure 1) were assayed for their ability to transpose to the autosomes using the stable source of hobo trans- posase P[q', HBLZ ] (CALVI et al. 1991; B.
R.
CALVI and W. M. GELBART, unpublished data). T h e genetic crosses employed are shown in Figure2,
and the jump rates of the lines are shown in Table 1. Line A was derived from injection. Lines B to E were derived by jumping hobo enhancer traps on chromosome 3 re-sulting from the injection experiment onto the X chromosome. In order to increase the jump rate, a recombinant X chromosome containing both inser- tions A and C was synthesized and the jump rate of this chromosome was approximately equal to the com- bined jump rate of the chromosomes containing the single insertions. Most of the lines obtained in the screen were created using insertions A, C, or the A,
C recombinant X chromosome (Table
2).
Embryonic staining patterns: A total of 612 lines were established and assayed for embryonic P-galac- tosidase expression. Eighty percent of the lines dis- played staining. However, many of these aaining pat- terns were either uniform
(7%)
or were repeatedly observed patterns (46%). T h e two repeatedly ob- served patterns were staining of the dorsal longitudi- nal trunks of the tracheae from stage 15 onward and staining of the proventriculus from stage 16 onward. These repeatedly observed patterns were presumed to represent an intrinsic property of the enhancer construct itself. Such a phenomenon has been ob- served with a P element enhancer trap (BELLEN et al.1989) although the repeatedly observed pattern was different. Approximately 30% (1 8 1/6 12) of the hobo
lines were judged to display specific staining. In con- trast, two P element enhancer traps showed specific staining in 65% of lines (BELLEN et al. 1989; BIER et
al. 1989). T h e lower frequency of specific staining observed for the hobo enhancer trap may be due to the relatively large distance (1.0 kb) from the weak promoter to the 3' terminus of the element. By com- parison, the P element enhancer traps employed the
P element's weak promoter which is adjacent to the
5' terminus of the element. P element enhancer traps with weak promoters situated some distance internal to the termini of the element show lower frequencies of specific staining than those which employ the P
A
BC
E
G
D
F
H
in the nervous system (87/181 = 48%) or in the gut (66/181 = 37%). Fewer showed staining in meso- dermal derivatives (1 2/181 = 7%). This profile of staining frequencies is very similar to that observed with P elements. T h e number of lines showing staining in various tissues is shown in Table 3. T h e P-galacto- sidase gene in the hobo enhancer trap had no nuclear localization signal and consequently staining was ob- served both in the nucleus and cytoplasm.
Pattern of insertion of the hobo enhancer trap into the genome: T h e positions of hobo enhancer trap insertions were determined by chromosomal in situ hybridization for 157 lines mapping to the second or third chromosomes (Table 2 and Figure 7). Apart from the exceptions described below, 93% (132/142) of the hobo enhancer trap lines proved to contain a single element.
There appeared to be no obvious differences be- tween the patterns of insertions with regard to the origin of the donor element. This is similar to findings described for P elements (BERG and SPRADLING 199 1).
However, a disproportionately large number of hobo
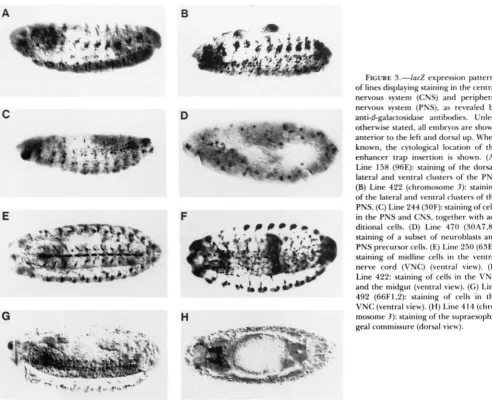
FIGURE 3.-lacZ expression patterns of lines displaying staining in the central nervous system (CNS) and peripheral nervous system (PNS), as revealed by anti-@-galactosidase antibodies. Unless otherwise stated, all embryos are shown anterior to the left and dorsal up. When known, the cytological location of the enhancer trap insertion is shown. (A)
Line 158 (96E): staining of the dorsal, lateral and ventral clusters of the PNS
(B) Line 422 (chromosome 3): staining of the lateral and ventral clusters of the PNS. (C) Line 244 (30F): staining o f cells in the PNS and CNS, together with ad- ditional cells. (D) Line 470 (30A7,8): staining of a subset of neuroblasts and PNS precursor cells. (E) Line 250 (63E): staining of midline cells in the ventral nerve cord (VNC) (ventral view). (F) Line 422: staining of cells in the VNC and the midgut (ventral view). ( G ) Line 492 (66F1,2): staining of cells in the V N C (ventral view). (H) Line 4 14 (chro- mosome 3): staining of the supraesopha- geal commissure (dorsal view).
A
hobo
B
E
F
A
.
, . ..C
E
D
\
QB
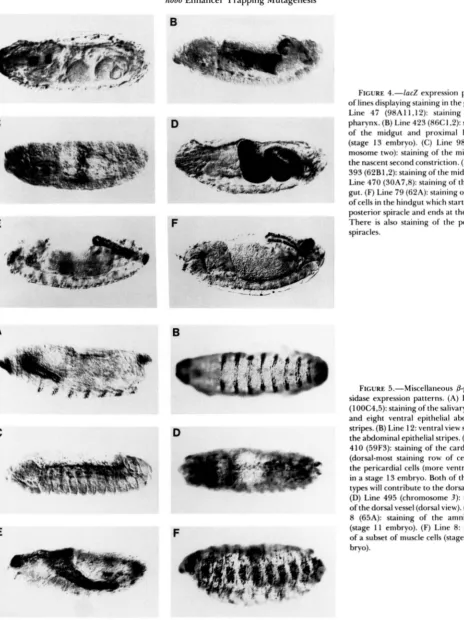
FIGURE 4.-lacZ expression patterns of lines displaying staining in the gut. (A) Line 47 (98A11 , I 2): staining of the pharynx. (B) Line 423 (86C1.2): staining
of the midgut and proximal hindgut (stage 13 embryo). (C) Line 98 (chro- mosome two): staining of the midgut at the nascent second constriction. (D) Line 393 (62B1.2): stainingofthe midgut. (E)
Line 470 (30A7,S): staining of the hind- gut. (F) Line 79 (62A): staining of a loop of cells in the hindgut which starts at one posterior spiracle and ends at the other. There is also staining of the posterior spiracles.
FIGURE 5.-Miscellaneous 0-galacto- sidase expression patterns. (A) Line 12 (100C4.5): staining of the salivary glands and eight ventral epithelial abdominal stripes. (B) Line 12: ventral view showing the abdominal epithelial stripes. (C) Line 410 (5933): staining of the cardial cells (dorsal-most staining row of cells) and the pericardial cells (more ventral cells) in a stage 13 embryo. Both of these cell t y p e s will contribute to the dorsal vessel. (D) Line 495 (chromosome 3): staining of the dorsal vessel (dorsal view). (E) Line 8 (65A): staining of the amnioserosa (stage 11 embryo). (F) Line 8: staining
of a subset of muscle cells (stage 16 em- bryo).
A
B
FIGURE 6.-Further j3-galactosidase expression patterns. (A) Line 282 (55C):
staining of the epidermis at the interseg-
E
F
mental furrrows and staining of the prox- imal part of the hindguL. (B) Line 153 (99A): staining of the dorsal part of the epidermis at the boundary with the am- nioserosa (stage I4 embryo). (C) Line 5 10
(69Dl-3): staining of the epidermis at the intersegmental furrows. (D) Line 146 (79D1,2): stainingof the ring gland (dorsal view). (E) Line 65 (94A): staining of the gonads and the pharynx (dorsal view). (F) Line 33 (89A): staining of seven stripes of cells in an extended germ band embryo similar to a pair rule pattern. This pattern is first seen in the blastoderm and after germ band extension is completed evolves
*."L into a 14 stripe expression pattern remi-
\;..{ :': .; ~~ +.ts %" @"* 3, ,+"<'i."
+.;.
nixent of the segment polarity genes.
.. 7 I
,,
;>..-+,-ir.',
1 ' .
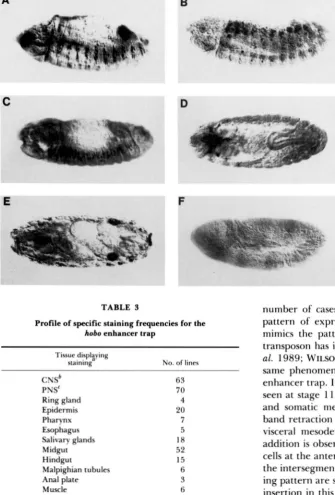
TABLE 3 number of cases where it has been shown that the
Profile of specific staining frequencies for the hobo enhancer trap
Tissue displaying
staining' No. of lines CNSb
PNSC Ring gland Epidermis Pharynx Esophagus Salivary glands Midgut Hindgut
Malpighian tubules Anal plate Muscle
Visceral mesoderm Heart
Amnioserosa
63
70 4 20 7 5 18
52 15 6 3 6
10
7 6
pattern of expression of the enhancer trap closely mimics the pattern of the gene next to which the transposon has inserted (BIER et al. 1989; WILSON et al. 1989; WILSON, BELLEN and GEHRINC 1990). T h e same phenomenon appears to be true for the hobo enhancer trap. In one example, line 8, staining is first seen at stage 11, in the amnioserosa and the visceral and somatic mesoderm. In later stages after germ band retraction is completed, staining persists in the visceral mesoderm and a subset of muscles and in addition is observed in the epidermis in two to three cells at the anterior part of each segment adjacent to the intersegmental groove. Some aspects of this stain- ing pattern are shown in Figure 3, E and F. The hobo insertion in this line is situated at 65A. T h e laminin A gene is known to be in this region, at 65A10-11 (MONTELL and GOODMAN 1988) and is a candidate for Oenocytes 4 the locus identified by this enhancer trap. T h e pattern Posterior spiracles 14 of expression of the laminin A gene (MONTELL and
Gonads 2 GOODMAN
1989) is very similar to the hobo enhancer
'
Lines may be included in more than one category of specifically trap. T h e gene is first strongly expressed in the sta'nin tissue.bCNS g = central nervous system. oderm in extended germ band embryos. The gene PNS = peripheral nervous system. then continues to be most strongly expressed in the somatic mesoderm which forms the body wall muscles
preach
might be useful for mutagenesis of a conven- and the visceral mesoderm, and in addition is ex- iently sized segment of the genome. pressed in the epidermis.rrl
t
8
k
%
e
9:
a
3
I
e
8
E
a 0
Y
h
A 0
f
Y
L
0
Y
w
-
d
3
r
U
cy
t
Q
a
1
Va
8
E
0
b
P
A
I
8
0f
d
.
I
Id
L
0
w
a
s
r
S
A
0 s
kn
.o
b U
y)
.B
$ 3
&
b .$
" 3
w
In
.E
v)(.I
.e
m x
e a =
2 : Y
ut8
z
3
z
b E
e
b
; $
3 3
8 s
3 9
g 5
d - 2
- 8
P
8 .
u t 9
* E
3 s
-0s
.E
"s
o r
-4
o L
n 8
e a 5
3
o B
4 :
a "
5
8
.s
e a S
t - 2
w .fi
- I
8 G
q
c3g
v) .- n
3
Fis
Y a1
bP
3
I
8
i
A 0
e
v) v)
0
4
e
Q
1
3
w Pg
.-)
c1 c1
8
.
P
I3
k
A
70 75 80 85 90 95 100 105 110 115 120
I I I I I I I I
I
1
I I I I I I I II
dpplR* ORS
dpp transcript A 9-3'
=%
hobo enhancertrap
B
C
ment in the germ band extended embryo. After germ band retraction, staining is seen in the thorax and abdomen in segmentally repeated epidermal stripes which are one cell wide and are situated at the anterior border of each segment. These stripes are present both dorsally and ventrally in the abdomen, but are present only dorsally in the thorax. Staining is also seen in the posterior spiracles and in a loop of cells in the hindgut which extends from one posterior spiracle to the other. The staining pattern in the hindgut and posterior spiracles is shown in Figure 2F. T h e hobo enhancer trap staining pattern is very similar to the staining pattern shown by a P element enhancer trap at 62A in the gene rhomboid (BIER, JAN and JAN 1990).
In this case it has been shown that the P element enhancer trap staining pattern recapitulates part of the later embryonic expression pattern of the gene beginning at germ band extension and continuing to later stages. T h e hobo insertion is homozygous viable but confers a recessive rough eye phenotype upon the flies. I t may be that the hobo element is inserted in a gene adjacent to rhomboid and that the insertion into this gene is responsible for the eye phenotype, but that the hobo enhancer trap is nevertheless responding to enhancer elements in rhomboid. Alternatively, the eye phenotype may be an undescribed aspect of the genetics of rhomboid.
We have examined one case in some detail. T h e
hobo enhancer trap of line 151 was inserted at 22F
which is where the d p p gene is located. We used plasmid rescue (PIROTTA 1986) to isolate genomic DNA flanking the transposable element. Southern blot analysis using this DNA as a probe was employed to show that the transposon had inserted into the disk
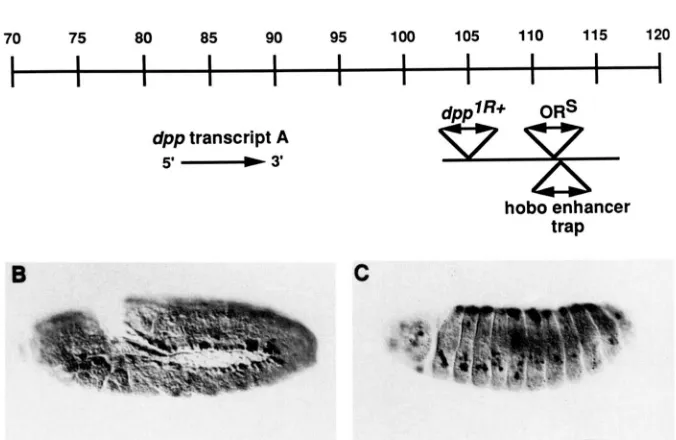
FIGURE 9.-A line containing a hobo en- hancer trap inserted in the disk region of the dpp gene recapitulates part of the expression pattern of the gene. (A) The structure of the dpp gene. A detailed de- scription of the gene can be found in ST.
JOHNSTON ef al. ( 1 990). The co-ordinates of
the gene (kb) and the extent of a major transcript are shown. The disk region is a large 3'-cis-regulatory region. The positions of two previously mapped independent hobo insertions into the dpp gene are shown, as is the position of the hobo enhancer trap of line 15 1 . The direction of transcription of the lacZ gene in the hobo enhancer trap is from left to right. (B) Staining displayed by line 151 at the beginning of germ band retraction. (C) Staining at stage 14. Staining can be seen to occur in the dorsal epidermis, the cephalic and thoracic imaginal disk pri- mordia and the peripheral nervous system.
region of the d p p gene by hybridization to phage DNA from the region (ST. JOHNSTON et al. 1990).
T h e position of the hobo insertion is shown in Figure
9. Interestingly, the enhancer trap had inserted close to the sites of insertion of two previously mapped independent hobo insertions into the gene (GELBART and BLACKMAN 1989). T h e enhancer trap staining pattern faithfully reproduced part of the later embry- onic staining pattern of the d p p gene but did not mirror the earlier dorsal ectodermal expression pat- terns (ST. JOHNSTON and GELBART 1987; RAY et al.
1991). Previous studies (BLACKMAN et al. 199 1) have
shown that the disk region consists of 3'-regulatory sequences which regulate the d p p gene in cis. The BS3.0 DNA fragment extends from 106.9 to 116.9
in the disk region and encompasses the site of insertion of the hobo enhancer trap. When this DNA fragment was placed next to a B-galactosidase reporter gene and introduced into the
fly
genome, part of the embryonicd p p expression was reproduced (BLACKMAN et al.
199 1) and the pattern of expression conferred by this
fragment appears identical to that of the hobo en- hancer trap. T h e BS3.0 fragment also confers an expression pattern upon a reporter gene in imaginal disks which represents part of the d p p expression pattern. T h e hobo enhancer trap expression pattern in disks is similar to the pattern conferred by BS3.0 (data not shown).
P[ry+, HBLI] can be used to make mutations in a
gene next to a homozygous wild-type hobo enhancer
hobo Enhancer Trapping Mutagenesis 1071
6 3 balanced stock
-
is it homozygous lethal?FIGURE 10.-Genetic crosses employed to produce mutations in the dpp gene by creating imprecise excisions of the hobo enhancer trap in line 151. Excisions of H[pHLw2] are denoted by LW
[pHLwZ].
generate mutations in the dpp gene using line 151
which is a homozygous viable insertion. The genetic crosses employed are shown in Figure 10. Males ob- tained in the G2 generation with a different shade of w+ eye color than heterozygotes from the parental line 15 1 were used to produce stocks balanced for the second chromosome. w- flies presumably represent removal of the hobo insertion, whereas those flies which possess a darker shade of w+ eye color than the parental line could represent a more complex event which could include, for example, a local jump. Of 72
fertile GI crosses that were set up, 6 gave rise to progeny with an altered shade of w+ eye color. One set of exceptional progeny consisted of w- sons and the other five consisted of sons with a darker shade of w+ eye color than the parental line. Two of the bal- anced stocks established from these flies were homo- zygous lethal. One was w- (line 151 event A) and the other had a darker shade of w+ eye color than the parental line (line 151 event B). These stocks were tested in trans to three d p p disk alleles: dppd19, dppd-blk
and dppd-ho (ST. JOHNSTON et al. 1990). Each insertion derivative failed to complement one of the alleles tested. Line 151 event A displayed the heldout phe- notype in trans to dppd-ho. Line 151 event B had reduced wings in trans to dppd19 and this phenotype is characteristic of d p p class I1 disk mutations.
Homozygous lethality: Of the 6 12 lines that were created, 503 were localized to a chromosome. Eight mapped to the X chromosome, 206 to the second chromosome and 28 1 to the third chromosome. Eight lines did not map to either the X , second or third chromosomes and these were presumed to map to the fourth chromosome or represent double insertions of the transposable element onto two different chromo- somes. Of the lines mapping to the second and third chromosomes, 17% (35/206) and 28% (78/281), re- spectively, possessed a recessive lethal phenotype. We do not know why the rate of recessive lethal pheno-
F2 Y w ;
+
TM3. SbY w '
H[PHLw21+
heterozygous eye doryw ; H[PHLw21 heterozygous eye color TM3, Sb
YW ; H[PHLW21 homozygous eye color HlpHLwZ]
-
does this class exist?FIGURE 1 I.-Genetic crosses employed to obtain the meiotic recombination distances between the hobo insertions and the reces- sive lethal phenotypes.
types is higher for inserts on the third chromosome compared to the second chromosome. In light of the experiments described below, it seems unlikely that this is due to undetected lethal mutations segregating on the third chromosome. The average rate of reces- sive lethal phenotypes on the second and third chro- mosomes is 23% (1 13/487). There was no correlation between whether a line displayed specific staining and whether it was a homozygous lethal insertion.
As mentioned above, it cannot be assumed that the homozygous lethality of a line is due to the enhancer trap insertion. For example, the screen was not per- formed in an isogenized background and there might be undetected lethal mutations segregating. In addi- tion, it could be imagined that the source of hobo
transposase might cause mutations that are not asso- ciated with the insertion of a w+ enhancer trap. For example, in the case of P elements, BERG and SPRA- DLING (1991) speculated that some mutations may result from insertion followed by immediate imprecise excision of an element. The same speculation may be true for hobo elements.
What proportion of the homozygous lethal hobo lines are due to the transposon? Two approaches were used to answer this question, employing hobo
G4 b t b c a r d s i o a d a b k i n b w u t o t h t ~ b o b o i n m t i o n ? FIGURE 12,"Genetic crosses employed to obtain revertants of the recessive lethal phenotype by excision of the hobo insertions. Excisions of H[pHLwZ] are denoted by AH[pHLw2] and were recognized by loss of the mini-white marker leading to a w- eye color in the Gs.
TABLE 4
Reverting recessive lethal phenotypes by excision of the hobo
enhancer trap
~ ~ ~~ ~~~
No. of independent NO. of Gp excisions viable over No. of
I+
Yielding the original hobob
Line crosses excisions insertion' 42 37
128 45
1 58d
172 50 178 47 189 31 190 41 314 35 339 46 40 1 45 408 45 422 48
423 42 536 37 549 40
6 8
2 1
0 3 2 1 0 4 1 6 1 4 2 2
0 4 2 1
3 2 0
3 0 5 0 3 1 1
the w+ eye color produced by the mini-white marker gene becomes darker as the
fly
ages, the F2 generation were scored every 2 days in order to minimize varia- tion due to this cause. For each line, at least 1,500 F:! flies were scored. Failure to observe individuals in the F:! generation that were homozygous for the hoboenhancer trap would imply that the recessive lethal phenotype maps to within 0.8 cM
(x2
= 4, 1 d.f., P<
0.05) of the hobo insertion and hence that the insertion event is probably responsible for the phenotype. Con- firmation that F:! flies were homozygous for the hoboenhancer trap was obtained by outcrossing represent- ative individuals toy w67c23 flies and observing that all the offspring were w+. For 17 out of 20 lines examined (17/20 = 85%) it was not possible to separate by recombination the hobo insertion from the recessive lethal phenotype. This suggests that for the majority of recessive lethal hobo insertions that the phenotype is due to the transposable element.
The second approach employed the stable source of transposase P[ry+, H B L l ] to excise the hobo en- hancer trap using the genetic crosses shown in Figure
12. If the transposable element is responsible for the recessive lethal phenotype, then the phenotype may be revertable by excision of the element. Excisions were recognized by loss of the mini-white marker lead- ing to a w- eye color in the Gs. Fifteen lines were examined using this approach and the results are shown in Table 4. Thirteen lines yielded excisions and of these, nine were rendered viable over the original lethal hobo insertion. Thus, this approach again suggests that for the majority of lethal hobo
insertions (9/13 = 69%), the lethality is due to the insertion. The evidence provided by both approaches makes it seem likely that most of the recessive lethal mutations are caused by the hobo insertion.
a Number of fertile Gz crosses.
Number of crosses producing at least one son with an excision. Number of crosses producing at least one son with an excision that is viable over the original hobo insertion. Sometimes sibling males from the same cross were independently tested. These males could represent the same pre-meiotic event. They gave the same result in all cases.
This line has 5% escapers. The escapers have abnormal mor- phology with downturned wings and double bristles emerging from single sockets. This line was tested by directly crossing 10 GP males
en masse to tester females containing the hobo insertion and screen- ing 750 progeny for males lacking the balancer chromosome or for males containing w- excisions over balancer. The second class of male was then tested by crossing them singly to females containing the hobo insertion. The homozygous revertants display normal morphology.
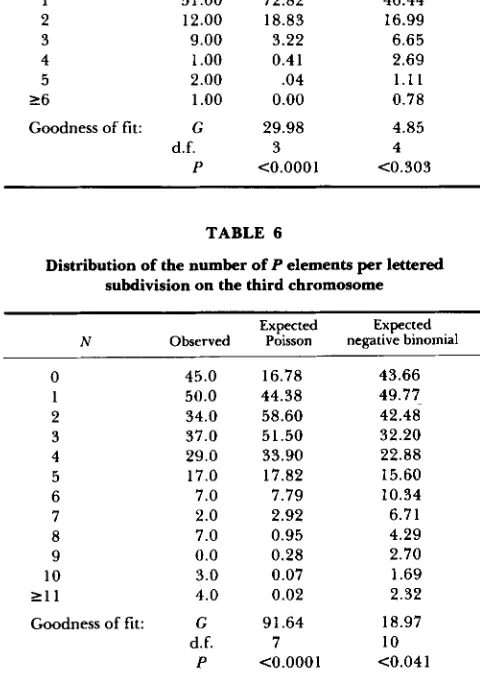
Comparison of hobo and P insertion patterns on chromosome 3: The 122 hobo insertions localized on chromosome 3 were compared with a compilation of single P element insertion sites (MERRIAM et al. 199 1) using lettered subdivisions as the unit of comparison.
The hobo insertions were derived from 1 18 lines map-
ping to chromosome 3. Entries in the P element compilation were only included in the analysis if they were localized within at most two lettered subdivi- sions. The small proportion of entries localized for example as 93A/B were treated as being localized to 93A for the purpose of the analysis. There were a total of 6 19 P element insertions used for the analysis. Table 5 shows the distribution of the number of
TABLE 7
TABLE 5
Distribution of the number of hobo elements per lettered subdivision on the third chromosome
Expected Expected N Observed Poisson negative binomial 0 1 2 3 4 5 2 6
Goodness of fit:
159.00 51.00 12.00 9.00 1
.oo
2.00 1.oo
G P d.f. 139.68 72.82 18.83 3.22 0.41 .04 0.00 29.98 <0.0001 3 160.33 46.44 16.99 6.65 2.69 1 . 1 1 0.78
4.85 4 <0.303
TABLE 6
Distribution of the number of P elements per lettered subdivision on the third chromosome
Expected Expected N Observed Poisson negative binomial
0 45.0
1 50.0
2 34.0
3 37.0
4 29.0
5 17.0 6 7.0 7 2.0 8 7.0
9 0.0
10 3.0
2 1 1 4 .0
Goodness of fit: G d.f. P 16.78 44.38 58.60 51.50 33.90 17.82 7.79 2.92 0.95 0.28 0.07 0.02 91.64 <0.0001 7 43.66 42.48 32.20 22.88 15.60 10.34 6.71 4.29 2.70 1.69 2.32 18.97 10 <0.041 49.77-
tions (Table 6) is not Poisson but shows a better fit to a negative binomial, giving some confidence that the
P and hobo samples are comparable. There is more subdivision to subdivision variability in the P sample than in the hobo sample; this may be due to the heterogeneous nature of the sample or to a greater instrinsic variability in P insertion sites.
Table
7
shows the joint distribution of P and hobo elements for each subdivision. A contingencyx 2
test (ROHLF and SOKAL 1981; SOKAL and ROHLF 1981) was performed on a condensed version of this table, pooling classes with two or more hobo elements and six or more P elements. T h e condensed table has a sufficiently high expectation in each cell to carry out the test. T h e test examines whether there is any correlation between the likelihood of lettered subdi- visions being hit by P or hobo elements and could, for example, reach significance if hot spots for P and hobo insertion tended to be the same. T h e null hypothesis is that there is no tendency for P and hobo elementsAn RXC table comparing the occupancy of lettered subdivisions for P and hobo elements on the third chromosome
hobo occupancy
Poccupancy 0 1 2 3 4 5 6 Total 0 1 2 3 4 5 6 7 8 9 10 1 1 12 13 Total
35 7 1 2 0 0 0 45
37 10 2 0 0 0 1 50
21 7 2 3 1 0 0 34
25 9 2 1 0 0 0 37
1 5 1 0 3 1 0 0 0 29
12 3 0 1 0 1 0 17
4 2 0 1 0 0 0 7
2 0 0 0 0 0 0 2
3 1 2 0 0 1 0 7
0 0 0 0 0 0 0 0
2 1 0 0 0 0 0 3
2 0 0 0 0 0 0 2
0 1 0 0 0 0 0 1
1 0 0 0 0 0 0 1
159 51 12 9 1 2 1 235
to be found in the same subdivisions. T h e test was not significant
(x2
= 10.75, 12 d.f., P<
0.55) and hence there is no evidence of any association between the insertion sites of the two elements. In order to remove any biases that may have arisen in the sample of Pelements, a test was also carried out on a table in which P elements have been recorded as present or absent. Again, there was no evidence of association.
Additional statistical tests were carried out to ex- amine the distributions of P and hobo insertions along the length of the third chromosome. A Kolmogorov- Smirnov test (ROHLF and SOKAL 198 1 ; SOKAL and ROHLF 1981) showed that both distributions were significantly non-uniform
(D
= 0.0922, P<
0.00005 for P elements andD
= 0.1555, P<
0.0055 for hobo elements). More importantly, this test also showed that to a significant level(D
= 0.1591, P<
0.01 15) the two transposons were distributed differently with respect to each other. T h e last result was confirmed by dividing the chromosome into 20 regions of two numbered divisions each, proceeding from the left telomere to the right telomere of the chromosome. T h e number of P and hobo elements was compared in each region using thex 2
test. T h e test was significant(x'
= 40.3, 19 d.f., P<
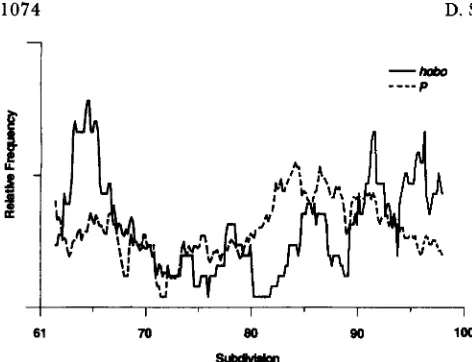
0.003). T h e distributions ofP and hobo inserts along chromosome 3 are illustrated in Figure 13 in which the distributions are smoothed out for ease of visual inspection. T h e statistical anal- yses were performed using the unsmoothed data. Fig- ure 13 demonstrates that P elements tend to be clus- tered in the proximal region of the right arm, while the hobo elements tend to be found in the more distal locations of each arm.
DISCUSSION
Comparison of hobo and
P
element enhancer trap--
hobo P ""I I I I I
61 m 80 90 100
!3lmvmn
FIGURE 13.-Distributions of P and hobo elements along chro- mosome 3 smoothed using a sliding window of 15 lettered subdivi- sions. The sizes of the distributions have been normalized with respect to each other and the units of the ordinate are therefore arbitrary.
enhancer trap screen is that the most frequently stain- ing tissues are the nervous system and the gut. This is very similar to what is observed using P element enhancer traps. It was suggested based on the P ele- ment enhancer trap data that this predominance may reflect the possibility that the nervous system and the gut displays the largest complexity of cell types (BEL- LEN et al. 1989; BIER et al. 1989). This suggestion may explain the similar staining profiles that are seen using the different transposable element system described here.
It has been shown for many P element enhancer traps that the staining pattern of the enhancer trap faithfully reproduces part or all of the expression pattern of a nearby gene. It seems likely that the same will hold true for the hobo enhancer trap: three
examples are discussed in the present report where this seems to be the case. In addition, in a manner similar to what has been shown for P elements, we have demonstrated that it is possible to use P[ry+,
H B L l ] to create imprecise excisions of a viable hobo
insertion and thereby create mutations in a nearby gene. Further, we have shown that most of the reces- sive lethal phenotypes are due to hobo insertion.
Using single P element mutagenesis, the rates of recessive lethal phenotypes for the second and third chromosomes were 17% and 1 1 %, respectively, in one study (BIER et al. 1989) and 10% and 1 1 %, respec- tively, in another (COOLEY, KELLEY and SPRADLING 1988). These rates have proven fairly typical for other single P element mutageneses.The rates of recessive lethal phenotypes for the second and third chromo- somes using the hobo enhancer trap were higher, 17% and 28% respectively. Whether this discrepancy is due to the use of two different transposons remains to be seen. Many P element alleles prove to be hypomorphs and this may be due to the well established tendency
of P elements to insert near the transcriptional initia- tion site of genes rather than into coding sequences. It may be that hobo elements do not display this tendency. This issue could be resolved by investigation of the insertion sites of a number of lethal hobo insertions. In addition, it has been suggested that the ability of a transposon to cause mutations may depend on the sequences contained within it (BERG and SPRA- DLING 1991) and it may be that the sequences con- tained within the hobo enhancer trap are partially responsible for its higher mutation rate. In any event, the general issue of the rate of recessive lethal phe- notypes produced by single element hobo mutagenesis may repay further study.
Comparison of hobo and
P
insertion specificities: One approach to analysis of the mutation preferences of the two transposon systems would be to attempt a single element mutagenesis of chromosome 3 (for example) with both hobo and P elements and then to compare the frequency with which various loci are mutated by each element. Such an approach would probably be impracticable, since the number of loci on chromosome 3 mutable to lethality by chemical mutagens is estimated to be about 1650UURGENS
etal. 1984) and the number readily mutable to lethality by P elements has been estimated to be at least 582 (COOLEY, KELLEY and SPRADLING 1988). Thus, the potential number of targets for insertion is so large that it is unlikely that it would be possible to make a convincing argument that the distributions of the two elements in general are different, though this ap- proach might provide useful information about hot spots.
We have therefore chosen to take a different ap- proach. We have localized a number of independent
hobo enhancer trap insertions on the third chromo-
some and compared these with a compilation of P
element insertions. T h e P element insertions in the compilation have many different origins and it is difficult to address whether the mode of production of a P element insertion affects its insertion specificity. However, BERG and SPRADLING (1991) found no sig- nificant difference between the two populations of insertional mutants on chromosome 3 produced by two separate P elements at different positions on the X chromosome. T h e compilation of localized P ele- ment insertions depends on the generosity of the fly community, and there is no evidence that it has been subjected to systematic sampling bias (MERRIAM et al.
199 1). T h e localized hobo insertions were a represent- ative sample of the whole collection, although lethal lines were somewhat underrepresented (20/118 =
17%) and specifically staining lines were somewhat overrepresented (71/118 = 60%).
1075
subdivision level and the Kolmogorov-Smirnov test indicated gross differences at the chromosomal level. Of the two tests, the Kolmogorov-Smirnov test is more probably more reliable in this context. The R X C contingency
x2
test compares the two distributions at the level of the lettered subdivision and is therefore susceptible to error if there are inaccuracies in cytol- ogy in either distribution. The Kolmogorov-Smirnov test compares more global aspects of two distributions and hence is much less sensitive to inaccuracies at the lettered subdivision level. In addition, the test is non- parametric and conservative (ROHLF and SOKAL 198 1 ;SOKAL and ROHLF 198 1). In the comparison of the
P
and hobo distributions, the test was significant at close to 1 %. The different insertion patterns for
P
and hobo may reflect a different distribution of local hot spots for the two elements or other large scale regional preferences.A genetic approach toward comparing hobo and
P
element insertion specificity may be possible using local jumping which has recently been described for P elements (TOWER et al. 1993; ZHANG and SPRA- DLINC 1993) and which we and others (SHEEN, LIM and SIMMONS 1993) suggest may also occur for hobo elements. This approach may allow extensive muta- genesis of a genetic region and permit further com- parison between the insertion preferences of the ele- ments. More generally, perhaps one of the most im- portant tasks in the future development of hobo insertional mutagenesis is to improve the jump rate. This would improve the usefulness of the system and would decrease the labor involved in future investi- gations. We have shown in this report that a recom- binant chromosome containing two hobo elements pro- vides a higher jump rate than chromosomes contain- ing a single element. More substantial improvements might be obtained by the development of stronger sources of hobo transposase.
In conclusion, this report shows that the hobo ele- ment can be used effectively for enhancer trap muta- genesis. In addition, the present data shows
P
and hobo elements have different insertion specificities and hence hobo insertional mutagenesis and enhancer trap- ping should be valuable additional tools for more complete coverage of the Drosophila genome.We thank Y. HIROMI for pFZ and V. PIRROTTA for pCahsneo- miniwhite. We thank Y. HIROMI and R. W. PADGETT for advice on construction of pHLw2, M. FRISARDI for teaching D.S. how to do in situ hybridization, KEVIN LEE and CLIVE WILSON for advice on nervous system staining, PEI-HSIN HUANG and MICHELE SANICOLA for performing the Southern blot analysis of phage from the disk region of d p p and J. LISTER and K. MYERS for technical assistance in the early stages of this project. D.S. is grateful for support from a Serc/NATO research fellowship and the Horace Le Marquand and Dudley Bigg research fellowship of the Royal Society. B.R.C. was supported by a National Science Foundation predoctoral fellow- ship and a U.S. Public Health Service predoctoral traineeship in
genetics. This work was supported by a National Institutes of Health grant to W.M.G.
LITERATURE CITED
ATHMA, P., E. GROTEWOLD and T. PETERSON, 1992 Insertional mutagenesis of the maize P gene by intragenic transposition of A t . Genetics 131: 199-209.
BELLEN, H. J., C. J. O’KANE, C. WILSON, U. GROSSNIKLAUS, R. K. PEARSON and W. J. GEHRING, 1989 P-element-mediated en- hancer detection: a versatile method to study development in Drosophila. Genes Dev. 8: 1288-1300.
BERG, C. A., and A. C . SPRADLING, 1991 Studies on the rate and site-specificity of P element transposition. Genetics 127: 515- 524.
BIER, E., L. Y. JAN and Y . N. JAN, 1990 rhomboid, a gene required for dorsoventral axis establishment and peripheral nervous system development in Drosophila melanogaster. Genes Dev. 4
BIER, E., H. VAESSIN, S . SHEPHERD, K. LEE, K. MCCALL, S. BARBEL, L. ACKERMAN, R. C A R R E ~ O , T. UEMURA, E. GRELL, L. Y. JAN
and Y. N. JAN, 1989 Searching for pattern and mutation in the Drosophila genome with a P-lacZ vector. Genes Dev. 3: 1273-1287.
BLACKMAN, R. K., R. GRIMAILA, M. M. D. KOEHLER and W. M.
GELBART, 1987 Mobilization of hobo elements residing within the decapentaplegic gene complex: suggestion of a new hybrid dysgenesis system in Drosophila melanogaster. Cell 4 9 497-505. BLACKMAN, R. K., and W. M. GELBART, 1989 The transposable
element hobo of Drosophila melanogaster, pp. 523-529 in Mobile DNA, edited by D. E. BERG and M. M. HOWE. American Society for Microbiology, Washington, D.C.
BLACKMAN, R. K . , M. SANICOLA, L. A. RAFTERY, T. GILLEVET and W. M. GELBART, 1991 An extensive 3’ cis-regulatory region directs the imaginal disk expression of decapentaplegic, a mem- ber of the TGF-f3 family in Drosophila. Development 111: 657- 665.
CALVI, B. R., T. J. HONG, S. D. FINDLEY and W. M. GELBART, 199 1 Evidence for a common evolutionary origin of inverted repeat transposons in Drosophila and plants: hobo, Activator and Tam3. Cell 6 6 465-471.
COOLEY, L., C. BERG and A. SPRADLING, 1988 Controlling P element insertional mutagenesis. Trends Genet. 4: 254-258. COOLEY, L., R. KELLEY and A. SPRADLING, 1988 Insertional mu-
tagenesis of the Drososphila genome with single P elements. Science 2 3 9 1121-1 128.
ENGELS, W. R., 1989 P elements in Drosophila melanogaster, pp. 437-484 in Mobile DNA, edited by D. E. BERG and M. M. HOWE. American Society for Microbiology, Washington, D.C. ENGELS, W. R., C. R. PRESTON, P. THOMPSON and W. B. ECGLFX-
TON, 1986 In situ hybridization to Drosophila salivary chro- mosomes with biotinylated DNA probes and alkaline phospha- tase. Focus 8: 6-8.
GELBART, W. M., and R. K. BLACKMAN, 1989 The hobo element of Drosophila melanogaster. Progr. Nucleic Acid Res. Mol. Biol.
HIROMI, Y., and W. J. GEHRING, 1987 Regulation and function of the Drosophila segmentation gene fushi tarazu. Cell 5 0 963- 974.
JURGENS, G., E. WIESCHAUS, C. NUSSLEIN-VOLHARD and H. KLUD- ING, 1984 Mutations affecting the pattern of the larval cuticle in Drosophila melanogaster. 111. Zygotic loci on the third chro- mosome. Wilhelm Roux’s Arch. 193: 283-295.
KIDWELL, M. G., 1986 P-M Mutagenesis, pp. 59-8 1 in Drosophila: A Practical Approach, edited by D. B. ROBERTS. IRL Press, Oxford.
KIDWELL, M. G., 1987 A survey of success rates using P element 190-203.
mutagenesis in Drosophila melanogaster. Drosophila Inform. Serv. 6 6 81-86.
LINDSLEY, D. L., and G. G. ZIMM, 1992 The Genome ofDrososphila melanogaster. Academic Press, New York.
MERRIAM, J., M. ASHBURNER, D. L. HARTL and F. C. KAFATOS,
199 1 Toward cloning and mapping the genome of Drosoph- ila. Science 254. 221-225.
MLODZIK, M., and Y. HIROMI, 1992 Enhancer trap method in Drosophila: its application to neurobiology. Methods Neurosci.
MONTELL, D. J., and C. S. GOODMAN, 1988 Drosophila substrate adhesion molecule: sequence of laminin B1 chain reveals do- mains of homology with mouse. Cell 53: 463-473.
MONTELL, D. J., and C. S. GOODMAN, 1989 Drosophila laminin: sequence of Bw2 subunit and expression of all three subunits during embryogenesis. J. Cell Biol. 109: 2441-2453.
MORENO, M. A., J. CHEN, I. GREENBLATT and S. L. DELLAPORTA,
1992 Reconstitutional mutagenesis of the maize P gene by short-range Ac transpositions. Genetics 131: 939-956.
O’KANE, C. J., and W. J. GEHRINC, 1987 Detection in situ of genomic regulatory elements in Drosophila. Proc. Natl. Acad. Sci. USA 8 4 9123-9127.
PERRIMON, N., E. NOLL, K. MCCALL and A. BRAND, 1991
Generating lineage-specific markers to study Drosophila devel- opment. Dev. Genet. 12: 238-252.
PIROTTA, V., 1986 Cloning Drososphila genes, pp. 83-110 in Drosophila: A Practical Approach, edited by D. B. ROBERTS. IRL Press, Oxford.
PIROTTA, V., H. STELLER and M. P. BOZZETTI, 1985 Multiple upstream regulatory elements control the expression of the Drosophila white gene. EMBO J. 4: 3501-3508.
PLASTERK, R. H. A., 1990 The ins and outs of transposition. New Biol. 2: 787-792.
RAY, R. P., K. ARORA, C. NUSSLEIN-VOLHARD and W. M. GELBART,
199 1 The control of cell fate along the dorsal-ventral axis of the Drosophila embryo. Development 113: 35-54.
RIO, D. C., 1990 Molecular mechanisms regulating Drosophila P element transposition. Annu. Rev. Genet. 24: 543-578.
ROHLF, F. J., and R. R. SOKAL, 1981 Statistical Tables, Ed. 2. W.
H. Freeman & Co., San Francisco.
SAMBROOK, J., E. F. FRITSCH and T. MANIATIS, 1989 Molecular
9 397-414.
Cloning: A Laboratory Manual, Ed. 2. Cold Spring Harbor Laboratory, Cold Spring Harbor, N.Y.
SEIFERT, H. S., E. Y. CHEN, M. So and F. HEFFRON, 1986 Shuttle mutagenesis: a method of transposon mutagenesis for Saccha- romyces cerevisiae. Proc. Natl. Acad. Sci. USA 83: 735-739.
SHEEN, F., J. K. LIM and M. J. SIMMONS, 1993 Genetic instability in Drosophila melanogaster mediated by hobo transposable ele- ments. Genetics 133: 315-334.
SOKAL, R. R., and F. J. ROHLF, 198 1 Biometry, Ed. 2. W. H. Freeman
& Co., San Francisco.
SPRADLING, A. C., 1986 P element-mediated transformation, pp.
175-197 in Drosophila: A Practical Approach, edited by D. B. ROBERTS. IRL Press, Oxford.
ST. JOHNSTON, R. D., and W. M. GELBART, 1987 decapentaplegic transcripts are localized along the dorsal-ventral axis of the Drososphila embryo. EMBO J. 6 2785-2791.
ST. JOHNSTON, R. D., F. M. HOFFMANN, R. K. BLACKMAN, D. SEGAL, R. GRIMAILA, R. W. PADGETT, H. A. IRICK and W. M. GEL- BART, 1990 Molecular organization of the decapentaplegic gene in Drosophila melanogaster. Genes Dev. 4: 1 114-1 127.
STRECK, R. D., J. E. MACGAFFEY and S. K. BECKENWRF,
1986 The structure of hobo transposable elements and their insertion sites. EMBO J. 5: 36 15-3623.
TOWER, J., G. H. KARPEN, N. CRAIG and A. C. SPRADLING,
1993 Preferential transposition of Drosophila P elements to nearby chromosomal sites. Genetics 13.3: 347-359.
VAN SCHAIK, N. W., and R. A. BRINK, 1959 Transposition of modulator, a component of the variegated pericarp allele in maize. Genetics 44: 725-738.
WILSON, C., H. J. BELLEN and W. J. GEHRINC, 1990 Position effects on eukaryotic gene expression. Annu. Rev. Cell Biol. 6:
WILSON, C., R. K. PEARSON, H. J. BELLEN, C. J. O’KANE, U . GROSSNIKLAUS and W. J. GEHRING, 1989 P-element-mediated enhancer detection: an efficient method for isolating and char- acterizing developmentally regulated genes in Drosophila. Genes Dev. 3: 1301-1313.
ZHANG, P., and A. C. SPRADLINC, 1993 Efficient and dispersed local P element transposition from Drosophila females. Ge- netics 133: 361-373.
679-714.