20th International Conference on Structural Mechanics in Reactor Technology (SMiRT 20) Espoo, Finland, August 9-14, 2009 SMiRT 20-Division V, Paper 2002
Experimental creep life assessment of tubular structures with geometrical
imperfections in weld with reference to FBR plant life
P.Chellapandi, R.Srinivasan, S.C.Chetal and Baldev Raj
Indira Gandhi Centre for Atomic Research, Kalpakkam-603 102. INDIA , e-mail: [email protected]
Keywords: FBR, steam generator tubes, fuel pin, RCC-MR, multiaxial creep damage rule, Larson Miller Parameter, creep strength reduction factor.
1
ABSTRACT
Creep damage is a major life limiting factor for components operating at high temperature. For the fast breeder reactor (FBR), the hot sodium pool components and the steam generator are critical in determining the operating temperatures from structural mechanics considerations. Therefore, creep fatigue damage at various critical locations is estimated based on viscoplastic analyses, in compliance with the high temperature design rules of RCC-MR. In addition, welded joints of steam generator tubes with spigot made of modified 9Cr-1Mo and the welds of fuel pins made of 20 % cold worked stainless steel to annealed end plugs, which have certain deviations in the welds are also critical and the applicability of existing design rules to these components needs to be investigated carefully. Towards assessing the life of such tubular components realistically, accelerated tests were conducted simulating the creep damage to rupture. The generated test data were investigated by applying the existing creep damage assessment procedure recommended in the design code RCC-MR and the results demonstrated that with the recommended multiaxial creep damage assessment rule, the creep crack initiation lives have been predicted accurately. Further, the extrapolated life predicted by applying an appropriate Larson Miller Parameter indicates that the circumferential welds in the steam generator tubes and fuel pins are not really life limiting factors in the design.
2
INTRODUCTION
The initial design life of fast breeder reactors (FBR) is 30-40 years operating in the temperature range 800 – 820 K. For the 500 MWe Prototype Fast Breeder Reactor (PFBR), which is under construction in India, the initial design life is 40 years at 820 K. It is planned to design further reactors similar to the PFBR with a longer design life of 60 years and higher burnup, from economic considerations, in line with the international innovative FBR being considered for the future. In view of this, an investigation has been undertaken to quantify the permissible life of the PFBR and thereby for the future FBRs, by predicting the creep-fatigue lives of critical components using high temperature design code RCC-MR [1]. It is worth mentioning that ASME, Sec III: Subsection NH [2] provides design criteria for the high temperature components in general and the current version of RCC-MR focuses mainly on the FBR components.
Various high temperature failure modes identified for the reactor assembly components of PFBR are depicted in Figure1. The creep and fatigue damage is the critical failure mode in the hot pool components, which determine the design plant life. In this regard, the critical components are the control plug, inner vessel, intermediate heat exchanger (IHX) and steam generator (SG), for which viscoplastic analysis was carried out to estimate the creep-fatigue damage as per RCC-MR. Apart from these, there exists certain tubular structures having special features for which the existing design rules are assessed by an experimental investigation, of which SG tubes having circumferential butt welds achieved through an in-bore welding technique, and the end plug weld of a fuel pin are judged to be critical, which are investigated in this paper.
stainless steel which is welded to annealed end plugs. For these two structural materials, the creep strength reduction factors (Jr) are not defined in RCC-MR. Hence, the creep lives of these structures are obtained through simulated experiments and the same have been predicted by applying multiaxial creep damage rule recommended in RCC-MR. Further, the permissible lives of such structures under reactor conditions have been extrapolated applying a Larson Miller Parameter.
3
CREEP-FATIGUE DAMAGE LIFE PREDICTION OF PFBR COMPONENTS
The critical locations are: the stay plate-outer shell junctions of the control plug (A), the stand pipe-conical shell of inner vessel (B) and the top tubesheet - outer shell junction of the IHX (C), which are indicated in Figure 1. The loadings are essentially thermal in origin. In particular for the control plug, the stresses due to mechanical loadings (primary stresses) are insignificant and high thermal stresses are developed during reactor scram when the hot pool temperature drops rapidly from 820 K at a rate of 10-15 K/s. At the end of the scram (reactor shutdown), significant stresses are locked-in at the junctions (A), which are sustained during subsequent normal operating conditions. Unlike the control plug, the mechanical loads due to pressure and self weight cause sustained stresses at the junctions (B) and (C). The combination of steady stresses sustained during normal operation (responsible for creep damage) in association with high cyclic stresses developed during reactor scram (responsible for fatigue damage) results in creep-fatigue damage interaction at these junctions. About 860 load cycles defined by start up-normal operation-reactor scram-shutdown, are considered conservatively in the design stage and the associated hold period would be ~300 h per load cycle over a design life of 40 y with a 75 % load factor. The acceptable creep-fatigue damage will be reduced at the locations which are subjected to temperature fluctuations due to thermal striping [3]. This is applicable at some locations in the hot pool components, especially in control plug parts. The creep-fatigue damage is further enhanced due to the presence of welds at the junctions. By limiting the creep-fatigue damage to a value, specified by the design code, crack initiation is prevented at the junction.
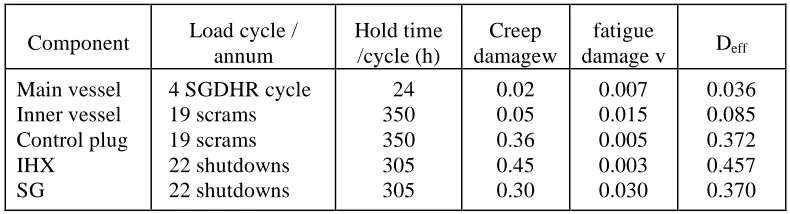
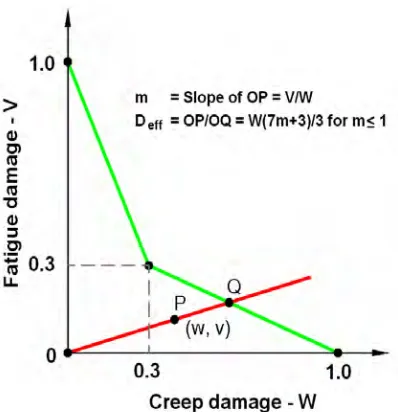
The creep-fatigue damage has been assessed for the above mentioned high temperature components and detailed in ref [4]. The required stresses and strains were computed through viscoplastic analysis using the ‘23 parameter Chaboche model’ for the austenitic stainless steel type 316 LN [5]. For the control plug and inner vessel, the thermal transients following reactor scram are the critical events considered. For the IHX and SG, the load cycle constituted by startup-normal-shutdown conditions are considered. The main vessel is subjected to cyclic thermal stresses due to free sodium level variations under safety grade decay heat removal (SGDHR) conditions. The applied load cycles and computed creep and fatigue damage values (w, v) of the hot pool components are presented in Table 1. From w and v, the effective damage (Deff) is derived by applying a bilinear creep-fatigue damage interaction rule recommended in RCC-MR, as illustrated in Figure 2. The maximum Deff is equal to 0.457, as seen in Table 1. From this, the permissible design life is derived as 40 y / 0.457, that is ~ 85 y. It can also be noted in Table.1 that creep damage (w) is the dominant failure mode in the structural design.
Table 1: Creep fatigue damage in critical PFBR components
Component Load cycle / annum Hold time /cycle (h) Creep damagew fatigue
damage v Deff
Main vessel Inner vessel Control plug IHX
SG
4 SGDHR cycle 19 scrams 19 scrams 22 shutdowns 22 shutdowns 24 350 350 305 305 0.02 0.05 0.36 0.45 0.30 0.007 0.015 0.005 0.003 0.030 0.036 0.085 0.372 0.457 0.370
design life of 60 years is comfortable from the structural mechanics view point.
4
CREEP DAMAGE ASSESSMENT OF SG TUBES
The tube is welded to the spigot by an automatic internal bore welding machine without filler metal, using a pulsed gas tungsten arc welding process. The weld joint is a square butt weld without any root gap. A sufficient spigot length is provided for the weld to be away from the discontinuity, thereby avoiding a stress concentration in the weld (Figure 3). Experience from mock-up weld joints indicates certain deviations in the form of convexity, concavity, dents on the inner surface and dents on the outer surface as shown in Figure 4. These deviations are asymmetric in nature for most of the cases.
4.1 Experimental details
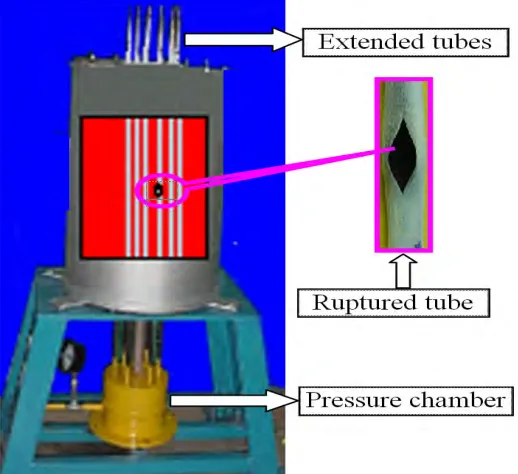
The nominal dimensions of the mock-up tubes are the same as in the PFBR i.e. 17.2 mm outer diameter and 2.3 mm wall thickness. Tubes are thinned to 1.7 mm by machining, to account for the thickness loss due to corrosion and under-tolerance on weld thickness at the end of 40 y, before testing. Six thinned tubes (three tubes without a weld and three with internal bore welding as in the PFBR), subjected to an internal pressure of 20 MPa through a common pressure chamber, are simultaneously tested in a furnace at a constant temperature of 933 K, in order to eliminate any possibility of uncertainities due to pressure and temperature variations. The test set-up is shown in Figure 5. The tube is considered to have failed once there is a sudden reduction of internal pressure. A typical tube after rupture is also shown in Figure 5.
4.2 Life Prediction
The three unwelded tubes ruptured in 36, 38 and 42 days and the three welded tubes ruptured after 36, 37 and 38.5 days. The data all lie within the typical scatter in the life of experiments at high temperature. This confirms that a sound circumferential weld in the pressure tube does not cause significant reduction in rupture life.
The Creep life of the tube under a biaxial state of stress, is predicted by applying the multiaxial creep damage assessment criteria recommended in RCC-MR, as given below.
The governing stress σeq is expressed as a function of both the Von-Mises stress (σVM) and the hydrostatic stress component (σH), as follows:
σeq = 0.867. σVM + 0.4.σH. (1)
σVM = 1/√2.[(σθ - σl )
2
+ (σl - σR)2 + (σR - σθ)
2
]1/2
σH = [ σθ + σl + σR ]/3
Here, σθ, σl and σR are the computed hoop, longitudinal and radial stress respectively.
σθ = P.Dm/2h = 20 x (17.2 - 1.7) /2h = 92 MPa
σl = P.Dm/4h = 20 x (17.2 - 1.7) /4h = 46 MPa
σR = -P/2 = -10 MPa
σVM = 88 MPa and σH = 42 MPa
σeq = 0.867x 88 + 0.4x42 = 93 MPa
The average rupture life tr (h) at temperature T (K) is predicted from the Larson Miller Parameter (LMP): Tx (30 + log tr), knowing the controlling stress σR, as shown in Figure 6, which has been recommended for T91 steel by the material supplier [8]. It is worth noting that the Y-scale is not uniform in the curve recommended by supplier, since it has two distinct slopes above and below 100 MPa. The LMP is equal to 30.06x10³ based on lower bound curve and equal to 30.67x10³ based on average curve, corresponding to σR = 93 MPa. From these parameters, tr values are computed as 7 days (minimum) and 31 days (average) for the test temperature of 933 K. The prediction based on average stress curve is closer to the experimental data (36–42 days).
The average creep life (tr-average) at the design temperature 800 K (T) for the stresses equal to those in the mock-up can be derived from the experimentally determined lowest rupture life, 36 days (864 h) at 933 K, using the LMP as follows:
T(30 + log tr-exp) = 933.(30 + log.864) = 30730 log tr-exp = ( 30730 / 800 ) - 30 = 8.4125
tr-exp = 2.58x10
8
h.
In order to establish the design life from the average life tr-exp (2.58x10⁸ h), it is necessary to apply an appropriate factor of safety (Flife), in compliance with the design code. Since Flife is not explicitly defined in the code, it is derived as given below:
By definition, the allowable design life (tr-min) as per RCC-MR, for the operating stress σR and temperature T, is the time to rupture, to be read from the minimum stress rupture curve corresponding to the temperature T and a stress equal to σR / 0.9 (1/0.9 is factor of safety on stress). Further, the average time to rupture (tr-average) value is read directly from the average stress to rupture curve without applying any factor on σR. Based on the average and minimum rupture times, the factor of safety on life is determined as: Flife = tr-average/tr-min. The procedure is illustrated schematically in Figure 7.
To be consistent, tr-average and tr-min values are determined from the (LMP) average, equal to 30.67x10³ (obtained from average curve corresponding to 93 MPa) and (LMP)min equal to 29.67x10³ (obtained from minimum curve corresponding 93/0.9). From these LMP values, tr-average and tr-min values are determined as follows.
log tr-average = (30670 /800 ) - 30 = 8.3
tr-average = 2.18x10⁸ h.
log tr-min = (29670 /800 ) - 30 = 7.09
tr-min = 1.22x10⁷ h.
Flife = 2.18x10⁸/1.22x107 ~ 18
The permissible design life is the experimentally determined lowest rupture life tr-exp divided by Flife, which is equal to 2.58x10⁸/18 = 1.43x10⁷ h (~1632 y) under the assumption of constant thickness prevailing at the end of 40 y. This is however, not the realistic life. Once the thickness reduction due to corrosion in the steam side and in turn stress increase, is accounted year by year, the allowable life is 113 y at which the accumulated creep damage is unity, as shown in the Figure 8. Further, design life is also decided by respecting the primary stress limit, i.e. Pm, the primary membrane stress intensity (Von Mises basis) should be less than or equal to two third of minimum stress to rupture (Sr). Towards establishing this, the stress intensity is computed at end of every year and the allowable life is computed respecting the primary stress limit. Figure 9 shows the relation between the allowable life Vs operating life, from which it is inferred that the tube meets the rupture criteria up to 65 y. Based on the above considerations, it is confirmed that a permissible life of 60 years for SG is comfortable for the PFBR.
5
CREEP LIFE OF FUEL PIN END PLUG WELD
5.1 Experimental details and results
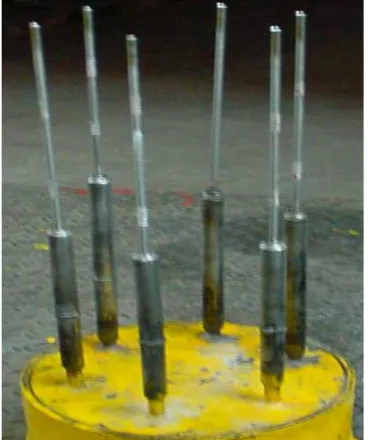
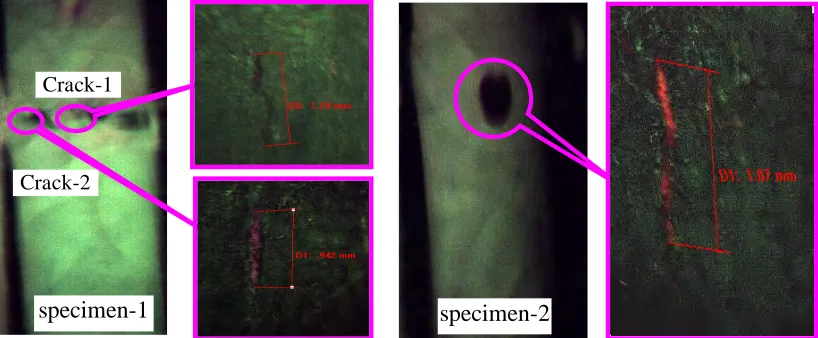
Fuel pins with an end plug weld were tested at 973 K under an internal pressure of 20 MPa to account for possible uncertainties in the fission gas release phenomenon. The test setup is shown in Figure 12. A leak in the pin is the indication of failure which is detected by a fall in the steady state pressure in the chamber. Figure 13 depicts a typical tested pin which shows bulging and a crack at the bulged location. Totally six pins were tested and leaks occurred after 1104 h (min) and 1188 h (max). The observed cracks were investigated thoroughly by image analysis. Figure 14 shows that the crack is longitudinal caused by hoop stress effects and is observed just below the weld joint.
5.2 Life prediction
In order to predict the creep life using RCC-MR, the required stresses are determined by inelastic analysis using the finite element method. Analysis is carried out including creep deformation / relaxation in order to derive the governing stress σeq as per equation (1).
The fuel pin along with end cap (dimensional details are shown in Figure.10) is modeled using axisymmetric elements for the elastic-creep analysis by CAST3M computer code issued by CEA France. The creep law: εc = 2.3046.10-13 t0.6344 σVM
4.60957
is adopted from RCC-MR:Appendix-Z, corresponding to 1S material (annealed condition) at 973 K. Analysis is performed for sufficiently long time (1500 h) to get the saturated state of stress. The distributions of saturated σθ and σl are depicted in Figure 15. The peak σl occurs
at the inner surface at the weld junction. The maximum σθ occurs on the outer surface, at a location ~ 1.5 mm
below the weld junction. The σeq distributions are shown in Figure 16. While the maximum σeq on the outer surface of the pin is hoop stress dominant and load controlled, the peak σeq at the weld junction is longitudinal stress dominant and deformation controlled. Accordingly, there are two critical locations where creep crack initiation may start: one at the weld junction where a circumferential crack initiates on the inner surface and propagates along the longitudinal direction and another at the location-A where a longitudinal crack initiates on the outer surface and propagates across the depth direction resulting in crack opening and subsequent leakage. As predicted, the crack at location-A (Figure 16) caused leakage of hot air, causing depressurisation after about 1100 h. Although a circumferential crack could have been initiated earlier this could not have been quantified due to practical difficulties. The crack at the junction after propagation by a certain extent has branched, which is also a reason for not causing crack opening earlier than the crack at location-A. Figure 17 shows the crack branches at the weld junction as depicted by an image processing technique.
The creep crack initiation life is estimated using the experimentally generated average stress rupture curves as shown in Figure18 [9], corresponding to the governing stress (σeq) of 133 MPa (Figure16) and the predicted life is 1050 h, which compares well with the test results (1104 h-minimum and 1188 h-maximum). It is to be noted that the σeq is nearly equal to σθ (135 MPa) which initiates the crack in the longitudinal
direction. The predicted location of crack initiation (~1.5 mm below the weld junction as extracted from Figure 16) is close to the observed crack location (Figure17). The local bulging observed in the experiment (Figure17) has been developed during the tertiary creep stage.
5.3 Permissible Life of fuel pin for Future FBR Design
The permissible creep life of the end plug at 823 K has been extrapolated from the experimental data (lowest creep life is 1104 h at 973 K) using the Larson Miller Parameter: T(20+log.tr) as follows:
LMP = 973x(20+log1104) = 22421 823x(20 + log tr) = 22421
log tr + 20 = 22421/823 = 27.243
This yields the rupture life at the design temperature of 823 K as 10 (27.243 – 20), equal to 1.75x10⁷ h.
neutron dose with burnup and the end plug weld will not impose any restriction on achievable burnup. Further, the investigation confirms that the manufactured end plug weld configuration have been well qualified to use in the reactor with confidence.
6
DISCUSSION ON USE OF LMP
The LMP, established for the modified 9Cr-1Mo steel by the steel manufacturer, based on extensive tests materials is used directly for deriving the time to rupture for predicting the creep life of tubular specimens and compared with the experimental data (without any extrapolation). For the austenitic stainless, well established LMP is used. Subsequently, permissible lives for the components considered in the investigation, are estimated based on extrapolation which indicates very long life. Even though, there can be inherent uncertainties in such large extrapolations, this gives a feel of permissible plant life for an FBR. Further, when compared to the permissible design lives (60 years for SG tubes and about 3 years for fuel pins) arrived at, the extrapolation is well within the normally acceptable range in such design exercise.
7
CONCLUSIONS
Investigations on the tests series on the critical tubular structures of the FBR, namely the SG tubes and fuel pins with weld deviations have been presented, focusing on assessment of creep damage estimation procedures recommended in RCC-MR (2002). The test data have been predicted closely by the theoretical analysis. The orientation of crack during initiation and propagation phases is found to be in the longitudinal direction and hence the hoop stress is the controlling stress. The equivalent stresses derived from the multiaxial creep rupture criteria (93 MPa for SG tubes and 133 MPa for fuel pins) are found to be closer to the respective hoop stresses (92 MPa and 135 MPa), than the von Mises stresses. This demonstrates that the life prediction ability of RCC-MR with a multiaxial creep damage assessment rule is robust. The circumferential welds in the tubes do not cause significant reduction in creep rupture life under internal pressure. Accordingly, the weld strength reduction factor is not warranted. The creep-fatigue damage accumulated in the high temperature components, namely main vessel, inner vessel, control plug, IHX and steam generators including tubes determine the plant life. Accordingly, the current design of PFBR can have a design life of 65 years.
Based on the creep rupture data on the SG tubes, the critical component which decides experimental data, the permissible design lives for these structures have been extrapolated by Larson Miller Parameters and found not to limit the design life of the plant.
The targeted fuel burnup will not be limited by accumulated creep damage in the end plug weld in general. Hence, with the current design rules of RCC-MR in conjunction with the material data provided, 60 years of plant life being considered for forthcoming FBR will not be a problem.
REFERENCES
1) RCC-MR: Design and construction rules for mechanical components for FBR nuclear islands, Section I, Subsection B, Class 1 Components, AFCEN, 2002.
2) ASME, Sec III, Division 1: Subsection NH, Boiler and Pressure Vessel Code for Class 1 Components in Elevated Temperature Service’, 2004.
3) B.Drubay and D.Acker, ‘Evaluation of thermal striping risks: Limitation of cracks initiation and propagation’, Specialists Meeting on Correlation Between Material Properties and Thermo-Hydraulic Conditions in LMFRs, 22-24 Nov 1994, France, IWGFR/90.
4) Bhoje S B and Chellapandi P, ‘Advanced Structural Design of High Temperature Components of FBR’, Tran. Indian Institute of Metals, Vol.53., No.3, June 2000, 165-173.
5) Chaboche J L. and Nouailhas D, ‘A Unified Constitutive Model for Cyclic Viscoplasticity and Its Applications to Various Stainless Steels’, ASME Journal of Engineering Materials and Technology, Vol 111, 1989, 424-430.
6) Laue H. et al, 'Design and Construction Rules Committee for the EFR - Current status and Development', SMiRT-11, Transactions Vol.E Aug.1991, Tokyo, Japan
8) Guntz G, et. al, Ferritic tubes and pipe for high temperature use in boilers, THE T91 BOOK, 1990, Vallourec Industries – France.
9) Mathew M D, Mannan S L, Ray S K and Rodriduez P, ‘Interim Report No – II on Creep Rupture Properties of FBTR Clad Tubes’, Internal report: RC/Met/Creep/84/01.
Figure 1 Major Components and High temperature failure modes in a FBR
Figure 4 Manufacturing
imperfections
in spigot welds (acceptable
δ
max- 0.4 mm)
Figure 5 Test apparatus for simultaneous testing of
6 tubes
Figure 6 Larson Miller Parameter vs. stress
relation for T91 steel
Figure 11 Metallography of weld
M etallography of weld
joint
joint
with root
with root --pock et
pock et
Figure 10 Details of end plug weld
joint
Figure 12 Fuel pin end plug test setup
Figure 13 Bulging of pin after 1116 h
crack
Figure 8 Accumulated creep damage
113
Figure 15
σ
θand
σ
ldistributions
Figure 16
σ
eqdistributions
1.1.1.1.1.1.1
A
5.26 5.27
5.34 5.22
Figure.17. Crack initiation under peak longitudinal stress
Fuel pin
End plug
Figure 14 Longitudinal cracks seen in the fuel pins at the welding zone
specimen-1
specimen-2
Crack-1