ABSTRACT
LINEBERRY, CARRIE AMANDA MAE. Using Dynamic Geometry Software to Develop Students’ Conceptual Understanding of Angle. (Under the direction of Dr. Karen Allen Keene).
Angle is a complex topic defined in a variety of contexts; some define angle to be as a pair of rays coming from a single point, as a rotation about a single point, or in a curve. Due to the multiple definitions of angle students get confused as to what an angle truly consists of. This study paid close attention to the misconceptions high school geometry students’ hold about the concept of angle and how to help them gain a more conceptual understanding of this essential concept with the use of technology.
There are multiple varieties of technologies that can be used to help students learn the concept of angle, or any geometry related concept, the one used in this study was The
Geometer’s Sketchpad, which is one version of Dynamic Geometry Software in which students can create a figure and manipulate its shape to discover properties of the shape they created. The study hypothesizes that angle can be learned using interactive software. The students can move the dynamic diagrams around and see what changes with different types of angles.
By connecting the following two research areas, student understanding of angle and DGS as a tool for instruction, this study was designed to expand upon the research on incorporating technology into the geometry classroom by concentrating on how the technology is incorporated and if the method has any affect on students’ conceptual understanding. The primary purpose is to discover whether it would be beneficial for
Using Dynamic Geometry Software to Develop Students’ Conceptual Understanding of Angle
by
Carrie Amanda Mae Lineberry
A thesis submitted to the Graduate Faculty of North Carolina State University
in partial fulfillment of the requirements for the degree of
Master of Science
Mathematics Education
Raleigh, North Carolina 2010
APPROVED BY:
_______________________________ ______________________________
Dr. Karen Allen Keene Dr. Karen F. Hollebrands
Committee Chair
DEDICATION
I would like to dedicate this thesis to my mother Terina Reece Lineberry and father Jeffrey Michael Lineberry who have given me support throughout my entire educational experience. I would also like to dedicate this thesis to my grandmother and grandfather, Roger and Carrie Mae Reece who have always given me unconditional love and
BIOGRAPHY
Carrie Amanda Mae Lineberry was born in Yadkin County, North Carolina. She attended Forbush High School where she graduated with high honors and in the top 5% of her class in May of 2003. She was then awarded the Prospective Teacher Scholarship, which is a competitive, merit-based scholarship-loan program. She was then enrolled at
Appalachian State University in August of 2003. She graduated in December of 2006 with a Bachelor of Science degree in mathematics education with a minor in religion and
philosophy.
Upon gradation, Carrie started teaching mathematics in January of 2007 at Parkland High School in Winston-Salem, North Carolina, where she taught Geometry, Algebra II, and Honors Algebra II. After one and a half years at Parkland High School, Carrie decided to further her education at North Carolina State University. She then moved to Raleigh, North Carolina and took a job at Millbrook High School. She was also awarded the NC Student Loan Program for Health, Science and Mathematics. She was enrolled full time into the graduate school at North Carolina State University in August of 2008 under the direction of Dr. Karen Allen Keene, while continuing her teaching position at Millbrook High School where she taught Geometry and Seminar.
ACKNOWLEDGMENTS
First I would like to thank my mother and father, Mike and Terina Lineberry, for all of their unconditional love and continued support. They have encouraged me during every step of my journey through high school, college, teaching, a master’s degree, and soon a doctoral degree. I would also like to thank my fiancé, Dustin Ritter, who has given me his unconditional love and support throughout this entire process. I would also like to thank my extended family as well as my fiancé’s parents, Wesley and Bobbie Joe Ritter, and his brother, Daniel Ritter along with his extended family for all of their continued support and encouragement. I am fortunate to have the support of two large loving families who have encouraged me throughout my educational career at North Carolina State University.
I express my gratitude to my committee chair and advisor, Dr. Karen Allen Keene; none of this would be possible without her continued support and guidance. I would also like to thank Dr. Karen Hollebrands and Dr. Molly Fenn for serving on my advisory committee. I express my gratitude to all of my professors at North Carolina State University. Each and every one of my professors have encouraged me throughout my time at NCSU and
influenced me to pursue a doctoral degree in mathematics education.
TABLE OF CONTENTS
LIST OF TABLES………x
LIST OF FIGURES………. xii
CHAPTER 1 – Introduction………..1
Significance and Purpose of the Study……….4
Research Questions………...7
CHAPTER 2 – Literature Review……….…8
Angle Comprehension………...8
Teaching with Technology………16
Dynamic Geometry Software ………17
Conclusion……….24
CHAPTER 3 – Methods………...26
Purpose and Overview of Study………26
Setting ………27
Subjects………..28
Design of the Study………....31
Data Collection………..33
Data Analysis ………37
Qualitative………..37
Paired T-Test – Quantitative Data Analysis………..43
Male vs. Female………..46
Minority vs. Majority………..49
Sophomores vs. Juniors………..52
Combined Class Pre-Test Analysis – Qualitative Data Analysis...55
SCD Class and TCD Class Results………...58
Student-constructed (SCD) Individual Results………59
Student-constructing DGS instructional activity analysis……….59
Use of DGS with student-constructed diagram (SCD)………..61
Use of DGS with student-constructed diagram (SCD) Pre and Post-test analysis.………..63
Teacher-constructed Individual Results………...65
Analysis of DGS Teacher-constructed instructional activity worksheet …...66
Segment, line and ray defining………...63
Angle defining………70
Angle classification………71
Angle-pair relationships defining………...74
Segment addition postulate descriptions………76
Segment bisector postulate descriptions………78
Angle addition postulate description………..79
Angle bisector postulate descriptions……….81
Use of DGS pre-constructed diagram (TCD) Pre and Post-test analysis…..84
Clinical Interviews……….87
Subject 5 – Student-constructing class………...………87
Subject 3 – Student-constructing class………...…89
Subject 9 – Student-constructing class………...………90
Subject 20 – Teacher-constructing class………...….91
Subject 27 – Teacher-constructing class………...….92
Interview Summary………...…..95
Summary………...….95
Student’s Thoughts about the Software and the Instructional Activity………...98
CHAPTER 5 – Discussion & Conclusion………101
First Research Question………...101
Second Research Question………...105
Limitations………109
Limitations of the materials………...110
Limitations of the study……….113
Implications for Teaching………115
Future Development……….117
REFERENCES………119
APPENDICES……….124
Appendix C – Pre-Test……….129
Appendix D – Student-constructed instructional activity……….131
Appendix E – Teacher-constructed instructional activity………...……….138
Appendix F – Post-Test………145
Appendix G – Interview protocol……….147
LIST OF TABLES
Table 1 Mitchelmore and White’s classification concerning angles………...11
Table 2 The demographics of the subjects who used DGS with student constructed diagrams……….….28
Table 3 The demographics of the subjects who used DGS with teacher-constructed diagrams……….….29
Table 4 The educational background of the subjects who used DGS with student constructed diagrams……….….29
Table 5 The educational background of the subjects who used DGS with teacher- constructed diagrams………..30
Table 6 Design of the study……….31
Table 7 The categories for angle as defined in Euclidian geometry………...40
Table 8 The categories for angle as defined by a rotation about a single point……..40
Table 9 The t-test statistics for the SCD class……….44
Table 10 The t-test statistics for the TCD class……….45
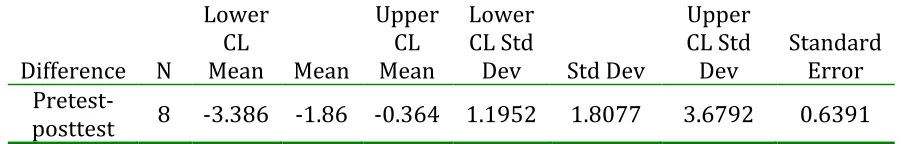
Table 11 The t-test statistics for the SCD class female……….46
Table 12 The t-test statistics for the TCD class female……….47
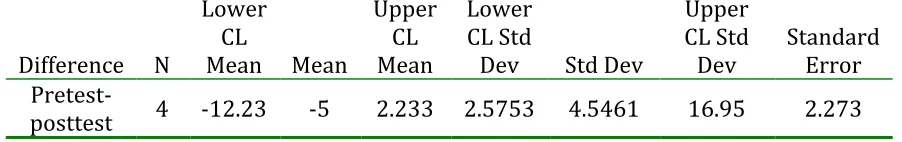
Table 13 The t-test statistics for the SCD class male………48
Table 14 The t-test statistics for the TCD class male………48
Table 17 The t-test statistics for the TCD class minority………..51
Table 18 The t-test statistics for the SCD class 15 & 16 year old……….52
Table 19 The t-test statistics for the TCD class 15 & 16 year old……….53
Table 20 The t-test statistics for the SCD class 17 & 18 year old……….54
Table 21 The t-test statistics for the TCD class 17 & 18 year old……….54
Table 22 Pre-test questions………56
Table 23 Summary of pre-test responses for both classes……….56
Table 24 Summary of instructional activity responses for student-constructed class...60
Table 25 Student categorization throughout the student-constructed study…………..63
Table 26 The SCD class scores………..64
Table 27 Summary of instructional activity responses for teacher-constructed class....67
Table 28 Categorization throughout the teacher-constructed study………...……84
Table 29 The teacher-constructed class scores………...85
LIST OF FIGURES
Figure 1 Coding of Subject 1’s Pre-test………41
Figure 2 Segment, Line, and Ray Construction………68
Figure 3 Angle Construction……….70
Figure 4 Angle Classification Construction………..72
Figure 5 Angle Pair Relationship Construction………75
Figure 6 Segment Addition Construction……….77
Figure 7 Segment Bisector Construction………..78
Figure 8 Angle Addition Construction……….80
Figure 9 Angle Bisector Construction………..81
CHAPTER 1 INTRODUCTION
Envision a class of average geometry students who have learned bits and pieces of geometry throughout several mathematics courses and enter into their only high school geometry class with a host of previous knowledge from a variety of somewhat disconnected instructional experiences. As they discussed the description and properties of angle after looking at a geometric figure in a dynamic geometry system, a student defined angle as “basically a bend in a line, so it becomes two rays coming out of a single point.” While two students analyzed a dynamic diagram of an angle they discussed how the degree of the angle “either increases or decreases and goes in a 360 degree” rotation. At the same time a student who is questioning his own beliefs about angle in a curve supposed, “well I count them as no angles, but I am sure that if you looked at it extremely closely, every curve is like a
minuscule, to a smallest decimal straight line, so that there would be millions in” the curve. Finally when a student is asked to identify the angles in a quadrilateral you listened to a student express how a quadrilateral contains only four angles, “unless you count the over 180-degree ones,” which would bring the total to eight angles.
geometric ideas” (p. 40). They can think critically about certain topics, construct new ideas, and discover properties of geometry they have missed throughout their entire mathematics career. “With well-designed activities, appropriate tools, and teachers’ support, students can make and explore conjectures about geometry and can learn to reason carefully about
geometric ideas from the earliest years of schooling” (NCTM, 2000, p. 40).
There are multiple varieties of technologies that can be used to help students learn the concept of angle, or any geometry related concept. Some of these technologies fit under the umbrella of the term Dynamic Geometry Software, “DGS emphasizes the functional aspect of geometrical figures” (Hollebrands, Laborde & StraBer, 2008, p. 166). This study is about the use of The Geometer’s Sketchpad, one version of DGS, which is how it will be referred to in this study. DGS can provide dynamic diagrams, unlike constructing diagrams with pencil and paper, which students can manipulate to understand concepts, and cannot be done with traditional paper diagrams (Hollebrands, Laborde & StraBer, 2008, p. 167).
There have been numerous studies conducted to discover the benefit of using DGS; the focus of this study is not to determine if DGS is beneficial in the classroom, but to determine if the specific style in which is the software is used within the classroom affects student conceptual understanding. DGS, unlike constructing diagrams with paper and pencil, can provide dynamic diagrams that students can manipulate to understand concepts
(Hollebrands, Laborde & StraBer, 2008, p. 167). DGS can help students discover more information by not only constructing the diagrams but being able to drag the points, lines, segments and other objects around in order to discover new information using previous knowledge and the properties that were used to construct the diagram. This notion can be applied to many specific geometric ideas; in this study, angle is the important
conceptualization as angles are quite complex and have multiple characterizations.
Close (1982) studied the assortment of angle definitions used in mathematics along with many authors who have noted the difference between the definitions as well as between dynamic (movement) and static (configurational) angles (Close, 1982; Kieran, 1986). Mitchelmore and White (1998) suggested three different definitions in which the conceptual understanding of angle can occur, and these will be used throughout the present study. They proposed that an angle could be a rotation, a pair of half lines that extend from a common point, or as angle in a curve. Mitchelmore and White (2000a) elaborated on these definitions, by looking at different types of angles formed by a point and rays and angle as a rotation. They explained that students as young as grade 2 could understand 2-line angles (e.g.,
They also mention the complexity of angle as a rotation and the fact that students do not understand this type of angle, also referred to as a 0-line angle (e.g., doorknobs, wheels), until at least grade 6. Within the present study the researcher focused on the first two categories, an angle being a rotation about a point or a pair of rays that extend from a
common point. “Defining angle therefore becomes a difficult process because all definitions put limitations on the concept by focusing more heavily on one facet more than any of the others” (Keiser, 2004, p. 289).
A variety of studies exist that focus on the “complexity of the concept of angle” and “that students struggle with that complexity in their own development of the concept” (Keiser, 2004, p. 286). A study by Mitchelmore & White (1998) concentrated on a more comprehensive look at the students’ misconceptions and had the students categorize situations they saw everyday that implicitly concerned angles. Mitchelmore and White (2000b) believed that it is more difficult for students to understand angle measure and identify angles when they appear in slopes, turns or any other situation in which one or both sides are not detectable (Fyhn, 2008, p. 22).
In the next section, the researcher provides details about the significance and purpose of the study. The last section of the introduction will then introduce the research questions for the project.
Significance and Purpose of the Study
has been focus of many studies by educators and psychologists ever since (NCTM, 2000). More specifically, students need to participate in important instruction in geometry so they can “analyze characteristics and properties of two-and three-dimensional geometric shapes and develop mathematical arguments about geometric relationships: analyze properties and determine attributes of two- and three-dimensional objects; explore relationships (including congruence and similarity) among classes of two- and three-dimensional geometric objects, make and test conjectures about them, and solve problems involving them” (NCTM, 2000, p. 308).
Additionally, high school students should be able to develop an extensive range of representations of geometric ideas in which multiple approaches to geometric problems can be used (NCTM, 2000, p. 308). DGS may provide students with tools needed for multiple approaches. “Students can use dynamic software to construct and manipulate their own diagrams, explore properties of geometric terms using already constructed diagrams and previous knowledge, construct diagrams in order to gain a deeper understanding of a known topic in order to conduct proofs and extensions of the known topic and many other
exploratory visual representations of geometric concepts” (Sinclair, 2003, p. 289). Using DGS “Students should gain experience in using a variety of visual and coordinate
representations to analyze problems and study mathematics” that is an important focus of the NCTM Principals and Standards (NCTM, 2000, p. 42).
In recent years, more emphasis has been placed on the definition of angle as it
for students and continues for most until they have completed geometry. This lack of understanding can be a significant learning issue for students; without this understanding they can never truly understand geometry or how an angle is represented every day in their lives. Therefore, this study is paying close attention to the misconceptions high school geometry students’ hold about the concept of angle and how to help them gain a more conceptual understanding of this essential concept with the use of technology.
The study hypothesizes that angle can be learned using interactive software. The students can move the dynamic diagrams around and see what changes with different types of angles. It provides ways for students to dynamically visualize a topic that may seem unimportant or lacking life applications from the student’s perspective. They can see why this information is important, how the properties fit together, have a better understanding of the concept and take ownership of what they have learned. “When students work hard to solve a difficult problem or to understand a complex idea, they experience a very special feeling of
accomplishment, which in turn leads to a willingness to continue and extend their
engagement with mathematics” (NCTM, 2000, p. 21). DGS may help students’ conceptual understanding of geometric concepts and other mathematical topics, but the way in which the software is incorporated into the curriculum is not always the focus of the research.
constructions with DGS or discover new information using teacher-constructed diagrams while learning the concept of angle. This new research will contribute to the mathematics education literature as well as provide ideas for using DGS in the classroom.
Research Questions
This study focuses on answering the following research questions:
1. How do students learn the concept of angle supported by the use of dynamic geometry software and does the use of dynamic geometry software support diverse subgroups of students differently?
2. How is student learning of angle influenced by the use of student-constructed diagrams compared to the use of teacher-constructed diagrams using dynamic geometry software?
CHAPTER 2 LITERATURE REVIEW
The following sections of this chapter are divided into different subsections that were important to the development of the present study. The first section is called Angle
Comprehension and Misconceptions, which presents research about the complexity of angle,
the multiple definitions of angle and the numerous studies in which the understanding of angle has been investigated. The second section is Teaching with Technology; this section discusses the importance of technology in a mathematics classroom and how it has changed the traditional classroom learning experience. The third section, Dynamic Geometry
Software, explains the value of using DGS as students seek to understand geometry.
Angle Comprehension and Misconceptions
curriculum the definition of angle used is the definition described by Euclid. According to The Elements an angle is “the inclination to one another of two lines in a plane which meet
one another and do not lie in a straight line” (Health, 1956, p. 153). Euclid then continued to define angle introducing what we refer to in this research as the straight angle in which “the lines containing the angle are straight” this angle is called rectilinear (p. 153). According to Piaget and Inhelder, “It is the analysis of the angle which marks the transition from
topological relationships to the perception of Euclidean ones. It is not the straight line itself which the child contrasts with round shapes, but rather the conjunction of straight lines which go to form an angle” (Health, 1956). “When Euclid specified the rectilinear angles contain straight lines, he was suggesting that other angles could be composed of lines that are not straight” instead they are curved (Keiser, 2004, p. 297). This definition of angle is referred to as angle in a curve in the present study; these curves are arcs from circles. For example of an angle in a curve one could imagine a “horn-like” angle where the angle was “formed by a line tangent to a circle and the circle itself … or an angle could also be formed by two circles tangent to each other” (Proclus, 1970, p. 102). In this study, students do not address this definition.
With this understanding students sometimes misconceive how to measure the actual size of an angle (Mitchelmore & White, 1998; Wilson & Adams, 1992). Students do not understand the concept that the size of an angle has no dependency on the length of its rays (Munier & Merle, 2009, p. 1865).
Munier and Merle (2009) reported that a study conducted by Berthelot and Salin found that “three-quarters of all pupils cannot make sense out of the concept of angle unless it is presented in its primitive, schoolbook form, and that children have trouble recognizing an angle” (p. 1865). Close (1982) discussed the difficulty that students have the
understanding that two rays with the same endpoint actually compose two angles. According to Close (1982) students have a hard time understanding that these two angles add up to 360˚. Looking for ways to organize students understanding of angle, Mitchelmore & White (1998) conducted a study with a more comprehensive look at the students’ misconceptions and had the students categorize situations they saw everyday that implicitly concerned angles. The students’ categorized angle in seven classes with 14 subclasses as seen in Table 1.
Each of the three definitions of angle described in the introduction: angle as a rotation, a pair of rays that extend from a common point, and in a curve, were found within the Mitchelmore & White categories. These categories influenced the categories created by the researcher in this study; yet due to the different instruments used to instruct the students the researcher had to develop her own set of categories following the example set by
Table 1
Mitchelmore and White’s classification concerning angles.
Mitchelmore and White’s classifications
1. Real or imaginary rotation around a fixed axis (point)
a. Unlimited: rotation of the body (doll)
b. Limited: door knob or television dial
2. Meeting: an object comprised of two different linear elements
a. Incident: pocketknife blade, hands on a clock
b. Crossed: pair of scissors
3. Inclination: deviation from the horizontal or vertical
a. Line: posts on a mountain side
b. Plane: slope of a roof
4. Corner: part of a rigid object forming an angle with two visible sides
a. Two planes: that form an angle in space, such as walls and the ground
b. Two edges: that form a plane angle, such as the corner of a table or tile
5. Turning: in a series of two or more linear segments
a. Objects: turn in the road
b. Paths: of the LOGO tortoise, rebound of a ball
6. Direction: deviation of a line from an imaginary fixed line
a. Object: needle of a compass
b. Path: movement of a ball, a person, a boat
7. Opening: an area of space delineated by two rays originating at the same point
a. Solid: a fan
definitions can be introduced to students as early as elementary school. In order to better prepare students for future mathematics courses teachers should use a more comprehensive approach, presenting angle using the variety of definitions given throughout history (Keiser, 2004).
Teaching a diverse array of definitions may cause confusion about what is actually being measured when referring to an angle and therefore angle should be taught in great depth with concern for conceptual understanding as to reduce any misconceptions the students may gain with this multifaceted approach (Keiser, 2004). Keiser (2009) and Fyhn (2008) both reported that students struggled with measuring angle size; there need to be multiple ways of instruction to this complex concept in order for students to gain a deep understanding they so badly need in order to continue successfully in their mathematical journey. Along with the multifaceted approach allowing students to define angle themselves, share their ideas and debate their definitions during a classroom discussion lead by the teacher will improve their understanding of the concept (Keiser, 2004). Using multiple approaches and discussion to combine all the students’ definitions will help them gain a deeper understanding of the concept.
how the students’ conceptions were similar to previous definitions; “while analyzing the data I observed similarities between students’ descriptions of angle and definitions or descriptions that had been recorded since the time of Euclid” (Keiser, 2004, p. 286). Keiser (2004) also mentions another important aspect of how to present angle, which the present study used to promote conversation. Keiser (2004) discusses how allowing students to work together, share each other’s ideas and challenge those ideas about angle will consequently help the students develop a deeper understanding for the concept that can be applied to many situations (p. 304-305).
Supporting this type of collaborative work helped the students gain a wide range of understandings, not only for angle, but other geometric ideas as well (p. 288). Without this wide range of understanding students digress to their traditional method of learning
mathematics, which is to memorize facts or procedures without any understanding (Bransford, Brown, and Cocking, 1999, p. 152). A variety of definitions, discussion, multiple approaches and representations can lead students to step away from memorization and jump into understanding. This important use of communication, collaboration and understanding is incorporated in this study while the students work on their DGS instructional activities in pairs and at the end of the instructional activity where they summarize the information they discovered using the DGS.
The present study looks at the multiple definitions of angle, used DGS to help
the complex topic. Fyhn (2008), conducted a study in which students were to distinguish between larger and smaller angles among a group of angles (p. 24). Fyhn (2008) reported, “a widespread misconception is that a small angle has short sides and a large angle has long sides,” (p. 25). Only 30% of students could answer correctly on which angle was larger (p. 20). Of the 70% that didn’t answer the question correctly, they choose an angle with longer rays yet smaller measure between the rays to be the larger angle, which is a misunderstanding in the Keiser study as well as the study conducted by Munier and Merle (p. 20).
Clements and Burns (2000) also mention a different misconception held by students about the turn of an angle and how they find it difficult to measure turn. The definition of angle as a rotation introduces the concept of directionality (Clements and Burns, 2000). In order to master this concept Clements and Burns (2000) use a piece of DGS called LOGO. “LOGO activities can be beneficial to students’ development of turn concepts and turn measurement” (Clements and Burns, 2000, p. 31). LOGO provides a situation of visualizing the turn of an angle (Clements and Burns, 2000). Clements and Burns (2000) studied a group of “above-average” fourth grade students to participate in “pull out” enhancement meetings. “These above-average mathematics students did not show initial difficulties with turn
“that students did not pay much attention to left and right directionality. They appeared to understand the idea, but used strategies to circumvent thinking about directionality” (Clements and Burns, 2000, p.40). With the use of LOGO students can build active and flexible conceptual protractors unlike the traditional protractors used in everyday classrooms (Clements and Burns, 2000).
The previous studies report the problems students have with understanding the measure of an angle when everything is visible; therefore, when both sides are not visible it is no surprise that students would struggle even more with angle in this context (Fyhn, 2008). Mitchelmore and White (2000b) believed that it is more difficult for students to understand angle measure and identify angles when they appear as slopes, turns or any other situation in which one or both sides are not detectable. Wilson and Adams (1992) expanded upon this supposition; they felt it would be an easier concept for students to understand when they reach higher-level mathematics if angle were introduced to them in the elementary school setting in more depth than is currently in the elementary school curriculum.
Mitchelmore (1997) disagreed with Wilson and Adams. He posited that an angle in a curve is too complex for students to understand. He explained that a more viable
instructional sequence would start by looking for similarities between physical angle contexts that more clearly involve two lines, including crossing, corners, and bent objects
topics at the same time would be beneficial for students and improve their mathematics experience beyond the introduction of angle (Keiser, 2004).
Teaching with Technology
“In the mathematics classrooms envisioned in NCTM’s Principles and Standards, every student has access to technology to facilitate his or her mathematics learning under guidance of a skillful teacher” (NCTM, 2000, p. 25). This would be ideal yet is often unsupported by individual schools due to constraints and other outside influences.
Technology should not be used as a replacement for basic understandings and intuitions; rather, it can and should be used to foster those understandings and intuitions…. Electronic technologies, calculators and computers, are essential tools for teaching, learning, and doing mathematics. They furnish visual images of mathematical ideas, they facilitate organizing and analyzing data, and they compute efficiently and accurately. They can support investigation by students in every area of mathematics, including geometry, statistics, algebra, measurement, and number. (NCTM, 2000, p. 24)
Technology is expensive and takes more work for the teacher to learn and use the
With technology, students can create diagrams or figures to help them understand a concept and dig deeper than they previously have in their mathematics education. There are assortments of technologies that can be used to help students learn the concept of angle, or any geometry related concept. The DGS used for analyzing and drawing perspective views in this study “is an interactive geometry software package used to help students learn geometry principles” (Groman, 1996). “Tools such as dynamic geometry software enable students to model, and have an interactive experience with, a large variety of
two-dimensional shapes,” such as the terms used in the instructional activity of this study (NCTM, 2000, p. 40). The use of technology may be used to help students understand the concepts of angle by being able to manipulate the angle and see what does and does not change. Groman (1996) reports on a study with secondary math teachers using the same DGS used in this study to learn geometry themselves. The professor and the class of
teachers’ “reaction to the use of DGS in their geometry course was overwhelmingly positive” (Groman, 1996).
Dynamic Geometry Software
Students should be involved in their educational experience; they can gain a much deeper understanding of the concepts they are covering by doing the mathematics instead of simply watching teachers deliver the information to them. One good way to get students involved in their education and “doing” mathematics is with the use of technology.
through technology. Technology enriches the range and quality of investigations by providing a means of viewing mathematical ideas from multiple perspectives” (NCTM, 2000, p.25). Geometry software can provide dynamic diagrams that students can manipulate to understand concepts, which can’t be done with traditional paper diagrams (Hollebrands, Laborde & StraBer, 2008).
When an element of such a diagram is dragged with the mouse, the diagram is modified while all the geometric relations used in its construction are preserved. These artificial realities can be compared to entities of the real world. It is as if diagrams react to the manipulations of the user by following the laws of geometry, just like material objects react by following the laws of physics. A crucial feature of these realities is their quasi-independence from the user once they have been created. When the user drags one element of the diagram, it is modified according to the geometry of its constructions rather than according to the wishes of the user (Hollebrands, Laborde & StraBer, 2008, p. 167).
Unlike constructing diagrams with pencil and paper, DGS can help students not only
construct the diagrams but by being able to drag the points, lines, segments they can discover new information using previous knowledge (Skemp, 1976). Using previous knowledge with well-connected, conceptually grounded ideas provide a greater opportunity for students to gain a deeper understanding of the concept (Skemp, 1976).
pre-very well constructs and leads the learner through an investigation to explore the topic they constructed (Sinclair, 2003, p. 289). “Since the creator of an image knows details that are hidden from an ordinary viewer, interpreting a pre-constructed sketch is similar to
interpreting a picture that someone else has drawn” (Sinclair, 2003, p. 290). The pre-constructed diagrams are dependent upon the creator, “Thus, designing pre-pre-constructed dynamic geometry sketches to support the development of mathematical understanding, involves understanding visual reasoning and its relationship to dynamic exploration” as well as a complete understanding of the program being used (Sinclair, 2003, p. 290). One area to consider when looking specifically at DGS is the idea of the geometric concept “point”.
There are three different ways to consider point, which students can use to discover information (Hollebrands, Laborde & StraBer, 2008, p. 165). Hollebrands, Laborde and StraBer described the difference between a free point, a point on an object, and a constructed point. A free point is one “which can be directly dragged anywhere in the plane,” a point on an object is one in which the dragging of the point is limited to the object on which it is drawn, and a constructed point “moves only if an element on which it is dependent is dragged” (Hollebrands, Laborde & StraBer, 2008, p. 165). DGS uses a sequence of
operations to construct a diagram, thus the elements in the diagram are dependent upon one another (Hollebrands, Laborde & StraBer, 2008). “The notion of dependency is the
With the flexibility of the three different types of points that can help students’ comprehension of certain aspects of a diagram, there are also three different types of dragging modalities (Hollebrands, Laborde & StraBer, 2008, p. 179). They present these three types of dragging:
wandering dragging, “lieu muet” dragging, and dragging to test hypotheses. Wandering dragging refers to a random type of dragging in which the student searches for regularities or interesting behaviors. Lieu muet dragging refers to
dragging in such a way that some regularity in the drawing is preserved. Dragging to test hypotheses obviously presupposes that regularities have already been detected which are now systematically tested (Hollebrands, Laborde & StraBer, 2008, p. 179). No matter which type of dragging the student uses, when the user drags one element of a diagram, it is modified according to how the shape was constructed and the properties of the shape, instead of the thoughts and wishes of the user (Strässer, 2002). This is not the case with the traditional paper and pencil diagrams in which students can distort in order to prove something that they think might be true, instead of the actual facts of the geometric
construction (Strässer, 2002).
Students may learn properties of the geometric representations with DGS, since the properties hold according to the constructions, and there could be fewer misconceptions due to the manipulation of the diagrams. There are numerous studies that have been conducted about the use of DGS in geometry classrooms. Angle and other introductory terms in
They would have to make multiple drawings to help show each property for each introductory term. Students can construct the terms and move them around to see all the different
properties, unique to each term, at their own pace and with their own adaptation of angle without making multiple drawings.
Mitchelemore and White (2000b) advocate a teaching method called ‘teaching by abstraction’, wherein ‘students become familiar with several examples of the concept before teaching the concept itself.” This kind of teaching works well with dynamic diagrams if it involves some exploration of the concept (familiarity). Then ‘the concept is taught by finding and making explicit the similarities underlying familiar examples of that concept’ (similarity). Lastly, ‘as students explore the concept in more detail, it becomes increasingly mental object in its own right’ (reification). (Munier & Merle, 2009, p. 1861). These authors thus argue for having students do activities in which they model the world of the senses and jointly acquire spatial and geometric knowledge. These two approaches which work well using DGS contrast to traditional methods where ‘abstract concepts and procedures are taught before concrete examples and applications’ (called the ABC method by Mitchelmore and White (2000b)). It connects to the NCTM standards, which also recommend
interrelating geometric and spatial knowledge: Geometric ideas are useful in representing and solving problems in other areas of mathematics and in real-world situations … Spatial
reasoning is helpful in using maps, planning routes, designing floor plans, and creating art. (NCTM, 2000, p. 41).
tool” seen in a variety of DGS (p. 293). “Dragging allows changing a shape by direct translation of parts of its components on the screen… dragging the shape preserves the geometric relations according to which is was initially defined. Thus the critical attributes associated to this definition are preserved during dragging but the non-critical attributes are changed” (Erez & Yerushalmy, 2006, p. 274). The results of the study conducted and described in this report support using DGS to help students explore and define basic geometric terms as shown in the instructional activity of the investigation.
Another study by Frank Monaghan (2000) brought about similar results as the study by Erez & Yerushalmy (2006). “In this study, the cognitive conflict is brought about by asking students to describe in their own words the differences between pairs of
quadrilaterals” (Monaghan, 2000, p. 180). Monaghan’s (2000) underlying assumption is that students will gain a deeper understanding through conversation and hopefully reveal insights about quadrilaterals with the use of software and class activities creating an environment in which students can learn and share their discoveries (p. 180). After the study, “what emerges is that students over-rely on standard representations of shapes as a means of identifying and discriminating between them. It was shown that curriculum materials tend to underpin such perceptions” (p. 192). The study concluded that these misconceptions about quadrilaterals would be reduced using software to aid the instructional activity, allowing students to explore their ideas about quadrilaterals.
the information underpinning the analysis of the ratio of sides in rectangles was generated in a matter of seconds” (2000, p. 193) with the use of software, which was never generated with student discussion without the use of technology. Being able to save time in a classroom is beneficial; it can create time for a deep discussion or extension of the topic. Monaghan’s study supports the use of DGS in the investigation in order to gain an understanding of mathematical concepts and the pairing of students because working in groups will allow discussions that will deepen the understanding of the concept being covered in the investigation.
MacGregor and Thomas conducted a study in 2002 involving the value of DGS in the classroom. The study consisted of a control group with a lecture based learning environment and the other group of students explored the material through an investigation with DGS. Although the study concluded that “the instructional model where the teacher provided structure and directed the problem solving activities of the students resulted in learner outcomes characterized by greater understanding of the concepts and less frustration” using the software it still supported the use of DGS due to the progress shown without frustration. Although the students were frustrated with the investigation, which the study reported might be due to the fact that the teacher and the students were uncomfortable with the software, they “expressed a sense of self-confidence and pleasure with their accomplishments” and learned a great deal of material with the software through discussion and exploration (MacGregor & Thomas, 2002).
learning similar to the investigation created by Keiser (2004), thus “permitting students to share and challenge each other’s ideas which helps students develop a more complete
concept image - one that can be applied to many different situations” (p. 304-305) and would seem to be more comprehensive and a better preparation for higher level mathematics. The researcher chose to use DGS in the present study to promote student understanding because students will be able to drag around objects in order to gain a better understanding of the terms as validated in the previous studies.
Conclusion
CHAPTER 3 METHODOLOGY
Purpose and Overview of Study
This study was situated in two different Geometry classes in a large urban high school. The goal of the study was to answer the research questions:
1. How do students learn the concept of angle supported by the use of dynamic geometry software and does the use of dynamic geometry software support diverse subgroups of students differently?
2. How is student learning of angle influenced by the use of student-constructed diagrams compared to the use of teacher-constructed diagrams using dynamic geometry software?
These questions frame the overarching idea of researching whether using teacher-constructed sketches, called pre-constructed sketches by Sinclair (Sinclair, 2003, p. 289) or student-constructed sketches were more effective when teaching angle. The two classes are referred to as the student-constructed diagram (SCD) class and the teacher-constructed diagram (TCD) class. Each class was given the same pre-test, post-test and clinical interview but the two classes participated in a different set of instructional activities. The students in the SCD class were given definitions of introductory terms in geometry and asked to construct
document) pictorial representations of the same terms as in the student-constructed instructional activity and asked to provide the definitions to go along with the pictorial representations. The following chapter presents the description of the subjects and
investigator involved in the study, the materials used for the study, how the study is designed including the theoretical framework which emerged, and the procedures used for the analysis of the data.
Setting
The study took place in two different high school classrooms at the same urban school located in a large city in the Southeastern United States. The two classes were both academic geometry classrooms using the same curriculum and with the same teacher, in this case also the researcher. Academic geometry enrolls a diverse group of students who are taking regular level, non-honors courses. The study took place in the spring of 2010; it started at the end of January and was completed by the end of April. Although the study used technology, the classroom was without computers. For the days in which the students needed a computer, they went to a lab in the school. During the study the students worked in pairs to promote dialogue.
bachelor’s degree in mathematics education and is pursuing her Master’s Degree in Mathematics Education.
Subjects
There were 27 students in two different high school academic geometry classrooms in the spring of 2010. In the SCD class, there were 7 females and 8 males, with more than half of the students being black or Hispanic. In the TCD class, there were 8 females and 4 males with the majority of the students being black. The specific demographics of the subjects can be found in the Table 2 and Table 3.
Table 2
The demographics of the subjects who used DGS with student constructed diagrams.
Subjects Sex Race Age Geometry Grade after the study
Subject 1 Female White 17 C
Subject 2 Male White 17 B
Subject 3 Female Black 15 C
Subject 4 Male Black 16 B
Subject 5 Male White 15 C
Subject 6 Male White 17 D
Subject 7 Male Hispanic 16 A
Subject 8 Male Black 16 B
Subject 9 Male White 16 C
Subject 10 Female Black 16 C
Subject 11 Male Black 15 C
Subject 12 Female Hispanic 15 A
Subject 13 Female Black 16 F
Subject 14 Female Black 16 B
Table 3
The demographics of the subjects who used DGS with teacher-constructed diagrams.
Subjects Sex Race Age Geometry Grade after the study
Subject 16 Female Black 15 C
Subject 17 Female Black 17 F
Subject 18 Female Asian 17 C
Subject 19 Female Black 16 D
Subject 20 Female Hispanic 15 B
Subject 21 Female Black 16 C
Subject 22 Female Black 16 D
Subject 23 Female Black 16 A
Subject 24 Male Black 16 B
Subject 25 Male Black 16 B
Subject 26 Male Black 17 D
Subject 27 Male White 16 B
Table 4
The educational background of the subjects who used DGS with student constructed
diagrams.
Subjects High School MathIntroduction to Semester Algebra I Year-‐long Algebra I Geometry
Subject 1 ___ ___ C ___
Subject 2 ___ C ___ ___
Subject 3 ___ B ___ ___
Subject 4 B B ___ ___
Subject 5 ___ C ___ ___
Subject 6 C D ___ ___
Subject 7 ___ B ___ ___
Subject 8 ___ C ___ ___
Subject 9 B D ___ F
Subject 10 ___ B ___ ___
Subject 11 ___ C ___ ___
Subject 12 ___ B ___ ___
Subject 13 ___ FF, C ___ ___
Subject 14 ___ C ___ ___
As far as the educational background, Table 4 and Table 5 illustrate the mathematics courses the students had completed before taking the academic Geometry courses. The letters represent the grades they earned in those courses, a grade of FF is given to students who fail the course due to lack of attendance.
Table 5
The educational background of the subjects who used DGS with teacher-constructed
diagrams.
Subjects Algebra I Semester
Year-long
Algebra I Technical Math I, II Geometry
Honors
Geometry Algebra II Semester
Subject 16 C ___ ___ ___ ___ ___
Subject 17 C ___ ___ ___ ___ ___
Subject 18 C ___ ___ ___ F ___
Subject 19 ___ D D, D ___ ___ ___
Subject 20 C ___ ___ ___ ___ ___
Subject 21 F, D ___ ___ ___ ___ ___
Subject 22 D ___ ___ ___ ___ ___
Subject 23 ___ C ___ F ___ ___
Subject 24 F, C ___ ___ ___ ___ B
Subject 25 B ___ ___ ___ F ___
Subject 26 ___ D ___ ___ ___ ___
Subject 27 C ___ ___ ___ ___ ___
students had previously taken Geometry, one had previously taken Algebra I more than once, one student had previously taken Algebra II, and one student had previously taken both Technical Math I and Technical Math II. Each of the subjects was first introduced to DGS in the current geometry classroom.
Design of the Study
The study consisted of a pre-test for all students, instruction using DGS in two different formats as described previously, a post-test for all students and a clinical interview for a portion of the subjects.
Table 6
Design of the study
Activity Time-‐length
Pre-‐test for both classes 45 minutes on Day 1
Instructional activity both classes 270 minutes on Day 2, 3, and 4
Post-‐test for both classes 45 minutes on Day 5 which was 4 weeks after the completion of the instructional activity
5 student clinical interviews 20 minutes each on a different day 8 weeks after the completion of the instructional activity
understanding of angle using dynamic geometry software Post-Test. The instructional activity for the SCD class of students was designed to have the students construct their own diagrams related to angle using the technical definitions of the important introductory terms of the course. The instructional activity can be found in the appendices under Appendix E: Discovering Geometric Diagrams with Dynamic Geometry Software, which shows the terms defined, including angle, different classifications of angle and angle pair relationships. The instructional activity for the TCD class can be found in the appendices under Appendix F: Discovering Geometric Definitions with Dynamic Geometry Software. This instructional activity was a student-centered investigation in which the students were guided through already constructed diagrams of the same introductory terms used in the first instructional activity. In this instructional activity the subjects used teacher-constructed terms and the dynamic pre-constructed diagrams to lead them to the definitions of the same terms that the SCD class was given.
Allowing this type of collaborative work helped the students gain a wide range of understandings (Keiser, 2004). Collaborative pairs are shown to be more beneficial than independent learning or root memorization. “Teaching methods that foster learning mathematics by memorization and reproduction of procedures can be contrasted with the more open approaches in reform-orientated mathematics classrooms, where quite different learning practices such as discussion and collaboration are valued in building a climate of intellectual challenge” (Goos, 2004, p. 259).
Data Collection
On the first day of the study the subjects were given a brief overview of the study. This overview introduced the subjects to educational research and the policies used. Their part in the study was explained to them and they were told they could stop at any time they choose without consequences. The teacher explained the pre-test, instructional activity and post-test, without disclosing any information of the research questions or the purpose of the study. Each subject was given a consent form that was signed by all the parents of the participants since they are underage, the consent form can be found in Appendix A. The subjects in the clinical interviews were given an additional consent form, found in Appendix B, for videoing purposes that were also signed by all of the parents of the consenting
students.
angle, and their understanding of other terms related to angle. Although there were nine questions, only eight of them were used for analysis due to the difference in question eight on both the pre-test and post-test. After the pre-test the students participated in three days of instructional activities on angle. Although, each instructional activity used completely different procedures to help the students develop an understanding of angle, the purpose was the same. After a very brief introduction of the software, the students had to familiarize themselves with the software in order to be able to create any of the diagrams or explore the already constructed diagrams.
The researcher did not give an in-depth introduction of the software considering the students would be defining and exploring some of the elements of the DGS and the
researcher wanted to prevent the students from gaining any understanding of the terms from the researcher before the investigation. The students were taken to a computer lab where they were assigned a partner but each student had his/her own computer. The students were seated beside their partner in order for both students to use the software and be able to discuss their findings with the other. The students were advised to complete responses on worksheets that consisted of directions for the students to use and blanks for students to fill in with responses.
activity asked about any new findings found after drawing the diagram, the students did not investigate their own drawings. This limited their ideas since the dragging tool is one of the great benefits of using DGS. The dragging tool helps students ground their hypothesis and conjecture about certain terms because the construction holds the characteristics of the term as constructed in the software. Therefore, they could discover new aspects of the term that were not in the definition with the use of dragging.
The limited introduction of the software caused some frustration at the beginning of the instructional activity for the student-constructed class but the frustration diminished as the students progressed through the first few definitions. As the researcher was walking around it was evident that the student’s frustration with the software in the student-constructed class was short-lived and did not greatly hinder their understanding of the geometric terms. If the researcher were not familiar with the software it could have been more frustrating for the students and may have affected their conceptual understanding. Yet, since the researcher was very experienced with the software she questioned the students in a manner not to reveal the answer but provide them the means to find it using the software.
were asked a series of questions that can be found on Appendix C and Appendix D in order for the researcher to gain some insight about how each individual student used the software, benefited from the software, and could draw connections between the topics after the use of the software.
After the students in both classes completed the three days of instruction using the DGS class continued as normal, going through the curriculum until a month had passed. After a month the students were given the post-test, Appendix F. There were also nine questions in the post-test similar to the questions in the pre-test. Although they were
different tests, the questions were superficially different yet conceptually the same. The only question that differed conceptually was question 8; therefore, it was not used in the analysis of the study. The pre-test and post-test were used to compare the results in order to discover if the students showed a deeper understanding of angle due to the instructional activity, if any subgroups of students gained a better understanding with the instructional activity, and if one activity was more efficient than the other.
Data Analysis
Data analysis consisted of both qualitative and quantitative analysis. In this section, the researcher first describes the qualitative analysis, which involved using the theoretical framework from earlier research and other grounded coding. Then she describes the quantitative analysis.
Qualitative:
After the collection of data in the pre-test, instructional activity, post-test and interviews all of the written responses from the pre-test, instructional activity and post-test were entered into a spreadsheet in order to make conjectures from patterns throughout the subjects and the questions (Miles & Huberman, 1994). The written responses from the pre-test, instructional activity and post-test were then color coded to represent the subjects
understanding of the concept being asked. The color coding was as follows: green was given to a response that was conceptually strong, yellow was given to a response that showed some conceptual understanding yet contained some misconceptions about the topic, and pink represented a lack of understanding of the topic being discussed.
After the researcher identified the common misconceptions the students possessed before the study by analyzing the coding of the pre-test, the researcher started considering categories or levels of some sort to demonstrate students’ conceptual understanding of angle. While studying the data, the researcher needed to decide whether categorization or levels of understanding would best fit this study; the researcher considered these possible
categorizations and levels described below in order to make her decision: 1. Piaget’s stage theory of development: “They defined three stages of
development between the ages of two and 11 years. At state 1, children can only recognize familiar objects, not shapes. At Stage 2 (pre-operatory level), they grasp topological (inside-outside, open-close) as well as rectilinear and curvilinear relations, but not metric or Euclidean relations. At the final stage (operatory
level), children start to apply metric and Euclidean ones” (Munier & Merle, 2009, p. 1859).
2. van Hiele’s levels: Similar to the Piaget’s stages yet “progressing from one stage to the next depends more on the teaching method adopted than on age, and this makes the geometry-related experiences of the child a determining factor” (Munier & Merle, 2009, p. 1860).
3. Mitchelmore & White (1998) categories, which can be found in Table 1 in Chapter 2.
needed to assess students’ conceptual understanding of angle. The researcher took their categorization table and the data given by the students and created similar categories in this study. After the researcher created the categories for this study the researcher consulted a second researcher in the same department for confirmation and collaboration.
The researcher decided to use categories due to the fact that one cannot say if a student understands an angle better, if they understand angle as defined by Euclidean geometry or as a rotation about a single point as well as the dependency upon instruction in this study. Therefore the researcher created the categories in Table 7 and Table 8 to analyze the students’ conceptual understandings of angle. Since there are multiple definitions of angle, there are more than one category used to classify the students using the definitions described earlier that were created by Mitchelmore and White (1998). After the data was analyzed it was obvious that there was no need to create categories for angle as a sector due to the limited amount of evidence that showed understanding of angle in this manner evident throughout the study. There were categories created for the other two definitions as shown: Euclidean in Table 7 and angle as a rotation in Table 8.
Table 7
The categories for angle as defined in Euclidean geometry.
Category Definition
A0 Subject shows no comprehension of angle.
A1 Subject understands angle as a single fixed measurement.
A2 Subject understands angle as multiple fixed measurement, such as right, acute, obtuse or straight.
A3 Subject understands angle as an intersection of two lines, or two lines that meet as a point.
A4 Subject understands angle as a bending line with an array of measurements
A5 Subject shows a complete conceptual understanding of angle as defined in Euclidean geometry
Table 8
The categories for angle as defined by a rotation about a single point.
Category Definition
B0 Subject shows no comprehension of angle as a rotation about a point. B1 Subject understands angle as a single rotation about a point.
B2 Subject understands angle as a variety of rotations about a single point . B3 Subject shows a complete conceptual understanding of angle as a
rotation about a single point.
three different phases for categorization purposes: The pre-test and introductory terms, classifications and relationships, postulates and post-test.
Question
1. Out of the different diagrams below please identify the angle
2. Draw your own diagram of an angle.
3. Draw an angle that measures approximately 30 degrees.
4. Draw two angles that are complementary to each other.
Subject 1 Correct
Correctly drew an angle, yet missing the
points. Correct Drew congruent angles
5. Define angle with detail.
6. What is the difference between angle and square?
7. Draw a picture with 6 angles in it and identify the angles.
9. How many angles are in the diagram below? Identify them and describe why they are angles.
Personal Student Gain Scores
"an angle is where two
lines meet" "a square is closed" Incorrect
"8 they are angles
because they meet together"
7
Figure 1 - Coding of Subject 1's Pre-test
A portion of the students volunteered for clinical interviews. The interviews were analyzed and transcribed in order to determine their conceptual understanding of angle at the end of instruction and whether the software was beneficial while they developed their
analyzed in order to find any more emerging patterns while seeing if the patterns noticed in the previous analysis were also seen in the interview.
Quantitative:
The categorization and scoring described above was used to compare students gain scores from the pre-test to the post-test. The scores were analyzed using statistical software to perform a paired t-test. A paired t-test was used to see if the means on these two normally distributed interval variables differ from each other. A paired t-test is used when you have two related observations (for example, two observations per subject, in this case pre-test and post-test) (Rao, 2007, p. 143). In each case, the null hypothesis was that the results of the pre-test and post-test were equal and the alternative hypothesis was that they were different. The results of the t-tests were used to see if either, or both, methods of instruction were beneficial to student learning of angle. Additionally, was learning with student constructed diagrams or teacher constructed diagrams more beneficial was analyzed. Finally, the
CHAPTER 4 – RESULTS
Throughout the study the use of dynamic geometry software improved students’ understanding of angle for both classes. In addition, during the analysis of the pre-test, instructional activity, post-test and interviews a few patterns emerged from the data as described in the sections below. The following sections report the results of these quantitative and qualitative analyses
The results from analyzing the quantitative data are first presented. Then the results from the pre-test for each class section are explained together as they were analyzed together. Since each student came from different Algebra I class’s it was important to see where they were as a whole to see how their understanding of angle as a class had changed after the instructional activity. Then each student’s responses are analyzed based on which
instructional activity the class used, first the student-constructed class and then the teacher-constructed class. The five interviews are next presented. Finally, the individual class results including the commonalities between the classes are compared and summarized.
Paired T-Test - Quantitative Data Analysis
post-test) (Rao, 2007, p. 143). The result of the t-test was used to see if either, or both, methods of instruction were significant. The results from the paired t-test are reported in Tables 9 – 21. The null hypothesis of the paired t-test performed in Table 9 is assuming that there is no difference between the students’ score on the pre-test and the post-test,
€
H0:µd ≤D0. The alternative hypothesis is assuming that the use of the software did in fact affect the students’ scores on the post-test in comparison to the pre-test scores for the SCD,
€
Ha:µd >D0.
Table 9
The t-test statistics for the SCD class.
Difference N
Lower CL
Mean Mean
Upper CL Mean
Lower CL Std
Dev Std Dev
Upper CL Std Dev
Standard Error Pretest-‐
posttest 15 -‐3.495 -‐2 -‐0.533 2.5939 3.5429 5.5876 0.9148
Difference df T-‐value Pr > |t| Pretest-‐posttest 14 -‐1.68 0.1159
shows evidence that the instructional activity did help the students improve their level of understanding but not as much as the investigation from the TCD class.
The null hypothesis of the paired t-test performed in Table 10 is assuming that there is no difference between the students’ score on the pre-test and the post-test,
€
H0:µd ≤D0.
The alternative hypothesis is assuming that the use of the software did in fact affect the students’ scores on the post-test in comparison to the pre-test scores for the TCD,
€
Ha:µd >D0.
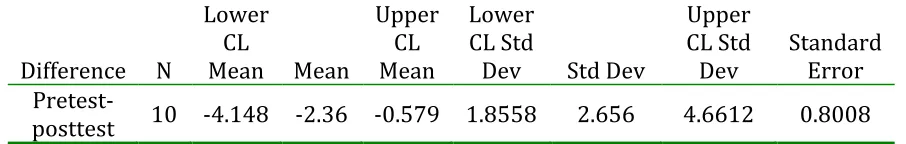
Table 10
The t-test statistics for the TCD class.
Difference N
Lower CL
Mean Mean
Upper CL Mean
Lower CL Std
Dev Std Dev
Upper CL Std Dev
Standard Error Pretest-‐
posttest 12 -‐4.934 -‐2.92 -‐0.899 2.2495 3.1754 5.3915 0.9167
Difference df T-‐value Pr > |t| Pretest-‐posttest 11 -‐3.18 0.0087