UNIFIED DATABASE SCHEMA FOR NORTH CAROLINA
DEPARTMENT OF TRANSPORATION
Stephen Alan Sherk
Dr. William J. Rasdorf
Project Report
TABLE OF CONTENTS
1.0 INTRODUCTION
51.1 Background 5
1.2 Purpose 5
1.3 Scope 6
1.3.1 Existing Databases 6
1.4 Database Design Considerations 8
1.4.1 GIS Interface 8
1.4.2 Spatial Database Interface 8
1.4.3 Existing Application Programs 8
1.4.4 Future Data Needs 8
1.4.5 GPS 8
1.4.6 Data Maintenance and Management 9
1.4.7 Data Acquisition and Reporting 9
1.4.8 Data Migration 9
1.4.9 Regeneration of Existing Database 10
1.4.10 Data Dictionary 10
1.4.11 Data Dictionary Analysis 10
1.5 Ownership & Responsibility 11
1.6 Data Structures at NCDOT 11
1.7 Organization 12
1.8 Format 13
2.0 LRS SOLUTION
142.1 LRS Definition 14
2.2 Importance of LRS to GIS 14
2.3 Summary of Recommendations 15
2.4 Advantages of Recommended LRS 15
2.5 Database Use of the LRS 16
3.0 TRAFFIC SURVEYS, FORECASTING, AND PLANNING
173.1 Background 17
3.1.1 Traffic Surveys 17
3.1.2 Traffic Forecasting 17
3.1.3 Traffic Planning 18
3.2.1 Survey Programs 18
3.2.2 Program Details 19
3.3 Data Issues and Obstacles 21
3.4 Proposed Traffic Information System 22
3.5 Data – Conceptual Description 23
3.6 Existing Databases 24
3.6.1 Continuous Count Program (ATR) 24
3.6.2 Coverage Count Program (PTC) 26
3.6.3 Vehicle Classification Program 27
3.6.4 Weigh in Motion Program 28
3.6.5 Intersection Studies (Turning Movements) 28
3.6.6 Origin and Destination Program 29
3.6.7 Drawbridge Division 30
3.6.8 Ferry Division 30
3.7 Relational Conversion of Data Structures 31
4.0 GEOGRAPHIC INFORMATION SYSTEMS
354.1 Background 35
4.1.1 Changes/Additions to the State Highway System 35
4.1.2 GIS Maps 36
4.1.3 Linking Attributes 36
4.1.4 Routes & Sections 37
4.1.5 Dynamic Segmentation 37
4.1.6 Highway Performance Monitoring System (HPMS) 38
4.2 Major Applications 39
4.3 Data – Conceptual Description 39
4.4 Existing Databases 40
4.5 Relational Conversion of Data Structures 42
5.0 TRAFFIC ENGINEERING
455.1 Background 45
5.2 Major Applications 45
5.2.1 Highway Safety Management 46
5.2.2 Highway Safety Planning and Analysis 46 5.2.3 Highway Safety Improvement Program 47
5.2.4 Railroad Safety Management 47
5.2.5 Special Projects 48
5.3 Data Issues and Obstacles 48
5.3.3 Stakeholder Needs 51 5.3.4 Needs and Objectives beyond the DMV Scope 52
5.4 The Crash Reporting System 52
5.5 Other Data Sources 53
6.0 PAVEMENT MANAGEMENT
546.1 Background 54
6.2 Major Applications 54
6.2.1 Pavement Design 54
6.2.2 Pavement Analysis 55
6.2.3 Data Collection and Training 56
6.2.4 Pavement Management System 57
6.3 Data Issues and Obstacles 58
6.4 Data – Conceptual Description 58
6.5 Existing Databases 59
6.6 Relational Conversion of Data Structures 63
7.0 UNIFIED DATA STRUCTURE
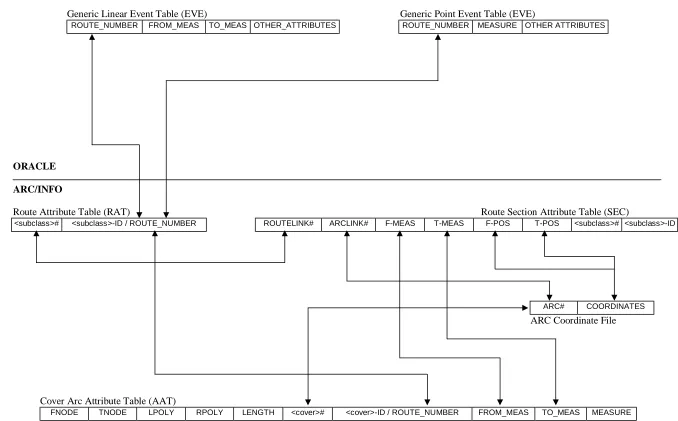
657.1 The Unified Data Structure’s Link to ARC/INFO 65 7.1.1 The ARC/INFO Dynamic Segmentation Model 65
7.1.2 ARC Coverage 67
7.1.3 Route Attribute Table 67
7.1.4 Section Attribute Table 68
7.1.5 Event Tables 68
7.2 Database Population 68
7.2.1 Map Maintenance 70
7.3 The Conceptual Unified Database Topology 71
7.4 Generic Example: Implementation Including Topology and Attributes 73
7.4.1 Spatial Data 73
7.4.2 Non-Spatial Data 74
7.5 LRS Filter Programs 75
7.6 NCDOT ARC/INFO Example Implementation 75
7.7 Spatial Topology – Special Cases 79
7.7.1 Double Line Graphics vs. Single Line Graphics/Directionality 79
7.7.2 Looping Routes 80
7.7.3 County Lines 80
7.7.4 Bridges 81
7.7.5 Ramps 81
7.7.6 Discontinued Roads 82
7.9 Joining Tables with Different Attributes 84
7.9.1 Sample Join Operation 85
7.9.2 LRS Join Example 86
7.9.3 Example LRS Join Operation 88
8.0 KEY RECOMMENDATIONS AND SUMMARY
908.1 Key Recommendations 90
8.2 Future Work 91
8.3 Summary 91
9.0 ACKNOWLEDGEMENTS
9310.0 REFERENCES
941.0 INTRODUCTION
This chapter provides a general description of the overall objective of this report. Several terms are introduced, which will be used throughout the report. The chapter introduces the concept of a unified database and identifies the steps needed for its ultimate implementation. The primary stakeholders involved in the development and use of the unified database are also introduced.
1.1 BACKGROUND
With the advent of advanced information technologies such as Geographical Information Systems (GIS), database management systems (DBMS), etc., the North Carolina Department of Transportation (NCDOT) has recognized the need to provide universal access to data. The NCDOT’s main objective is to create an environment where data can be universally retrieved in a graphical GIS format or in a non-graphical database format. But before any work in the centralized database design could be accomplished a number of issues needed to be resolved.
The NCDOT began a three-part study that involved: (1) determining the most effective linear referencing system (LRS) for NCDOT’s needs; (2) database design, processing, and development with attention given toward the types of data analysis functions performed by NCDOT, standardizing data terminology, and determining the shared data needs of the participating business and engineering units; and (3) providing recommendations for the development and standardization of attributes for the database. The first part of this study, which seeks to determine the most effective LRS scheme for NCDOT’s needs, has been completed. The results of their study are summarized in Chapter 2. The main reason for summarizing the LRS is because it is intrinsically tied to the database model that is described in this report.
This report is concerned primarily with the third task outlined above. The Statewide Planning Branch desires to efficiently combine tabular and spatial data into an integrated system to support queries; applications; data entry and maintenance; and report generation, to the extent possible, from both the GIS and the Database Management System (DBMS). The development of a data and information management system that achieves these objectives was sought and one model for this system is presented herein.
1.2 PURPOSE
The purpose of this report is to present a unified relational database model for NCDOT. This database is designed to contain all data from the units herein referenced. It must support the standard queries of interest to these units; it must support the data needs of their application programs; it must provide the reporting capabilities they need; and, it must support the data entry and management functionality required. Furthermore, it must provide seamless integration with GIS.
ORACLE. The purpose in developing the unified database is to make data entry more efficient, data query more manageable, and effective data exchange a reality among the participating units.
1.3 SCOPE
The unified database is designed to meet the needs of a specified set of individual DOT units including Statewide Planning (Traffic Surveys, Forecasting, and Planning), GIS, Traffic Engineering, and Pavement Management, herein after referred to as the “stakeholders. It must be able to meet all of the data demands placed upon it from each of these units. A relational database design is proposed herein to provide a more manageable and expandable data environment than is currently in use. Next, a conversion of the existing databases of the stakeholders to a relational format is presented with a further refinement to create a unified relational database structure.
1.3.1 Existing Databases
There are presently many existing databases in use within NCDOT by the stakeholders. One objective is to review the scope, nature, content, field definitions, and use of the existing databases and the attributes they contain, to gain an understanding of the data resource needs as currently embodied in existing data files. This is critical so that the design of a proposed new relational DBMS meets the existing needs of the stakeholders and accommodates all of their data.
The following are databases currently maintained by NCDOT. The majority of these databases will be explained in greater detail in succeeding sections. The existing databases include:
1. Traffic Surveys Unit – Data Provider
Database Name Format/Source
a) Annual Average Daily Traffic Data (AADT) Mainframe
b) Special ADT Counts Access
c) Turning Movements Access
d) Vehicle Classifications Access
e) ATR Data ASCII
2. Traffic Planning Unit – Data User
3. Traffic Forecasting Unit – Data User
Not generating any databases. Develops reports that contain future traffic projections for existing and proposed roads. The unit needs access to various databases.
4. GIS Unit – Data Provider
Database Name Format/Source
a) Mileage Inventory (Universe File) Mainframe b) Street Name Inventory (Secondary Roads) Mainframe c) Location Inventory (Feature File) Mainframe d) Supplementary Mileage Inventory Mainframe
e) Various GIS Data ARC/INFO
5. Traffic Safety Unit of Traffic Engineering – Data Provider/User
Database Name Format/Source
a) Crash Database (w/DMV) MERGE System b) Street Name Directory Mainframe
c) Ordinance Database Mainframe
6. Other Units Traffic Engineering – Data Provider
Database Name Format/Source
a) Sign Inventory N/A
b) Signal Inventory Mainframe
c) Railroad Crossing Oracle
d) Traffic Control N/A
7. Pavement Management Unit – Data Provider
Database Name Format/Source
a) Pavement Inventory Oracle
8. Other Data Sources – These databases are not treated in this report. However, they are important databases and should be addressed in any future work.
Database Name Format/Source
a) Bridge Inventory Mainframe
b) Functional Classification Mainframe
c) Paving Priority Mainframe
1.4 DATABASE DESIGN CONSIDERATIONS
The primary focus of this report is on database design. The main goal is to develop a structure for the relational database itself, i.e., to determine its content and organization. At the same time, consideration is given to a number of other design considerations as enumerated below. The reader is cautioned, however, that these items have not been fully treated in this report, and will be considered in detail in a future study.
1.4.1 GIS Interface
The unified relational database should support direct and seamless integration with the GIS so that data entry, searching, and queries can be issued via the GIS directly to an ORACLE relational database. That is, the database should support traditional GIS spatial queries and analysis as well as the broad range of capabilities normally provided by a relational DBMS. This report provides a conceptual model for the integration of the database to the relational DBMS. This is treated in section 7.1.
1.4.2 Spatial Database Interface
At the same time, any spatial data access or capabilities currently in use by the stakeholders must be able to be performed directly on the relational database itself (through the use of the DBMS) in addition to being able to be performed by the GIS. These include, in particular, spatial search and spatial queries. A working interface design is not presented in this report. However, section 7.4 provides a generic example of the implementation of spatial topology and attributes.
1.4.3 Existing Application Programs
This report includes a review of the existing computer application programs used by each of the stakeholders. One major objective of this report is to identify the scope, nature, content, field conditions, and use of the required input and output of these applications to effectively support NCDOT’s data needs. All data items that are required to support these application programs must be included in the database schema.
1.4.4 Future Data Needs
There should be communication with each of the stakeholders to identify new data item needs that can appropriately be incorporated into the overall database design. Thus, not only should the new database design take into consideration existing applications, but it should also take into consideration projected data needs to support new applications. Future data needs are addressed throughout chapters three through six. These chapters detail the types of present and future data attributes related to each participating business unit.
1.4.5 GPS
object given a location. The former is a measurement (i.e. surveying) and the latter is navigation and it is used in ships, cars, and cargo trucks. Today, more and more organizations are using GPS for collecting location data. Section 5.2.1 provides a discussion on the use of GPS by state law enforcement agencies.
The proposed LRS primarily uses unique road identifiers (LRS-ID’s) and mileposts to locate linear attributes. That is, it determines location by measurement along a line from a starting point regardless of the path that the line takes. GPS, on the other hand, determines location as a precise position in space and its measurement system is a coordinate system.
GPS coordinates are not mileposts or linear measures. However, GPS can be incorporated into the unified database by providing accurate coordinate positions for nodal entities such as intersections and county boundaries. These coordinate positions can be converted to mileposts through the application of conversion programs. Or, they can simply be stored as coordinates (as attributes in the database) and programs can be written to use them as needed by a particular organizational unit.
One possible dilemma is that GPS can be more accurate than digitized GIS maps. This could result in the incompatibility of location data. That is, an existing point, as stored in GIS, may be positioned differently than the GPS coordinates of that point. For example, consider the GIS lines representing our most accurate positioning of a highway. A GPS point measurement of the highway centerline might yield a location that does not even land closely on the GIS line. If not, how is the GIS line-work adjusted? This is a future issue that must be resolved as GPS units become more widely used.
1.4.6 Data Maintenance and Management Tools
A central and essential activity is the maintenance of the Statewide Planning database. In a later activity the tools required to do so will be designed and developed. This report was developed keeping in mind the overall requisite maintenance and management functions so that the resulting relational database design efficiently supports those functions.
1.4.7 Data Acquisition and Reporting
Appropriate consideration must also be given to the overall requisite data acquisition and reporting functions so that the resulting design efficiently supports those functions. The database tables and attributes that support acquisition and reporting are included. Furthermore, the Federal Highway Administration’s (FHWA) Highway Performance Monitoring System (HPMS) reporting requirements must be met via the specified database design. This is an issue that will be resolved during the construction of the relational DBMS and the database population phase. Filter programs such as those described in section 7.5 will help to accomplish this task.
1.4.8 Data Migration
for that data needs to be specified and illustrated. That is, it should be clearly shown how and where each stakeholder’s data is stored. This report attempts to do so by presenting both the existing and proposed data structures and items (see chapters three through six). Additionally, any foreseeable migration pitfalls or problems are identified and solutions proposed (see Chapter 7). In the future, a conceptual plan for the flow of new data into the database, from each stakeholder should be developed.
1.4.9 Regeneration of Existing Database
Existing applications are tightly coupled to existing data files. During the actual development of the new database and for some time after its implementation, the application programs will require access to data in its original format. This need will persist until those application interfaces are rewritten to accommodate the new data format. Until that time, it will be necessary to regenerate the existing data files from the new database schema. One future task is to define how that reverse migration can be accomplished and to identify any pitfalls or problems and propose their solution.
1.4.10 Data Dictionary
As part of the review of existing databases, applications, and files, and new data needs, a comprehensive data dictionary will be compiled. This data dictionary should include at least three major categorizations of data: spatial, tabular, and temporal data.
The data dictionary should provide complete definitions for each data item, identify both the organizational unit(s) and application(s) using (responsible for) that data item, data type, data domain and range, and provide either typical or comprehensive value sets for the data item. The data dictionary should be organized and categorized into groupings related to stakeholder and applications needs for locally used data. It should support data dictionary analysis and standard queries.
This report identifies and defines many data attributes. However, uncertainty remains as to which data attributes are to be included in the unified database. Until each of the primary stakeholders decides precisely what information they want to be included, this task will remain unfinished. As section 8.0 indicates, this report presents a template for NCDOT, which can be used to create its evolving databases. The precise structure and content of these databases will not finally be defined until they are actually created.
1.4.11 Data Dictionary Analysis
One purpose of a critical analysis of all data items is to identify those data items that could be omitted from the new database. A second purpose is to resolve conflicts, formalize naming conventions, and standardize definitions, thus obtaining a more concise, robust set of data items to meet all previously determined needs.
data on one hand, and the anticipated program demand for, or use of data, on the other hand. It is expected that some existing data items may no longer be needed. These items should be identified and removed.
Second, it is known that secondary data items have been created from complications of other more fundamental (or base) data, thus proliferating a degree of redundancy of existing data. Furthermore, different ways of referring to and using data also result in redundant data items. These data items should be identified and removed if not needed in recreating data sets in previous formats.
1.5 OWNERSHIP AND RESPONSIBILITY
The envisioned unified database is one of a conceptually centralized database with distributed ownership and responsibility. That is, the nature of the relational database model is such that free exchange of relational database tables is easily achieved. This assumes, of course, a common ORACLE relational database tool and the adoption of the recommended LRS solution. Given that these two goals are met, data exchange will be immensely facilitated at NCDOT as a result of adopting the unified database design. This may be the one most significant result of this project.
At the same time, it must be recognized that not everyone needs instant access to all data. The nature of the majority of the data is such that one unit generally works with its data extensively and holds significant organizational responsibility for it. Usually the needs of others for that same data are less immediate and less frequent. Most data, therefore, does not need to reside on a central server and be continuously available to everyone. Rather, it can usually reside with its host organizational unit and be made readily available upon request.
Clearly, some data will need to be shared more quickly and more often than other data. The point here is that there is also much data that does not need to be shared so quickly and often. This data can remain under more local control. The fact that it is in a relational format, that it is on ORACLE, and that it is linked to the standard LRS means that it is available and can readily be shared.
1.6 DATA STRUCTURES AT NCDOT
In the past, most crucial data at NCDOT was stored on one type of database that was accessed by terminals tied to a centralized mainframe computer. Access was limited in this type of system and those who may have been able to use the data were not able to retrieve it directly. This type of system was also very difficult to maintain and required frequent programming for customization. Because of the limited software and hardware capabilities of this type of system, the benefits of GIS could not be capitalized upon.
Recently, a statewide county roads layer has been placed in GIS format. The road network was digitized from USGS 7.5’ quadrangle maps to the GIS. Not only have the roads been digitized, but also several basic attributes, such as posted route number, have been added.
In the 1960’s, NCDOT began maintaining a “Universe File” that contains roadway characteristics, which are referenced by segments described in milepost measurements. Basically, this file contains information about the road itself, such as topology and geometry, and is the primary NCDOT source of spatial data. The file will eventually be incorporated with a GIS called ARC/INFO so that data can be displayed graphically. Another file, called the “Feature File,” was created to contain information related to point features along the roads contained in the Universe File.
The GIS Unit was formed in the mid-1990’s under the Statewide Planning Branch to maintain the GIS road layer. There are several business units at NCDOT that have requested improvements to the GIS and database system to help them operate more efficiently. These units include Statewide Planning, Traffic Engineering, and Pavement Management.
1.7 ORGANIZATION
This report is largely divided into six major parts. The first major section summarizes the proposed Linear Referencing System (LRS) that will be used in the relational database design. The next four parts discuss the current database structures and future database needs of each of the NCDOT stakeholders: Statewide Planning Branch (Traffic Surveys, Forecasting, and Planning), GIS, Traffic Engineering, and Pavement Management.
Each major part is divided into approximately the same sections. A background discussion orients the reader to the unit’s functions, operations, and data needs. The next section, “Major Applications,” discusses the most significant application needs and work activities of the unit. These are the functions or primary business activities of the unit that must be adequately supported by the data. The section “Data Issues and Obstacles” discusses concerns, issues, and problems that need to be solved to fully support the data needs of the unit.
The “Conceptual Database Design” section addresses the conceptual nature of the data needed by the unit. The two primary categories are spatial and tabular data. In this section a conceptual design is proposed. The “Existing Databases” section fully enumerates all the units’ current databases and individual data items and provides definitions for data that is not completely obvious. Lastly, the “Relational Conversion” section presents a relational model, which is largely equivalent to the existing data structures of each unit. In theory, if each unit converted to these relational tables, all existing operations could be directly supported as they currently are.
1.8 FORMAT
The four major parts of the report (covering each of the stakeholders) present a proposed relational database schema for the data outlined in those sections. The proposed schema in each part is designed to work with the data as it currently exits. It does not necessarily reflect the proposed linear referencing system, but it does offer an improved relational table design.
The unified database of Chapter 7, however, does reflect the proposed LRS design. The format of the proposed design is presented in table form. That is, a set of tables are provided identifying the table name along with the primary key(s) and attributes as follows:
Table name (primary key, attribute 1, attribute 2, attribute 3, …, attribute n)
2.0
LRS SOLUTION
This section summarizes the linear referencing system (LRS) to be adopted by NCDOT. Included in the summary is a statement of the importance of LRS to GIS, an outline of the recommended LRS, an enumeration of the advantages and disadvantages of the LRS, and the unified database’s incorporation of the LRS. A complete report describing the proposed NCDOT LRS can be found on the World Wide Web at the following address:
http://www.doh.dot.state.nc.us/planning/gis/gis/newlinref/default.html
Refer to this report for further information.
2.1 LINEAR REFERENCING SYSTEMS
Linear referencing systems (LRS’s) are used to manage and promote the analysis of spatial data elements on transportation networks. A linear referencing system may incorporate one or more location referencing system methods designed to support a series of office, field management, and integration procedures. A location referencing system includes “procedures that relate all locations to each other…it includes techniques for storing, maintaining, and retrieving location information (Geo Decisions, 1997).” A location reference method is a way to identify a single location, i.e., to reference a single position with respect to a known point (Geo Decisions, 1997). In practical terms, a linear referencing system can be defined as the GIS elements used to create, manipulate, and manage information gathered from various methods, including GPS, milepost referencing, and intersection address.
There are several types of linear referencing methods employed by NCDOT and other transportation agencies. These include Route-Milepost, Link-Node, X-Y Coordinate, and the
Address methods. Refer to the NCDOT report for a complete definition of these methods.
A linear referencing system is used to relate all location referencing methods to each other. The LRS must incorporate graphic displays of data on linear GIS networks so that spatial data analysis operations can be performed.
2.2 IMPORTANCE OF LRS TO GIS
GIS in the transportation field relies upon data that occurs along linear networks. Because of this algorithms have been written that allow a “linear overlay” of data types in the GIS system. This overlay of data has been accomplished though a dynamic segmentation process, which “facilitates both graphic and non-graphic integration of line-on-line, point-on-line, and polygon-on-line features and data elements” (Geo Decisions, 1997). Dynamic segmentation refers to the practice of measuring locations along a line where attributes occur. A unified LRS is an attempt to represent many different data types spatially in a network structure in a standardized manner.
2.3 SUMMARY OF RECOMMENDATIONS
One major aspect to the idea of a unified database is the selection of a common linear referencing system (LRS). Currently, different stakeholders use different location reference methods (LRM) in order to suit their needs most efficiently. The location reference methods described above are currently in use by various NCDOT business units and need to be supported by the new schema. Eventually, a common LRS needs to be chosen so that the data can be organized spatially in the unified database without confusion or discrepancy. For example, a highway may share two or more posted route names for a portion of its length. Therefore, a database identification scheme is required so that a road can be uniquely identified while retaining posted route names as attributes. Standardization among the stakeholders is required so that further discrepancy in route identification is avoided.
The proposed NCDOT LRS is based upon a common linear datum, which is designed to include anchor sections and anchor points in a route-system. An anchor section is a continuous, directed, non-branching linear feature, connecting two anchor points and having a measurable length. An anchor point is a “zero-dimensional” location that is uniquely identifiable in the field by position. The LRS will include these anchor sections and anchor points without any defined coordinates so as to enable sharing of data independent of cartographic network variations.
A single network and system are to represent the state highway system. In this route-system each graphic GIS segment will have only one LRS route identifier. The base location reference method will be route-milepoint. In a route-milepoint system, data are located by an offset linear distance that describes the geometric location as measured along the route. There are beginning and end nodes in this type of system that correspond to anchor points and link the anchor sections to each other.
Each route in the LRS route-system should have a “permanent, unique, arbitrary identification number.” This is much better for database purposes than if a “posted-route” number is used as the primary identification device.
In addition, all spatial route-system coordinates should be stored in the ARC/INFO GIS database, while all attribute (event) data tables are stored in ORACLE databases. Ramps and double line roads must also be represented in the LRS format. Nodes should be placed at intersections and county boundaries to make county-based analyses easier but may also be used to identify other features as needed by NCDOT. Bridges should be represented as a linear feature with a measurable distance, as opposed to a point feature. And finally, local roads should be incorporated into the LRS to meet future data needs.
2.4 ADVANTAGES OF RECOMMENDED LRS
Changes will only occur to the system when new alignments or intersection features are added or modified. Finally, internal route identities are maintained as “real-world” attributes change.
The recommended LRS also makes the statewide reference structure more efficient. There is increased capability and amiability in data creation, conversion, storage, and maintenance. The system requires less processing overhead for dynamic segmentation display. That is, there will be less graphic duplication. The more elements contained in the route-system, the longer it takes to process queries. The process time is reduced because only one GIS route is needed for each graphic segment. The system has a great efficiency advantage in that multiple “posted-routes” are represented by only one GIS route-section with a unique identifier. Finally, LRS data will be easier to share among NCDOT units and others because of the standardized structure. In some instances, units will still use different location referencing methods, but the creation and use of “LRS filters,” or translation software, can still support data exchange.
There are two disadvantages to the use of the proposed LRS. First, GIS routes will not directly reflect actual highway designations and types. This will cause manual queries to become more complicated and will result in confusion among those accustomed to speaking in terms of posted routes only.
Second, because all database attribute data is accessed by a unique identifier and one milepost (point feature) or two mileposts (linear feature), every access to the ORACLE database requires a mathematical calculation to identify data. This is discussed in section 7.9.
2.5 DATABASE USE OF THE LRS
3.0
TRAFFIC SURVEYS, FORECASTING,
AND PLANNING UNIT
3.1 BACKGROUND
The Traffic Surveys, Forecasting, and Planning Units of the Statewide Planning Branch (SPB) are responsible for traffic counting, traffic analysis, and traffic projection operations. Each unit’s specific responsibilities are described in the following subsections.
3.1.1 Traffic Surveys
The primary function of the Traffic Surveys Unit is to collect transportation data and to format it in a meaningful manner. This data can then be published for use by other units. Approximately 90 percent of the data is specific to traffic volumes, vehicle types, and vehicle weights. The unit may be viewed as a transportation data warehouse. However, in addition to storing data, the unit also processes data to derive traffic and travel statistics that are of use to others. In the future, this unit would like to provide on-line access to its data for ready access for all those who might be interested in traffic information. The major applications and data described in this chapter are all associated with Traffic Surveys because Traffic Forecasting, and Traffic Planning do not collect any data, but rather, they are users of the data collected by Traffic Surveys.
3.1.2 Traffic Forecasting
Traffic Forecasting is concerned with predicting future traffic volumes. It also predicts how the behavioral trends of the population will impact the transportation system. Information related to future traffic volumes, turning movements, etc. are passed on to other business units throughout NCDOT.
Traffic Forecasting uses the data collected and processed by Traffic Surveys to help accomplish its objectives. The unit has four basic objectives that include:
1) The development of future traffic volume estimates for possible road projects. 2) Timely delivery of travel forecasts to different Departments and Units.
3) Assess present and anticipated traffic and land development needs for the State.
4) Assure that the transportation networks are adequate for future traffic and growth.
3.1.3 Traffic Planning
Traffic Planning is responsible for conducting systems planning. This involves developing long-range thoroughfare studies for cities and towns. The primary purpose of these studies is to develop maps showing projected ADT for the highway network surrounding a community. These maps are a tool used to assess future transportation needs. Traffic Planning does not feel that these ADT projections can be incorporated into the unified database on a route segment basis because of the data’s inherent subjectivity. Rather, the unit feels that the maps showing the projected ADT for a community must stand alone because a modification, addition, or deletion of a road in the system network they are concerned with, can have a tremendous impact on the rest of the system.
Although Traffic Planning does not generate any data to be included in the unified database, the unit will be a major data user. They currently rely on the Universe File (see Chapter 4) to help them build a link-node representation of an area’s road network for analysis purposes. They would like to retain that capability following the implementation of the unified database.
It should be noted that Traffic Planning is closely related to Traffic Forecasting. The reports generated by Traffic Planning in its thoroughfare studies utilize and include projections calculated by traffic forecasting. They also go one step further to include socio-economic data such as the number of travel productions (residences) and attractions (businesses) within the limits of the studies.
3.2 MAJOR APPLICATIONS
3.2.1 Survey Programs
Traffic Surveys is responsible for maintaining data collected in a series of programs. In this context, program may be defined as the data gathering and analysis activity within the unit. The Traffic Survey programs include the following:
Continuous Count Program (ATR) – In this program, all vehicles are individually counted and grouped by type using machines that can be remotely accessed without personnel having to field check them. These machines are permanent counting stations. The data they collect is used to determine Average Daily Traffic (ADT) and Design Hour Volume (DHV) information.
Vehicle Classification Program – In this program, vehicles are counted and classified into 13 vehicle types for the purposes of traffic analysis, and roadway design/improvement.
Weigh-in-Motion Program (WIM) – In this program, all types of vehicles are weighed using special scales placed in the roadway. The weight recorded is weight per axle because this is more useful than actual vehicle weight.
Special Count Program – Often a department may require a specific type of count at a particular location as part of a special study or to design an improvement. In that case, a special count, beyond the scope of the other counts mentioned in this section, may be taken in order to provide for the special need.
Vehicle Occupancy – In this program, the number of occupants per vehicle is counted.
Origin and Destination Survey – This program surveys drivers and passengers to determine where their trips originated from and what their terminal destination is.
Drawbridge Reports – In this program, the number and type of vehicles using a drawbridge is recorded.
Ferry Utilization Reports - In this program, the number and type of vehicles using a ferry is recorded.
3.2.2 Program Details
•Continuous Count Program (ATR) – This is a program where traffic counts are continuously collected using Automated Traffic Recorders (ATR). Counts are provided hourly by lane continuously. There is an option to provide counts in 15-min. to 1-min intervals. There are approximately 100 of these recording stations throughout the state operating 365 days a year. In addition to counting, selected stations classify vehicles, provide speed interval data, vehicle length, and speed by vehicle length groupings. Counts are normally recorded as # vehicles/hr.
•Vehicle Classification Program – There are approximately 300 sites devoted to counting and classifying 13 vehicle types. Of these 300 sites, one hundred stations are utilized for counting each year. That is, count stations are operational once every three years. In addition, there are 350 truck-monitoring stations of which 300 are utilized to count annually. That is, 50 sites are rotated out of service each year and return to service the following year. These classification sites employ either manual or automatic classification devices.
Manual classification data is collected using Jamar count boards. Lotus 1-2-3 is then used for processing and reporting. Machine classification data is collected with Peek ADR 100 equipment by lane by hour. Peek software is used to process the binary data and produce the reports. Site information is then kept in an Access database. From the Access program, two annual reports are produced. One report is site-specific information and the other report is classification distributions using FHWA’s Functional Roadway Classification. In about 2 years the unit will begin collecting continuous vehicle classification data by lane by hour.
• Weigh-in-Motion Program (WIM) – There are 23 SHRP sites and 5 WIM Monitoring Stations that are in continual operation. WIM data is collected using equipment and software supplied by two different vendors. Both sources convert the data to FHWA Card 2, 4, and 7 formats. Vitrus software (from FHWA) is used to summarize the data into monthly and annual reports. WIM data is also used to compute ESAL (equivalent single axle loads), which is used by Pavement Management. WIM also monitors the number of vehicles that are in violation of the Federal Bridge Formula.
• Special Count Program – By a special request from another unit within NCDOT, the following data collection activities may be conducted. A special request usually occurs when there is a specific need that cannot be met using the data collected in other Traffic Surveys’ Programs.
⇒Intersection Studies (Turning Movements)
⇒Travel Time Studies
⇒Other Vehicle Data Collection
• Vehicle Occupancy – This is data related to the number of people occupying each vehicle.
• Origin and Destination Survey – This is data related to the origin and destination of travelers. Data is collected manually by individuals asking specific questions of drivers and passengers. This type of survey is conducted periodically at the discretion of the department.
• Ferry Utilization Reports – Data for ferries contains counts and classifications of vehicles using the ferry system accounting for vehicles towing trailers.
•Historical Paper and Map Files – The unit also stores old paper records such as past traffic counts and maps that show information such as Average Daily Traffic (ADT) and Design Hour Volumes (DHV).
The unit also makes use of mainframe database files maintained by the GIS unit. These databases (Universe and Feature File) are accessed in several ways. The Statewide Planning Branch’s access to this data is through the NCDOT mainframe. Unit staff uses this connection to search data and generate reports. They may also query specific data and receive hard-copy results of the queries in a report form. Sometimes, the mainframe databases are dumped into their own local database files using programs such as Paradox.
Key products of Traffic Surveys are maps that show traffic counts affixed to roads. These maps are developed from the processed data generated by the unit. They provide a graphical representation of traffic levels on roads throughout the state. These maps are sent to the GIS Unit’s Mapping Section where they are digitized into Microstation, a CAD package. Eventually, these maps will be accessible in an on-line format, where traffic volumes can be quickly ascertained.
3.3 DATA ISSUES AND OBSTACLES
The Traffic Surveys Unit has indicated that the current data management system is cumbersome and difficult to update. There are over five different data systems that are contained in over five different database types (e.g. Access and Mainframe – flat file). Data downloaded from the mainframe and data acquired from other unit’s databases has led to replication of data and parallel databases. Often, data is collected in the field, transferred to digital format, printed in a paper report, and then reentered in a slightly different digital format. All of this results in outdated data because the original databases are out of the owner’s control. Therefore, data can no longer be updated and maintained properly. There is no mechanism for making changes to these parallel copies of the databases. Obviously, this is not the most efficient means of data management.
The unit would like to see the entire data management process revamped. The unit would like to allow easier access to data while ensuring data security. In order to do this, software must be standardized by selecting database management systems that can be integrated with one another. Data processing must be streamlined so that needless efforts are not expended. Data queries that are both flexible and comprehensive must be possible so that specific information can be called when needed and in a proper format. The unit would like to see a standard query structure for all reports and queries.
Reports need to be designed with a higher quality and efficiency (i.e. improve readability and eliminate redundant information). One way to increase report efficiency is by delivering reports in an electronic format at periodic intervals (i.e. monthly, yearly, or on-demand). This means information will be available on-line without ever having to see a printed hard copy.
Ultimately, Traffic Surveys would like to see utilization of the Internet/Intranet without requiring mapping software. This means that the mapping software is still required, but resides on the Internet server. This would help to reduce the amount of direct interaction with the general public by providing limited public access to the data (both tabular and spatial). In order to work, cross-platforms formats must be utilized for data exchange. This would also enhance interagency data exchange because different units use different database management programs.
The unit wants to continue its data collection efforts as well as receive data from other agencies. It would like to increase the number of automated data collection devices to help increase data confidence. Once data has been collected, the system should be such that data is entered only once. The same goes for data updating. There should only be a single point where data is updated. It is expected that the new database management system will allow for faster and more efficient data edits, corrections, and adjustments. The new system must be able to receive and process data from a local server with its network of personal computers. It is important that the ability to produce reports and maps is continued and that requests for data and statistics are satisfied.
It should be pointed out that Traffic Surveys maintains a tremendous amount of data. Section 3.6 includes a series of data inputs and outputs generated from the programs described above. In most cases, the data inputs are considered “raw” data (i.e. the data obtained from the counting stations) that must first be analyzed and processed into a suitable output. The majority of this “raw” data is not to be included in the unified relational database. Rather, it is to remain on the mainframe in its original form. For the most part, only processed data is to be included in the unified database. This processed data is much more useful to other departments within NCDOT. The “raw” data cannot be used effectively until it is processed.
Section 3.7 contains the relational conversion of data structures for Traffic Surveys. In this section, both “raw” count data and processed data is included. The “raw” data is provided simply to show its form. Although all current processed data is provided in section 3.7, it will be Traffic Surveys’ decision as to what data is ultimately included in the unified database.
3.4 PROPOSED TRAFFIC INFORMATION SYSTEM
Traffic Surveys has initiated a directive to institute a Traffic Information System. This information system is basically a re-organization of the current major applications into a system-wide hierarchy. It has been designed to cover many of the issues discussed in the section above.
required to learn basic functions. At the same time, there needs to be an interaction capability among the different applications. In order to enhance these interactions, some degree of standardization is required among the input and output data items and types.
The system needs to support quick problem identification and resolution. The GIS interface needs to allow for quick and accurate mapping. The system must provide better data quality through additional checks and quality. The analysis capabilities are expected to improve with the system and processing time reduced. Finally, it must support electronic data interchange to reduce the amount of data entry and paperwork.
In the proposed Information System structure, there would be a Continuous Count Program Menu and a Projects Program Menu. The Continuous Count Program Menu would contain ATR, Classification (Permanent and HPMS), WIM, Drawbridges, and Ferries data. The Project Program Menu would contain Intersection Studies, Volume Studies, and Classification (Manual and Mechanical) data.
3.5 DATA – CONCEPTUAL DESCRIPTION
In this section, data from each Traffic Survey, Forecasting, and Planning program are listed and described in a conceptual manner. That is, not all data items are explicitly enumerated and described. Rather, the types of data types are characterized. In this context, program may be defined as the data gathering and analysis activity within the unit. Data required for each program may be classified into several types of categories, including:
• Spatial Data – where the count station is located
• Geometric Data – direction of travel or lane of travel
• Setup Data – information recorded when a count/survey is initialized
• Time Referencing Data – when (time) counts were taken
• Count Data – the number of vehicles per hour or the number per day
• Vehicle Classification Data – the types of vehicles counted
• Weight Data – how much each vehicle weighs
• Speed Data – how fast vehicles are traveling
• Related Analysis Data – processed information such as average daily traffic (ADT) Each program requires data collection in the field. This data may be collected manually in a paper format or it may be collected manually in an electronic format. Certain data is collected by a completely automated system. The data collected in the field is then used as input data into a database for each program. Output data is generated after certain analysis functions have been performed on the data. This analyzed output data is then typically summarized in weekly or monthly reports.
• Continuous Count (ATR) Program: location, geometric, station identification, time referencing, raw vehicle counts, conversion factors, annual daily traffic (ADT), peak hour volume distribution, and rankings of specific time interval counts.
• The Coverage Count (PTC) Program: location, geometric, time referencing, station identification, raw vehicle counts, adjusted vehicle counts, and annual average daily traffic (AADT).
• Vehicle Classification Program: location, geometric, station identification, counts, vehicle classifications, ADT, and axle correction factors.
• Weigh in Motion Program: location, geometric, time referencing, station identification, vehicle weights, axle counts, axle spacing, and speeds.
• Intersection Studies (Turning Movement): location, geometric, time referencing, site identification, vehicle counts, vehicle classification, projected travel, peak hour values, and traffic volumes.
• Origin and Destination Studies: location, geometric, time referencing, vehicle counts, vehicle classification, vehicle occupancy, trip classification, origin, and destination.
• Drawbridge Studies: time referencing, bridge identification, vehicle counts, and vehicle classification.
• Ferry Studies: time referencing, ferry identification, vehicle counts, and vehicle classification.
3.6 EXISTING DATABASES
In this section, specific data items (attributes) are enumerated for each data structure. These are the data items that are gathered in the field and included in all output summaries. There are two sets of data listed for each program. The first set is raw data gathered in the field and later used in processing applications. In this report, we often refer to this data as input data as it is used as input to the many analysis programs and data processing activities of the NCDOT. The second set is generally data that has been processed and analyzed and is used in forecasting and planning activities. This data is herein referred to as output data. Figure 3.1 is a physical model of the data cycle within each program. Each data element is followed by its data input format. Some data elements require a brief definition, which is provided only for data elements that may not be readily understood.
Figure 3.1
3.6.1 Continuous Count Program (ATR)
Program (e.g. ATR)
Raw Vehicle
Counts
Processing Application
The Continuous Count Program (ATR) contains the following raw data elements. Data from the Automated Traffic Recorders (ATR) is typically gathered electronically in the field and then uploaded via modem. In a few instances data must be gathered manually due to the lack of communication lines.
• Record Identification: 3 = ATR Data – Numeric
• FIPS State Code - Numeric
• Functional Classification Code - Numeric
• Station Identification Number - Alpha
• Direction of Travel Code - Numeric
• Mainline Lane of Travel; 0 = combined lane, 1= outside; 2 = next to outside; 3 to 9 = inside lane - Numeric
• Year of Data (last 2 digits) - Numeric
• Month of Data (01-12) - Numeric
• Day of Data (01-31) - Numeric
• Day of Week: 1 = Sunday, 2 = Monday, 3 = Tuesday, 4 = Wednesday, 5 = Thursday, 6 = Friday, and 7 = Sunday - Numeric
• Traffic Volume Counted, 00:01 - 01:00 through 23:01 – 24:00 - Numeric
• Footnotes: 0 = no restrictions, 1 = traffic affected by construction or other activity - Numeric
There are two sets of analyzed/processed data associated with the Continuous Count Program (ATR). The first set of data is included in a Monthly Report format. The following are data items included in the monthly report:
• Station Number – Integer
• Direction – Text (Compass Direction)
• Lane – Integer
• Weekday Average Traffic – Integer
• Saturday Average Traffic – Integer
• Sunday Average Traffic – Integer
• Monthly Average Traffic – Integer
• Number of Days of Data – Integer
• Monthly Total Traffic – Integer
The second set of analyzed/processed data associated with the Continuous Count Program (ATR) is part of an Annual Summary. This annual summary is stored in an electronic format and later printed into a paper format. The following are data items included in the annual summary:
• Station ID – Integer
• Direction – Text (Compass Direction)
• Month – Integer
• ADT – Integer (Average Daily Traffic)
• ADT Factor – Floating Point
• Average Saturday Count – Integer
• Average Sunday Count – Integer
• Conversion Factor for 24-Hr Count to Average Weekday (Mon) – Floating •
• •
• Conversion Factor for 24-Hr Count to Average Weekday (Fri) – Floating
• Short-Term to 24 Hr Factor (early) – Floating
• Short-Term to 24 Hr Factor (late) – Floating
• Short-Term to 24 Hr Factor (all day) – Floating
• Hour of AM, PM Peaks – Integer
• Distribution of AM, PM Peaks – Integer
• Distribution by Direction – Integer
Highest 100 Hours for Each Hourly Interval on a 365 Day Calendar:
• Count – Integer
• Date • Day of Week - Integer
Note that conversion factors are only computed for Monday through Friday. Conversion Factors are not required for Saturday and Sunday.
3.6.2 Coverage Count Program (PTC)
Raw data for the Coverage Count Program (PTC) is gathered in the field and recorded in a paper format. All raw data in the PTC program are in the form of axle counts. That is, for the time period under consideration, axles are counted as opposed to vehicles. Conversion factors are later applied to convert the axle counts into vehicle counts. After the data has been gathered in the field it is then entered in an electronic format. Codes (e.g. County ID number) are used to designate certain attributes in the data tables. The following are the PTC data items followed by the input format and a brief clarification of the data type:
• Year and Month – Integer
• County – Integer (Spatial)
• Station ID – Integer (Spatial)
• Direction – Logical (Not a compass directions but defines whether or not the counter is a directional pair)
• Day of the Week – Integer
• Installed reading – Integer (The count recorded at the time the counter is installed.)
• Location – Text (The spatial
representation of the counter on a posted route is reference to another route)
• Remarks – Text (Comments)
• 1st Day Reading – Integer (The count recorded on the first day)
• 1st Day Data Good Flag – Logical (A flag is used to note when a day’s data is unacceptable)
• 2nd Day Reading – Integer (The count recorded on the second day)
• 2nd Day Data Good Flag – Logical
• 3rd Day Reading – Integer (The count recorded on the third day)
• 3rd Day Data Good Flag – Logical
• Machine Number – Integer (The
identification number of the counter being used.)
Traffic Surveys is in the process of converting from cumulative counters to interval counters. This means that readings will no longer have to be taken manually for 3 successive days. With cumulative counting, readings have to be taken by an individual periodically at specific time intervals on specific days. The interval counter is able to automatically record and store counts for specific time intervals such as days of the week.
The analyzed/processed data for the Coverage Count Program is included in a Monthly Master List Report (paper format) and a Yearly Master List Report (electronic and paper formats). The following data items are included in the Monthly Master List Report:
Raw Data:
• County ID – Integer
• County Name – Text
• Station Number – Integer
• Route Type – Integer
• Route Number – Integer
• Location – Text
• ATR Group – Integer
• Axle Factor – Floating Point
• 1st 24-Hr Raw Count – Integer
• 2nd 24-Hr Raw Count – Integer
• 2nd 24-Hr Adjusted Count – Integer
• 3rd 24-Hr Raw Count – Integer
• 3rd 24-HR Adjusted Count – Integer Processed Data:
• Current Year Average Count – Integer
• 1st Past Year – Integer
• 1st Past Year AADT (Annual Average Daily Traffic) – Integer
• 1st Past Year Adjusted AADT – Integer
• 2nd Past Year – Integer
• 2nd Past Year AADT – Integer
• 2nd Past Year Adjusted AADT – Integer
• 3rd Past Year – Integer
• 3rd Past Year AADT – Integer
• 3rd Past Year Adjusted AADT – Integer
• 4th Past Year – Integer
• 4th Past Year AADT – Integer
• 4th Past Year Adjusted AADT – Integer The following data items are included in Yearly Master List Report:
• County ID – Integer
• Station Number – Integer
• Route Code – Integer
• Route Number – Integer
• Location – Text
• ATR Group – Integer
• Axle Correction Factor – Integer
• Year 1 – Integer
• AADT 1 – Integer
• Adjusted AADT 1 – Integer
• Year 2 – Integer
• AADT 2 – Integer
• Adjusted AADT 2 – Integer
• Year 3 – Integer
• AADT 3 – Integer
• Adjusted AADT 3 – Integer
• Year 4 – Integer
• AADT 4 – Integer
• Adjusted AADT 4 – Integer 3.6.3 Vehicle Classification Program
The Vehicle Classification Program collects counts of vehicles of different types. The data collected are raw counts recorded in hourly intervals in the field at designated classification stations.
• Cycles
• Cars
• Pickup Trucks
• Buses
• 2-Axle, 6-Wheel Trucks
• 3-Axle Trucks
• 4-Axle Trucks
• 4-Axle Single Trailer
• 5-Axle Single Trailer
• 6- Axle Single Trailer
• 5-Axle Twin
• 6-Axle Twin
• 7-Axle Twin
• Other
Once the data has been analyzed, it is placed in annual report and the vehicle classes are individually reported as a percentage of total vehicles surveyed. The results of the analysis are grouped by classification station and include the following:
• County – Text
• Route Description – Text
• Location – Text
⇒ Cars and Cycles
⇒ Pick-up Trucks
⇒ Buses
⇒ 2-Axle, 6-Wheel Trucks
⇒ 3-Axle Trucks
⇒ 4 & 5-Axle Trucks
⇒ 3 & 4-Axle TTST’s (Tractor Trailer Single Trailer)
⇒ 5-Axle TTST’s
⇒ 6 & 7-Axle TTST’s
⇒ 5-Axle Twins
⇒ 6-Axle Twins
⇒ 7-Axle Twins
• ADT (Average Daily Traffic) – Integer
• Axle Correction Factors – Floating Point 3.6.4 Weigh in Motion Program
Data for the Weigh in Motion Program is gathered electronically in the field and uploaded via modem. The following is raw data collected for the Weigh in Motion Program followed by a data input format. In a few instances data must be gathered manually due to the lack of communication lines.
• Record Type – Data record of station description record
• FIPS State Code – Integer
• Station ID – Text
• Direction – Integer (Direction of traffic flow.)
• Lane of Travel – Integer (e.g. outer, inner, middle lane, etc.)
• Year of Data – Integer
• Month of Data – Integer
• Day of Data – Integer
• Hour of Data – Integer
• Vehicle Class – Integer
• Total Vehicle Weight – Integer
• Number of Axles – Integer
• A-axle Weight – Integer (The weight of the first axle to pass over the scale.)
• A-B Axle Spacing – Integer (The distance between the first and second axles.)
• B-axle Weight – Integer (The weight of the second axle to pass over the scale.)
• B-C Axle Spacing – Integer (The distance between the second and third axles.)
• C-axle Weight - Integer (The weight of the third axle to pass over the scale.)
• • •
• K-L Axle Spacing – Integer (The distance between the eleventh and twelfth axles.)
• L-axle Weight – Integer (The weight of the twelfth axle to pass over the scale.)
• L-M Axle Spacing – Integer (The distance between the twelfth and thirteenth axles.)
• M-axle Weight – Integer (The weight of the thirteenth axle to pass over the scale)
• Speed - Integer
At the present time, Traffic Surveys does not include data from the Weigh in Motion Program in any standardized output summary. In the future, they may include processed/ analyzed data from the Weigh in Motion Program in some form of summary report.
3.6.5 Intersection Studies (Turning Movements)
Setup data:
• Date of Count – Integer
• Starting Time – Time
• Interval Length – Time
• Number of Intervals – Integer
• Site Code – Text Movement counts from all approaches:
• Right – Integer
• Through – Integer
• Left – Integer
• Other - Integer
Processed/analyzed data from the Intersection Studies Program is returned in both a paper and electronic format and is organized in the following structure:
Location Data:
• Route Names – Text
• County – Text
• City (in or near) – Text
• Area Type – Text
• Functional Classification – Text
• Facility Type – Text Count Data:
• Station – Integer
• Date – Text
• Day of Week – Text
• Data Collector – Text Traffic Data:
• 15-Min Counts by Individual Turning Movement for 11 to 15 Hours – Integer
• 15-Min Counts for 3 Truck Classes on Designated Approach – Integer Traffic Analysis Data:
• 15-Min Total Entering Vehicles – Integer
• 15-Min Total Entering Trucks on Designated Approach – Integer
• Day Totals by Movement, Intersection, and Trucks – Integer
• 24-Hour Projected Totals by Movement, Intersection, and Trucks – Integer
• AM & PM Peak Hour Volume by Movement and Intersection – Integer
• AM & PM Peak Hour Times, Percentages, and Factors by Approach, and Intersection – Integer
• Dual, TTST, and Twin Trucks 24-Hr Volumes and Percentages by Designated Approach – Integer
• Diagrams Depicting Intersection Layout that Provide 24-Hr, AM Peak, and PM Peak Volumes by Turning Movement
3.6.6 Origin and Destination Studies
Data Collected in Interviews:
• Hour of Data –Integer
• Date – Integer
• Station Number – Integer (Identification number of station where interview occurs.)
• Vehicle Type – Integer (classification)
• Occupancy – Integer (number of passengers)
• Trip Purpose – Integer
• Garage Location – Character
• Direction – Binary (Inbound/Outbound)
• Zone of Origin – Integer
• Zone of Destination – Integer
Data Collected during Classification Counts:
• Count and Classification During Station Operation – Integer
• 24-Hour Count across the Time of Station Operation – Integer
The output data for the Origin and Destination Study Program is normally organized into a report in the form of a Trip Table Matrix. The table-matrix may contain the following data items:
• The number of expanded trips from each study zone by hour of day and vehicle type. That is, this matrix is used to report the number of vehicles (by class) traveling from one particular place (zone) to another.
• The number of expanded through trips from each station by hour of the day and by vehicle type. That is, the number of vehicles (by class) traveling through the zone in which the survey station is located.
3.6.7 Drawbridge Division
The Drawbridge Division collects data for drawbridges. This data is then sent to Traffic Surveys, where the information is keyed into a spreadsheet. The spreadsheet is then placed in a conventional filing cabinet system at Traffic Surveys. Traffic Surveys is responsible for maintaining and/or updating the files. This information is not placed in any type of formal report but is on record for reference. The following data inputs are recorded into the spreadsheet:
• Date
• Time Period
• NC Passenger Autos - Integer
• Out-of-State Passenger Autos - Integer
• TTST’s – Integer
• Buses – Integer
• Other Trucks – Integer 3.6.8 Ferry Division