THE RATE
O F
ALLELISMOF
LETHAL GENES IN A GEOGRAPHICALLY STRUCTURED POPULATIONSHOZO YOKOYAMA
Department of Psychiatry, Washington University SchooL of Medicine and
The Jewish Hospital of St. Louis, 21 6 South Kingshighway, St. Louis, Missouri 63110
Manuscript received September 6, 1978 Revised copy received January 30, 1979
ABSTRACT
The expected rate of allelism, E [ Z ( z ) ] , of lethal genes between two colonies with distance x in a structured population is studied by using one- and two-dimensional stepping-stone models. It is shown that E [ Z ( z ) ] depends on the magnitude of selection in heterozygous condition (h), the rate of migration among adjacent colonies ( m ) , the number of loci which produce lethal muta- tions ( n ) and the effective population size of each colony (N).---E[Z(z)]
always decreases with distance z. The rate of decrease is affected strongly by the magnitude of m. The rate of decrease is faster when m is small. E [ Z ( z ) ] also decreases with increasing N and n. The effect of h on E [ Z ( z ) ] is somewhat complicated. However, E [ Z ( O ) ] is always smaller when h is small than when it is large.--For large z, the following approximate formulae may be obtained:
1 Var(q) __
n n ( a 2
1 C,Var(q) __
n n ( ( t ) 2 &
-+
cv 21 t I/nt G (one-dimensional habitat)E[1(s)l =
-
+
---(?-2vltl/me (two-dimensional habitat)where 4 and Var (9) are the mean and the-variance of gene frequencies in each colony, t is approximated as t = h, 2 d u ; -h for the partially recessive, completely recessive, and overdominant lethals, respectively, and CO is a function of m and t. It is clear that E [ Z ( z ) ] declines exponentially with z in a one-dimensional habitat. The decrease E [ Z ( z ) ] is faster in a two-dimen- sional habitat than in a one-dimensional habitat. The present result is applied to some of the existing data and the estimation of population parameters is also discussed.
I N
their pioneering studies, DOBZHANSKY and WRIGHT (1941) and WRIGHT, DOBZHANSKY and HOVANITZ (1942) extracted a large number of lethal and semilethal chromosomes from natural populations of Drosophila pseudoobscura.I n these papers WRIGHT conducted a mathematical analysis of the rate of al- lelism and the frequency of lethal chromosomes to estimate important popula- tion parameters. Since then, similar studies have been done by many authors. The inverse of the rate of allelism of lethal chromosomes has been used to estimate the number of loci that produce lethal mutations (DOBZHANSKY and WRIGHT 1941;
IVES
1954;WALLACE
1950). The frequency of lethal chromosomes and the rate of allelism have been useful for the study of heterozygous effects of lethal genes(DOBZHANSKY and WRIGHT 1941; CROW and
TEMIN
1964; WALLACE 1966a). More recently, NEI (1968) extended WRIGHT’S analysis of the rate of allelism and the frequency of lethal chromosomes to a more general selection system. NEI’S study was concerned mainly with the estimation of the heterozygous effect of lethal genes. Both WRIGHT and NEI dealt mostly with the lethal chromosomes in a single population, and the effect of migration was studied usingWRIGHT’S
island model, which is a very special form of geographic structui.re.There are some experimental studies on the rate of allelism of lethal chromo- somes in relation to population structure. WRIGHT,
DOBZHANSKY
andHOVANITZ
(1942) showed that the rate of allelism was higher among lethal chromosomes derived from the same locality than among lethal chromosomes derived from different localities. WALLACE ( 1966a) observed essentially the same phenome- non in his well-designed survey. He postulated that the rate of allelism resulting from chromosomes of common descent
(G),
which is computed by subtracting the allelism of independent lethal mutations (In) from the obscrved rate of al- lelism of lethal chromosomes, decreases exponentially with the square root of distance.No one, however, seems to have made a theoretical study of WALLACE’S (1966a) postulate on the relationship between the allelism and distance. The rate of allelism of lethal chromosomes from different localities must depend on several factors such as mutation rate, mode of selection in heterozygotes and migration rate between subpopulations. It is
,
therefore, important to develop a more rigorous mathematical theory about the rate of allelism in a geographically structured population. Such a theory will be useful for understanding the ge- netic structure of populations and the mode of selection of lethal genes. In the following,I
shall investigate the relationship between the rate of allelism of lethal genes and geographical distance, using the “stepping stone” model of population structure originally proposed by KIMURA (1953). Before going into detail, however,I
should emphasize that it seems almost impossible to derive an exact formula for the expected value of the rate of allelism in a structured popu- lation. I shall, therefore, derive an approximate solution. Computer simulations are also done to examine approximations used in this paper.RESULTS
The rate of allelism of lethal g e n a in astructured population
The proportion of randomly chosen pairs of chromosomes that produce a lethal effect is called the rate of allelism of lethal chromosomes. This quantity can be obtained directly by a diallele test of lethal chromosomes. Because of the data available and biological interest we discuss two cases: one- and two-dimen- sional stepping-stone models.
One-dimensional habitat: Consider an infinite linear array of colonies of size
ALLELISM WITH DISTANCE 247 nies, so that m/2 is the proportion of individuals exchanged each generation
be-
tween a pair of adjacent colonies (KIMURA andWEISS
1964). Assume that wild- type alleles A and lethal genes a are segregating at the ith locus in thejth
popu- lation with frequencies p $ ( ? ) and q 2 ( J ) , respectively, at the adult stage. We also assume that the mutation rate from A to a is U per generation, that the reversemutation is negligible, and that the relative fitnesses o l three genotypes A A, Aa
and aa are 1, 1
-
h
and 0, respectively. These conditions are assumed to hold over all n loci, Let us further assume linkage equilibria among loci. Then, the chance that the zygote formed from two randomly chosen chromosomes fromn
the jth and j -I- kth populations will die is 1
-
1T [I - q z ( i ) q 2 ( 3 + k ) ] E 1-
exPn i=1
[-
3
q % ( I ) q,(’+k)]. Similarly, the probability that a chromosome contains at least one lethal gene or the frequency of lethal chromosomes in the jth popu- lation is 1-
n:
[I -qi(?)] p i ‘ ? ) ] .This
quantity may be de- noted byQ ( j )
.
Thus, the rate of allelism of lethal chromosomes for two colonies that are k steps apart may be given by%=l
n n
%=1 i=l
1
-
exp [-n
1 - exp[- ,E ~ % ( i ) q . ( i + ~ ) ]
(1 - exp[- , E q 2 ( i ) ] ) (1
-
exp[- ,E q i ( i + k ) ] )2=1
n -n -
.
~(1)I c ( i , j+k) =
2.=1 2=1
The allelism rate for a single population is given by lo
( j , j ) ,
which is the same asNEI’S
(1968).Let us consider another closely related quantity, i.e., the rate of allelism of lethal genes for two colonies that are
k
steps apart may be written asR
E q i ( 5 ) q i ( i + k )
[
x
qi‘i’] [z
q , ‘ j + k ’ ]i=1
l ( i , j + k ) = n. n ( 2 )
L=l 2=1
Equation (2) is the proportion of randomly chosen pairs of lethal genes that are located at the same locus and thus lethal in combination. These two quanti- ties are closely related and the following relationship holds. Noting that
Q ( j )
=Q
( j 4-k)
=Q
in equilibrium,i(k)
=-ln[l-
ie(k)Q2J/[ln(l-
Q)I2
,
(3)where
!(I%),
f c ( k )
and6
are the estimates of Z ( k ) , Z,(k) andQ,
respectively (NEI 1968).where the expectation is taken with respect to the joint gene-frequency distribu- tion for the over-all pairs of colonies
k
steps apart. The approximation of the mean of a ratio by the ratio of means is not generally true. I n the present study, however, approximation(4)
seems to be satisfactory and useful for practical purposes, as the computer simulation indicates.Assuming linkage equilibria over all loci, it can be shown that
n n
E [ 2 = 1 ,E q i ( j ) 2 = 1 .E qi(ifk)] = n[r(k)Var(q)
+
n E Z ( q ) ],
( 5 )where r ( k ) is the correlation coefficient of the gene frequencies between two colonies that are
k
steps apart, and E ( q ) and Var(q) are the mean and variance of q in each colony. Similarly,n
E [
2=1 .X qi(1) qi(i+k)] = n[r(k)Vur(q)+
E 2 ( q ) ] . (6)Thus
( 5 )
and (6) hold for anyi,
and formula(4)
becomesTwo-dimensionaz habitat:
We
assume that the entire population consists of an infinite rectangular array of colonies, each of which occupies a point denoted by a pair of integers( j ,
I ) .
Let q i ( i > l ) be the frequency of lethal genes in adults at the ith locus in the(i,
I ) th population. W e further assume that each colony exchanges individuals with four surrounding colonies every generation, but the population size in each colony remains the same before and after migration. We also assume that migration is isotropic and that m/4 is the migration rate between any pair of adjacent colonies(KIMURA
andWEISS
1964).The rate of allelism for two colonies that are
(Al,
k,)
steps apart in two ortho- gonal directions may be defined asq i ( i , Z ) q i ( i + k l , Z+k,) i=1
IC
(i,
0,
(j+kl,Z+kZ)l
= Z(k1,kz)
= 72.
(8)2 q i ( j , Z ) 2 9i(i+k19 Z f k J i=1 i=1
We again assume that the mutation rate and the mode of selection are the same over all loci and that the gene frequencies at all loci are treated as independent variables. Then the expected value of I [ ( j , I ) , (j+kl, I-kk,)] is approximately given by
where r ( k l , k p ) is the correlation coefficient of the lethal gene frequencies be- tween two colonies that are (kl,
k,)
steps apart in two orthogonal directions.ALLELISM WITH DISTANCE 249 quencies in a colony and of the correlation coefficient of gene frequencies between two colonies. Therefore, if we know these quantities, the relationship between the allelism rate and geographic distance can be determined.
The statiorrary distribution of lethal gene frequencies within colonies
One-dimensional habitat: In the following we assume that the gene frequency,
q i ( j ) , is computed at the adult stage, and during one generation it changes by
mutation, selection, migration and sampling of zygotes, in that order. Note that the gene frequency after migration, qi(i),, can be written approximately as
q i ( i ) r =
-
m[l - r ( l ) ] [qi(?) - E ( q i ( i ) ) ] (10) (see WRIGHT 1940)’ where the expectation is taken with respect to the gene frequency distribution at the ith locus in the jth colony. Considering linear regres- sion of qi(j)’ on q i ( i ) , it can be seen that formula (IO) holds when a joint dis- tribution of gene frequencies in two neighboring colonies is a bivariate normal with marginal distributions of the same means and variances. This condition may be achieved approximately when each colony is large or the migration rates among colonies is sufficiently high (cf., Figure 4 inMARUYAMA
1972). Since formula ( I O ) is assumed to hold for alli
and j , we may drop the sub- script and the superscript in the following.Let us now consider the change in gene frequency due to mutation, random mating, selection and migration. Then the mean change in gene frequency per generation ( M A q ) is given by
(1
-
h){
(1 -I u ) q+
U }M A , =
-
M [ A q f B -QI
[AQ
+
h+
~ ( 1 - 2h)][ (1-
~ ) q 4- U ]A q f B + u ( l - q ) 7 (11)
-
where M = m[l
-
r ( l ) ] , A = ( 1 - 2h) ( 1 - U ) , B = 1f
(1 - 2h)u andq =
The variance of gene frequency change per generation due to sampling of zygotes
( V A , )
is obtained as follows. At the time of sampling, there exists only two genotypes AA and A a with frequencies 1-
2q(l) and 2q(l), respectively, where q ( l ) is the gene frequency after migration. Thus, the sampling variance of the frequency of heterozygotes is 2q(,) [I - 2q(,,]/N. The sampling variance of the frequency of lethal genes is 0.25 of that. Therefore,E ( q ) .
The density function of the frequency of lethal genes in an equilibrium population can then be obtained by WRIGHT’S (1938) general formula:
25 0
'/e
C may be determined by
ol
+
(9) dq = 1, since the upper limit of gene frequency isx.
Thus the stationary distribution of lethal genes is given by
I; 1-U L
2B 4 B
4 N ( T - - -
+
-) 4 N ( - -t U f M q )-
1+(q) = G f ( q ) 4
L 1 -
B 4
4 N [ - T - -
+
-
(1-
3u) - M q ]-
1x
(1-29.1
7 (14)where
1
[ 2 ~ { 2 - (1 - 2 h ) ( 1 -3~)}{--M(1 - A )
4B[2
+
( 1 - 2h) (1 U)]T =
-
h - U ( 1 - 2h) }+
(1 - u)B{2-
4M( 1 - h )-
4h - (1-
2h) (1 f 5 u ) } ] ,L = - U [ M ( l - h ) + h + u ( l - 2 h ) ] ,
The mean,
6,
and the variance, Var(q), of gene frequencies in each colony f ( q >= &
+ B .can be computed as
B
= J"qO(q)dq(15)
~ a r ( g >
=,S
qZ+(q)dq- ( Q ) ' . (16) and'/e
Since the density (14) is very complicated and also contains Q, numerical integration must be used recursively to determine (5. It should also be noted that we need to know the value of r ( 1) at the beginning of the computation. This will be discussed later.
Two-dimensional habitat: Let us again assume that the frequency of lethal genes after migration at the ith locus in the (j,l)th colony, qi(jpz)', can be written as
qi'i,E) - m[l
-
r(O,l)] [qj(j,z) - E ( q i ( j f z ) ) ] qL(j,l) - m [l-
r ( 1 , 0 ) ] [qi(jyz)-
E(qi'jJ))].
(17) (18) qi(j,z)f or
Then the stationary distribution of lethal genes in each colony is given by formula (14), simply replacing r(1) by r(0,l) or r(1,O). Hence, the mean and variance of gene frequencies can be obtained numerically if the value of r ( 0 , l )
or r (1,O) is given.
Correlation coeficient of lethal gene frequencies
ALLELISM WITH DISTANCE 25
1
is so large that the mean gene frequency of a colony(g)
is approximately given by the equilibrium gene frequency in the absence of random genetic drift. There- fore, if there is no migration and the gene frequency in a colony in a generation is q, the gene frequency in the next generation(9")
is given byq'-tj= ( q - t j ) ( l - t ) (19)
dq'
dq q-q
approximately, where 1
-
t =-1
--
(SMITH 1969).In the present model,
-
-
-
(1 - h ) ( l - - u ) / [ l +( 1
-2h)(q(1 - U ) +u>12,whereas tj is given by [ ( { h
+
u ( 2-
3 h ) } 2 4 u ( l - U ) (1 I- h ) (1-
eh) ) %-
h - u(2 - 3h)]/[2 (1-
U ) (1-
2h)l. But u and h a r e small, so that the second-order terms are negligible. When lethal genes are partially recessive and
h2
>>
U,tj N u/h and t *-h. On the
other hand, when h"
<<
4u,4:
U and t = 2u (SMITH 1969; ~ R U P A M A 1972). The numerical relation between the mean gene frequency and effective popula- tion size in a single population has been studied byNEI
(1969). His results show that the mean frequency of partially recessive lethal genes is almost independent of population size except in very small populations, while the frequencies of completely recessive and overdominant lethal genes reaches the deterministic equilibrium value only in large populations (cf., Figure 4,NEI
1969). Thus, if lethal genes are recessive or overdominant, formula (19) may hold only when population size is at least of the order of the reciprocal of the mutation rate. This implies that, in a structured population, each colony must be large or the migration rates among colonies must be sufficiently high in order to attain con- dition (19). Since the following arguments hold for all loci,we
again drop the subscripti
for simplicity.One-dimensiona2 habitat: Let q ( j ) ,
i
= 1,2,
. .
.
,
be the amount of deviationof the frequency of lethal genes from Q in the jth colony. Using approximation (19),
CEg
h. When h2
>>
4u andh
>
0, Q -h and t(20)
q w
= ( 1-
t ) [ (1 -m)q(i)
+
-1
m(q(j-1)+
qU+l))]+
f ( i ),
2
approximately, where the prime indicates the quantity in the next generation
and
t(i)
is a random factor due to sampling.Substituting m, = (1
-
t ) m =B
and m, = t = 1-
cy-
P
in formula (4.3)and (4.4) in
WEISS
andKIMURA
(1 965),252
Two-dimensional habitat: For the numerical computation of r ( k l , k,) with a
small distance, the diagonal element
r(k,
k ) , where k, = k, = k , is useful. Sub- stituting m, = t and m l = m2 =(1
-
t ) (m/2) in formula (4.17) and (4.23)in
WE&
and KIMURA (1 965),r ( k , k ) =
__-_
(-1 ) [Q&i/z (-21)K
(\/-2p)+
K
(\I-
Q t - 1 / 2 (-22)
1
__
1 f Z , 1
fZ,
1 f Z , wheret2
+
2 t ( l-
t ) n+
(1 - t)*ma/2 ( 1-
t ) ,m2/22, = 7
( 2 - t ) 2 - 2 ( 1 - t ) ( 2 - t ) m + (1 -t),m2/2
(1 - t ) * m 2 / 2
2, = 7
and Qn(.) is a Legendre function of the second kind and
K ( . )
is a completeelliptic integral of the first kind.
As we saw in the previous section, the correlation coefficient of gene frequencies
r ( 0 , I ) [or r(I,O)] is important €or the evaluation of stationary distribution of
gene frequencies for a two-dimensional habitat. Therefore, it is necessary to evaluate A,(0,1)
4-
A2(0,1) [or A,(1,0)4-
A,(l,O)].In
our caseAI (070)
1
-
( 1-
t ) (1-
n)(1 - t ) m
A,(0,1)
+
A2(0,1) =-A2 (0,O)
1
+
(1
-
t ) ( 1-
n)(I
-
t ) m-
(see WEISS and KIMURA 1965)
Asymptotic behavior of the rate of allelism of lethal genes
The correlation coefficient of the gene frequencies between two colonies de- creases as distance increases. It is expected that, as k or k ,
+
k, increases, the rate of allelism will eventually reach its asymptotic value, l / n [see formula (7) and ( 9 ) ] . Therefore, we will now investigate this asymptotic relationship. It should be noted that the following analysis holds under the condition that we previously assumed; namely, each population should be large or the migration rates between colonies be high.One-dimensional habitat: Since r
(k)
Var (4)< <
n( q )
for large k, formula( 7 ) can be approximated as
( 2 4 )
Hence, E [ Z ( k ) ] consists of two parts: l / n and r(k)Var(q)/n(g)2. Note that the second term decreases as
k
becomes large, simply becauser(k)
decreases for larger k. Thus our attention should be focused on the asymptotic behavior ofr ( k ) , which was studied extensively by WEISS and KIMURA ( 1 9 6 5 ) .
ALLELISM WITH DISTANCE 253 Since we mostly deal with the case of nearly recessive lethal genes, the con- dition
/
t1
< <
m would generally hold. In this case the following approximation may be made:~ ' ( 1
+
a),-
pz
v'(1
-
a),-
8 2 d 2 l t l m.
2v'i -
It1-
mand
Thus, with sufficient accuracy,
+
A,(O)
(v'21tlm)-1,(27)
(28)
(29)
r
( m-
d 9 p i m m I k
d2l*
A , ( k ) + A , ( k )e A l ( k )
=
Hence,
It should be noted that A , ( k ) can be ignored in (28) only when It]
<<
m, as explained byWEBS
andKIMURA
(1965).r ( k ) = exp(-d2ltl/m k )
.
Therefore, for a large k and if It1
<
<
m, formula (24) will beNow it is clear that the rate of allelism decreases
--
exponentially with distance, and the rate of the decrease per unit step is d21t I/m.Two-dimensional habitat: From formula (9) we get the following approximate formula :
Denoting m, = t and m, = m, = (m/2) (1 - t) in formula (4.40) in
WEISS
andKIMURA
(1965), we getwhere
C-I = A , (0,O)
+
A , (0,O),
R2 = k:+
k;.
Therefore, formula (31) can be approximated as
E[Z(k,,k,)]
=L+
Var(q) ( % ) 1 ' 4 e x p ( - 2 d m R ) / d x (33)n(ij)z 2 d T m
n for a large kl
+
k,.lar to formula (29) and (32) for a continuum habitat, using the coefficient of kinship.
Computer simulations and numerical examples
In the above analysis I used a series of approximations. Approximations in formula (4) (or (9) )
,
(IO),
[or(1
7) and (18) ] and (20) especially may create some errors. It is not easy, however, to evaluate analytically the magnitude of these errors. Thus,I
shall examine these approximations using computer simula- tions, considering two quantities separately. First, the mean and variance of gene frequencies in each colony will be studied to see the joint effect of formula(IO) and (20). Second, the relationship between the rate of allelism and dis- tance will be studied to check approximations (4) and (20). Since we cannot construct infinitely many colonies, a circular stepping-stone model with ten colonies was used. Each colony consisted of 100 individuals
( N
= 100) and initially all A A genotypes. In each generation new mutant genes were intro- duced with U = 0.001. Then mating, selection, migration and sampling followed,in that order.
As already noted,
WRUYAMA
(1972) studied the genetic correlation, using a circular stepping-stone model. Comparison of his formula (12) with ten colonies to our formula (21) shows that genetic correlation is always higher in a finite circular stepping-stone model. However, the difference in genetic correlation for a small distance between the finite and infinite stepping-stone models is very small.The mean and variance of gene frequencies: In this simulation, each step
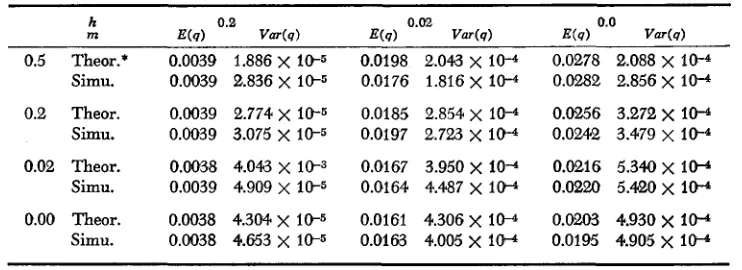
was done deterministically, except for the sampling process. Starting at genera- tion 70, gene frequencies were computed after sampling every 40th generation until generation 190. Fifteen replications were used (i.e., a total of 60 observa- tions). Since the mean and variance of gene frequencies in each colony are virtually the same for a circular stepping-stone model with ten colonies and an infinite stepping-stone model, we directly compare simulation results with the theoretical expectations from an infinite stepping-stone model. Theoretical values were computed numerically from formula (15) and (16). In simulations, the variance of gene frequencies was calculated by taking the mean of the variances in ten colonies. Hence, the calculation of variance depends on the assumption that observations 40 generations apart are uncorrelated. Various combinations of h = 0.0, 0.02 and 0.2, and m = 0.0, 0.02 and 0.2 were considered. Results are shown in Table 1. Simulation results and theoretical expectations seem to agree satisfactorily. This good agreement may be due to the fact that an underlying distribution of gene frequencies has a very small variance about its mean. This also confirms MARUYAMA’S ( 1972) simulation results.
The rate of allelism of lethal genes: T o compute the rate of allelism, I used
five completely linked loci, because of simplicity in programming. The difference between complete linkage and free recombination among loci is not critical for our purpose, as we will see later.
ALLELISM W I T H DISTANCE 255 TABLE I
Comparison of simulation results wiih theoretical expectations
h
m
0.5 Theor.* Simu.
0.2 Theor. Simu.
0.02 Theor. Simu.
0.00 Theor. Simu.
0.0039 1.886
x
10-5 O.GQ39 2.836x
10-50.0039 2.774
x
10-5 0.0039 3.075 X 10-50.003s 4.043 X 10⁻³ 0.0039 4.909
x
10-50.0038 4.304
x
10-5 0.0038 4.653x
10-50.0198 0.01 76 0.0185 0.0197 0.0167 0.0164 0.0161 0.0163
2.043
x
104 1.816x
10-42.854
x
10-4 2.723 X 10⁻¹ 3.950x
104 4.487x
10-14.306
x
ID”-4.005
x
10-10.0278 2.088
x
10-4 0.0282 2.856x
10-40.0.256 3.271,
x
10-4 0.0242 3.479x
10-40.0216 5.340
x
10-4 0.0220 5.420x
10-40.0203 4.930
x
10-4 0.0195 4.905x
10-4* The theoretical value was computed byusingformdae (15), (16) and (21).
Parameters used were N = 100 and U = I W . h = selection coefficient against heterozygotes
and m = migration rate.
distribution with mean 2Nnu, i.e., (2) (100) ( 5 ) (0.001) = 1. (2) Each of these chromosomes was chosen at random with replacement. Furthermore, the locus at which a new mutant would appear was chosen at random.
If
the locus was occupied by a lethal gene, then another locus was picked.If
all five loci were filled with lethal genes, then another chromosome was chosen. (3) After this process of mutation, two gametes were picked at random, sampling each with replacement fromN
adults.If
an individual has at least one homozygous lethal locus, then this particular individual was discarded. Otherwise, the probability of an individual being chosem was made proportional to its fitness. The fitness of an individual carrying s lethal genes was taken to be (1-
I Z ) ~ ,
i.e., the selection was multiplicative between loci. (4) The individuals were then exchanged among colonies, following a specified rate of migration. These steps were repeated in each generation. Complete linkage among five loci and sampling of gametes, not zygotes, were considered in the present simulation, because of programming simplicity. However. differences between the theoretical study and the simula- tion procedure are not critical, as we will see now. Linkage cannot be important if the chance of having more than one lethal in a chromosome is small, as pointed out byROBERTSON
andNARAIN
(1971). Consider the case ofh
= 0.02 andm = 0.02. Then
Q
5q
= 0.0835. The probabilitythat a chromosome contains no lethal genes is exp(-0.0835) = 0.9199. Similarly, the probabilities that a chromosome contains one, two and three lethal genes are approximately 0.0768, 0.0032 and 0.0001, respectively. Thus, the chance that a lethal chromosome contains more than two lethal genes is less than 5
%
.
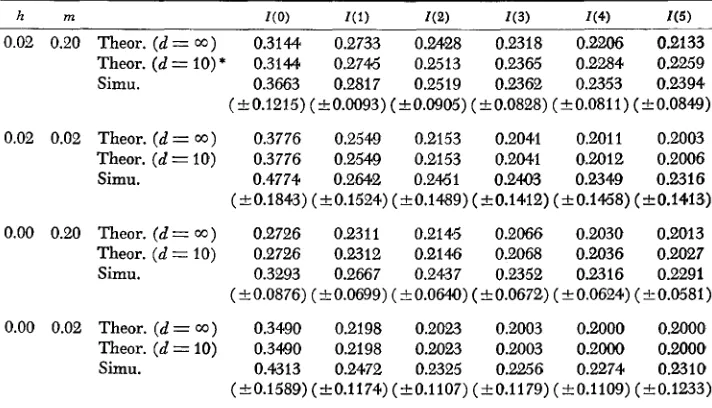
Therefore, the effect of linkage is expected to be small. The difference due to the sampling of genes and zygotes would not be so serious because of low lethal gene frequencies.Theoretical expectations of the rate of allelism of lethal genes were computed from formula (7), together with formulae (15), (16) and (21). The rate of
5
%=I
6
allelism of lethal genes was calculated after migration every 20th generation, starting with generation 100 until generation 1100. i.e., a total of 51 observa- tions. The variance of the rate of allelism between two specific colonies was cal- culated, using 51 observations. Note that the variance for Z(0) was calculated within each colony, as we calculated the means and variances of gene frequencies in the previous simulation. Ten sets of such variances are obtained for Z(0)
Z(4)
and five forZ(5).
Taking the mean of these variances, we get the variancesof the rate of allelisms. Results are shown in Table 2. It should be noted that the mean frequencies of lethal chromosomes sampled ranged from 0.078 to 0.1 10 for different combinations of h and m. These values are very close to those com- puted by
Q
= 1-
e x p ( - 5 ~ ) . Thus, the gene frequencies used may well be regarded as samples from equilibrium populations. Although simulation results have large standard deviation, the agreement between theoretical expectations and simulation results is quite satisfactory, especially for large m.Using formulae (21) and (22), together with (24),
I
have computed the correlation coefficient r(1) and r(0,l) [or r ( I , O ) ] . I also computedr(k)
andr(k,
k)
using formula (21 ) and (22). The expected rates of allelism of lethalTABLE 2
Rate of allelism of lethal genes
0.02 0.20 Theor. ( d = 0 0 ) 0.31M 0.2733 0.2428 0.2318 0.2206 0.2133
Theor. (d = IO) * 0.31M 0.2746 0.2513 0.2365 0.2284 0.2259 Simu. 0.3663 0.2817 0.2519 0.2362 0.2353 0.2394 (k0.1215) (k0.0093)(+0.0905)(k0.0828) (f0.0811)(20.0849)
0.02 0.02 Theor. (d = 0 0 ) 0.3776 0.2549 0.2153 0.2041 0.2011 0.2003
Theor. ( d = 10) 0.3776 0.254Q 0.2153 0.2041 0.2012 0.2006 Simu. 0.4774 0.2642 0.2451 0.2403 0.2349 0.2316 (k0.1843) (k0.1524) (20.1489) (+0.1412) (k0.1468) (C0.1413)
0.00 0.20 Theor. (d= W ) 0.2726 0.2311 0.2145 0.2066 0.2030 0.2013 Theor. ( d = 10) 0.2726 0.2312 0.2146 0.2068 0.2036 0.2027 Simu. 0.3293 0.2667 0.2437 0.2352 0.2316 0.2291 (e0.0876) (k0.0699) (kO.064Q) (k0.0672) (-+0.0624) (e0.0581)
0.00 0.02 Theor. (d = W ) 0.3490 0.2198 0.2023 0.2003 0.2000 0.2000 Theor. ( d = IO) 0.3490 0.2198 0.2023 0.2003 0.2000 0.2000 simu. 0.4313 0.2472 0.2325 0.2256 0.2274 0.2310 ( t0.1589) (C0.1174) (20.1 107) (k 0.1 179) ( k 0.1109) (2 0.1233) Parameters used were N = 100 and U = 10-3. h = selection coefficient against homozygotes, * I n this computation, the correlation between gene frequencies in two populations that are k
m = migration and d = number of colonies.
steps apart is given by
n
z
[(1--)~cos2IIik/lO][1- (1-t)2hJz [ (1
-
s)2]/[1 - (1 - 1)2X,]i=1
r(k) =- 9
i=l
ALLELISM WITH DISTANCE
25
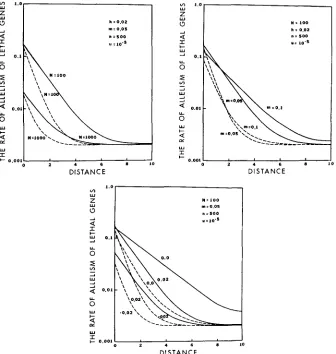
7 genes for one- and two-dimensional models were then obtained by formula ( 7 )and (9). The results obtained are shown in Figures l a to IC.
It is seen that the rates of allelism within and between populations are smaller for the two-dimensional model than for the one-dimensional model. Further- more, in each model the rate of allelism is lower when the effective size of each colony is large than when it is small (Figure l a ) . This inverse relationship between the rate of allelism of lethal genes and the effective population size has been obtained by
NEI
(1968) in a single population.In
a structured population, the allelism rate declines slowly with distance when the colony size is large. It is also smaller for the two-dimensional model than for the one-dimensional model.w
Lu
z
(3 Q
I
A
h : 0.02 m:o.os . = s o 0
Y : 10.3
c- 0.001
oko
U
w Z 0
Q
r
A
DISTANCE
N = 100 h i 0.02 n i so0
U: 10-5
,
1.0
v)
N . 100 nl i 0.05
n i so0
E
0.001 + oD I S T A N C E
The effect of migration on the rate of allelism can be seen in Figure
Ib.
The rate of allelism within or between very closely located colonies decreases as the migration rate increases. This is so because, when the migration rate is high, the chance of lethal genes at a particular locus leaving a colony is high. On the other hand, the rate of allelism for the two colonies separated by a long distance is higher when the migration rate is high than when it is low. This occurs simply because lethal genes can move for a long distance in the presence of a high rate of migration. Consequently, the rate of allelism decreases slowly with distance when m is large.The effect of heterozygous selection on the allelism rate is somewhat compli- cated (Figure IC). In a single population, the rate of allelism is higher when h
is positive than when it is negative, as shown by
ROBERTSON
andNARAIN
(1971 ).
However, this is not the case with the rate of allelism between colonies. The rate of allelism between colonies is higher whenh
= 0 than when h is 0.02 or -0.02. Thus, in the case of h = 0, the rate of allelism declines with distance at a slower rate than that when h = 0.02 or -0.02.DISCUSSION
In the present study we have assumed linkage equilibria among lethal loci.
In practice, this assumption may not be realistic. However, as long as the prob- ability that a chromosome contains more than one lethal gene is small, the effect of linkage should not be important. In the study of lethal chromosomes of
D.
pseudoobscura in the Death Valley region in California and Nevada,
DOBZHAN-
SKY and
WRIGHT
(1941) estimated the probability that a chromosome contains zero, one, two and three lethals to be 0.8471, 0.1406, 0.0117 and 0.0006, respec- tively. If this is a common phenomenon in nature, a majority of lethal chromo- somes contains very few lethal genes, most probably one.ROBERTSON
andNARAIN
(1971) simulated the dynamics of recessive lethal genes with free and no recombination, assuming infinitely many loci in a single population. In their simulation, a high frequency of lethal genes was used to pronounce the effect of recombination. Their results show that at equilibrium lethal genes remain somewhat longer in a population with no recombination than with free recombination. This suggests that the genetic correlations between subpopulations in a structured population become higher due to restriction in recombination. This higher genetic correlation will increase the value of the rate of allelism between colonies, and therefore, the present analysis may to some extent underestimate the rates of allelism between colonies. Their simulations also indicate that the rate of allelism of lethal genes within a population is higher for free recombination than for no recombination. The observed value was 0.073 and 0.059 for free and no recombinations, respectively, whenN
=50,
U = 0.05 and h = 0.0. Therefore, the rate o€ allelism is expected to decline at a
ALLELISM WITH DISTANCE 259 fore, for practical purposes, the present analysis seems to be satisfactory as a first approximation.
As previously mentioned, there is a large amount of data on lethal chromo- somes in Drosophila populations. However, only two sets of data are relevant to the present theory. WALLACE (1966a) studied the rate of allelism of lethal chromosoemes f o r chromosome 2 and 3 in
D.
melanogaster. In his allelism test, both lethal and severe semilethal chromosomes were included. The observed rate was 0.0461, 0.0365, 0.0324 and 0.0275 for distance 0 m, 30 m, 60 m and 90 m,respectively. In his data, the total frequency of lethal and semilethal chromo- somes amounted to 79.8% for chromosomes 2 and 3 together. Using this value, it is possible to compute the rate of allelism of lethal genes [see formula (3)]. I t becomes 0.0116, 0.0092, 0.0081 and 0.0069 for distances 0 m, 30 m, 60 m and 90 m, respectively. PAIK and SUNG (1 969) also sampled
D.
melanogaster every 30 m linearly on two occasions. They also used chromosomes 2 and 3 together to get the allelism rate of lethal chromosomes. If we compute the rate of allelism of lethal genes from their results, it becomes 0.0228, 0.0225. 0.0166. 0.01 15, 0.0104 and 0.0088 for distances 0 m, 30 m,. .
.
and 150 m apart for the first sample, and 0.01 79,0.0128,0.0111,0.0100,0.0078,0.0075 and 0.0066 for distances 0 m, 30 m,.
. .
and 180 m for the second sample. It should be noted that they used only lethal chromosomes in the first allelism test, but both lethal and semilethal chromo- somes were included in the second test.Let us now consider a simple model. Assume that colonies are located roughly every 30m apart linearly and that flies are sampled from these colonies. Although this model is quite artificial, it may not be too unrealistic. According to WALLACE (1966b),
D.
melanogaster is rather restricted in its dispersion:60 to 80% of the individuals of this species collected at one spot may have a point of origin lying within a radius of 25 m.
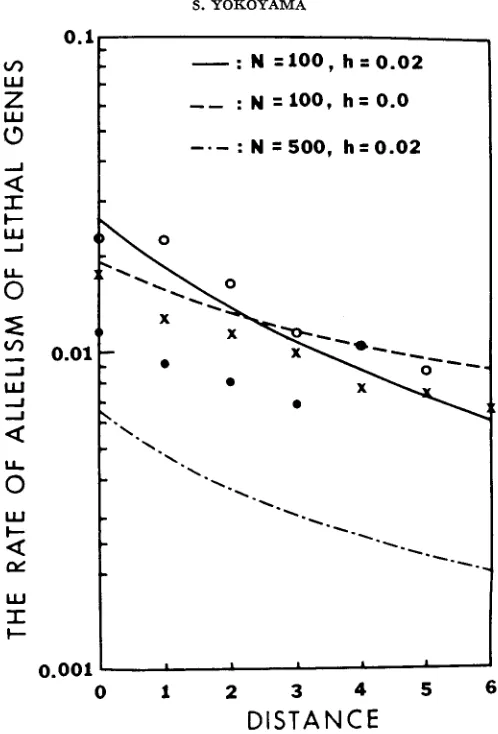
The rates of allelism of lethal genes are shown in Figure 2. The allelism rates from WALLACE'S (1966b) data are slightly lower than those from PAIK and SUNG'S (1969) data. However, the rates of allelism decline with distance with a similar rate in all cases. I also computed the theoretical rates of allelism of lethal genes, using the one-dimensional model, for different combinations of population parameters:
N
= 50, 100, 500 and 1000; m = 0.02, 0.2 and 0.5;n = 300, 400,
.
. .
and 1000; h = 0.00 and 0.02. The mutation rate was assumed to be I t 5 . From these, I picked three cases:N
= 100,h
= 0.02; (2) N = 100,h = 0.0; (3)
N
= 500, h = 0.02, together with m = 0.5 and n = 1000, which are also shown in Figure 2. The first two cases were chosen because they seem to have a better fit to the data from PAIK and SUNG (1969) than other cases. The third case was chosen simply to show the effect of colony size on the allelism rate. It should be noted that the values of h are chosen to be positive in the computation, because lethal genes seem to have a deleterious effect in the heterozygous condition (WRIGHT, DOBZHANSKY, and HOVANITZ 1942; CROW and TEMIN 1964; NEI 1968). For example, NEI (1968) estimated the value of hto be about 0.017. Furthermore, the number of lethal loci in chromosome 2 of
0.001
'
10 1 2 3 4 5 6
DlSTAN
C
E
FIGURE 2.-The rate of allelism of lethal genes applied to real data by WALLACE ( 1 9 6 6 ~ ( 0 ) and PAIK and SUNG (1969) (X and
0).
Observed data on the rate of allelism of lethal chromosomes are converted to the rate of allelism of lethal genes using formula (3). The valuesm = 0.5 and n = I000 were used in the theoretical computation of the rate of allelism.
WALLACE 1950). Since we are dealing with chromosomes 2 and 3 jointly, n = 1000 may be reasonable.
Figure 2 suggests that the two populations from which WALLACE (1966a) and PAIK and SUNG (1 969) sampled may have very similar population structures: each colony has a small population size and migrations among colonies are extremely high.
ALLELISM WITH DISTANCE 26 1 dominant selection, as OSHIMA pointed out.
In
his case, the allelism rate was unusually high even between populations.As mentioned in the introduction,
WALLACE
(1966a) postulated that the rate of allelism resulting from chromosomes of common descent decrease exponen- tially with the square root of distance. The present study shows that the relation- ship between the rate of allelism and geographic distance depends strongly on the underlying population structure. The asymptotic behavior of the rate of allelism of lethal genes with increasing distance indicates that the rate of allelism decreases with distance more rapidly thanWALLACE
(1966a) originally thought.If
colonies are located linearly, then the rate of allelism decreases exponentially with distance. When colonies are located two-dimensionally, the rate of allelism will decrease with distance even faster.This paper is based in part on a partial fulfillment of the Ph.D. degree from the University of Washington. I would like to thank my thesis adviser, J. FELSENSTEIN, for his help and en- couragement during this study. I am also indebted to M. NEI who suggested the subject of this paper. I express my gratitude to J. FELSENSTEIN, M. NEI, W-H. LI, B.S. WEIR and reviewers f o r valuable suggestions.
This research was supported by ERDA contract AT(45-1) 2225 TA 5 with the University of Washington, Public Health Service grants AA-03539 and MH-31302 with Washington University, and GM-20293 to M. NEI.
LITERATURE CITED
CROW, J. F. and R. G. TEMIN, 1964
DOBZHANSEY, TH. and S. WRIGHT, 1941
Evidence f o r the partial dominance of recessive lethal genes in natural populations of Drosophila. Am. Naturalist 98: 21-33.
Genetics of natural populations. V. Relations between mutation rate and accumulation of lethals in populations of Drosophila pseudoobscura. Genetics 26: 23-51.
IVES, P. T., 1945 Genetic changes in American populations of Drosophila melanogaster. Proc. Natl. Acad. Sci. U S . 40: 87-93.
KIMURA, M., 1953 “Stepping stone” model of population. Ann. Rept. Nat. Inst. Genet. (Japan)
3: 62-63.
KIMURA, M. and G. WEISS, 1964 The stepping stone model of population structure and the decrease of genetic correlation with distance. Genetics 49: 561-576.
MALECOT. G., 1959 Les modeles stochastiques en genetique de population. Publ. Inst. Stat. Univ. (Paris) 8 : 173-210. -, 1967 Identical loci and relationship. Proc. Fifth Berkeley Symp. Math. Stat. Prob. 4: 317-332.
Distribution of gene frequencies in a geographically structured popula- tion. 111. Distribution of deleterious genes and genetic correlation between different locali- ties. Ann. Human Genet. 36: 99-108.
The frequency distribution of lethal chromosomes in finite populations. Proc. Natl. Acad. Sci. U S . 60: 517-524. -, 1969 Heterozygous effects and frequency changes of lethal genes in populations. Genetics 63 : 669-680.
OSRIMA, C., 1969 Persistence of one recessive lethal gene in natural populations of Drosophila mslanogasier. Jap. J. Genet. 44: 209-216.
PAIK, Y. K. and K. C. SUNG, 1969 Behavior of lethals in Drosophila melanogaster populations. Jap. J. Genet. 44: 180-192.
MARUYAMA, T., 1972
ROBERTSON, A. and P. NARAIN, 1971
SMITH, C. A. B., 1969 WALLACE, B., 1950
The survival of recessive lethals in finite populations.
Local fluctuations in gene frequencies. Ann. Human Genet. 32: 25-260. Allelism of second chromosome lethals in Drosophila melanogasfer. Proc. Natl. Acad. Sci. US. 36: 654-657.
--,
1966a Distance and the allelism of lethals in a tropical population of Drosophila melanogaster. Am. Naturalist 100: 565-578.-,
1966bA mathematical analysis of the stepping stone model of genetic correlation. J. Appl. Prob. 2: 129-14.9.
The distribution of gene frequencies under irreversible mutation. Proc. Natl. Acad. Sci. U.S. 24: 253-259. -, 1940 Breeding structure of populations in relation to speciation. Am. Naturalist 74: 232-248.
WRIGHT, S., TH. DOBZHANSKY and W. HOVANITZ, 1942 Genetics of natural populations. VII. The allelism of lethals in the third chromosome of Drosophila psoudoobscura. Genetics 27 :
Corresponding editor: B. S. WEIR Theor. Pop. Biol. 2: 24-50.
On the dispersal of Drosophila. Am. Naturalist 100: 551-563. WEISS, G. H. and M. KIMURA, 1965
WRIGHT, S., 1938