SCALING THRESHOLD CHARACTERS DANIEL GIANOLA AND H. W. NORTON
Department of Animal Science, University of Illinois, Urbana, Illinois 61801
Manuscript received May 5, 1981 Revised copy received July 24, 1981
ABSTRACT
A simple method of scaling ordered categorical responses having a joint dis- tribution with an underlying normal variable is presented. Scores are developed that maximize heritability of the observed variate and that in the class of scores based on polychotomies: (1) maximize the correlation between score and the underlying genetic value to be predicted, and ( 2 ) minimize mean-square prediction error. Several examples suggest little is lost, i n terms of heritability, by using equally spaced scores. The proposed scaling method discriminates among candidates for selection that would be tied if equally spaced scores are used and sometimes yields different rankings of candidates.
I N many traits with a genetic basis such as litter size in sheep or swine, the ex- pression of the character is a response in one of several mutually exclusive and exhaustive ordered categories. Several authors (e.g.,
WRIGHT
1934; DEMPSTER and LERNER 1950) have assumed an underlying normal distribution of pheno- types. The normal random variable has a joint distribution with the observed discrete variable, with the mapping being done via a set of fixed thresholds. DEMPSTER and LERNER (1950) have shown that for binary variables, selection i n the observed scale results in smaller genetic gains than would be realized from selection in the underlying scale. When the prevalence of the character is equal to the proportion of individuals required as parents, selection i n the observed scale yields the same genetic gain as selection upon the underlying variate.I n many animal breeding applications where the threshold model is assumed, the categories of response are scored linearly (e.g., BERGER and
FREEMAN
1978) and the resulting phenotypic values are analyzed by linear model methodology. A discussion of problems associated with this approach was presented by GIANOLA(1 980). While there is question as to the meaning of heritability estimates ob- tained from raw data, as opposed to those obtained from transformations such as probits (e.g., LUSH, LAMOREUX and HAZEL 1948; ROBERTSON and LERNER, 194+9), it is possible to develop scores that are optimal i n some sense. We describe a scor- ing procedure fur categorical variates with a n underlying normal distribution, and its implications on a selection program.
SCORING PROCEDURE
358 D. G I A N O L A A N D H. W. N O R T O N
in one of m mutually exclusive and exhaustive ordered categories. The phenotype in the observed scale may be represented by an m X 1 random vector, U , which has elements equal to 1 in the position corresponding to the category of response and equal to zero elsewhere. If IT( is the probability of response in the ith category (with
=
I ) , the covariance matrix of U has elements I& (I-&) fori
= I,.
. . ,
m, and-ninj fori#j.
It is assumed that there is an underlying normally distributed trait (y),
with heritability h2 in the narrow sense, having a joint dis- tribution with the observed variate. In the underlying scale there is a set of m-
1 fixed thresholds t' = [tl, t2,. .
.
,
J t, defining the m response categories. With t o = --CO and tm = CO, the experimental unit responds in the ith category if ti-1<
A common practice in animal breeding is to score response categories by a vector of weights a' = [al,a2,.
.
.
,am], so that the scored phenotype is a'u. It can be shown ( GIANOLA 1979) that the heritability of a'v is given by-
In,
i=1
-
I
y
<
ti.-
- -
--
i
k=l
where zo = z, = 0 and
zi
I= exp ( - - t 2 / 2 ) / d - with ti = cp-I ( 2Ih).
The ratioh:/h2 is less than 1 and not invariant to a except when m ,=
2.
In this case, (1) reduces to ht =h2z2//II(
1 - n ),
a well known result due toROBERTSON
(seeDEMPSTER
and LERNER 1950). It should be noted that hi/h2 is also invariant tolocation and scale changes in a since
N
-
m m
s, (ai
+
k)
(Zi-1- Zi) /a =z:
ai (Zi-1-
Zi) /ai=1 i =1
IIt
because. 2
-
zi) = 0, and *=1m m
Var [ ( d f 1%) u / a ] ,= 8 Var (a'v)
=
a-"[ Ba2ni
- (,x
ai11;)~1,
Y - Y
--
i=l i 1=1where k and U are scalars and
-
1 is a vector of ones.In general, one may wish to find a value of
-
a that maximizesI n , m
where xi = zi-l
-
zb. These "optimal" scores applied to data would yield the linear transformation with maximum heritability. Differentiating (2) with respect to a , setting to zera and rearranging gives the following system of simultaneous equations-
SCALING THRESHOLD CHARACTERS 359
Differentiating again, the conditions for (3) to give a maximum are
In view of the invariance of h;/hz to location and scale changes in a , only scales with mean value equal to zero, i.e.,
z
aini
,= 0, need to be considered. Hence(3) has solution
m
-
i=1
U
a; = Kxi/rIi
,
( 5 )
where
K
is an arbitrary constant which can be conveniently set toK
I= 1. Further,x+/IIi can be interpreted as the mean value of the ith class of a standard normal variate
with
classes with proportions II~,i
= 1,. . .
,m. It also follows that theW Y
-
optimal" scores are monotonic, i.e., a1
<
a,. .
.
<
h. For anyk
such that 2I i
+
L L
-
-
k
5 m, ai+k-
ai>
0 if x;+g/!&+l~>
x&. Letting .46 ( U ) and + (U) be the nor- mal density and distribution functions, respectively, by Cauchy's Mean Value thwremfor ti-l
<
c<
ti. Since $' (c)/+' (c)=
-c, the inequality X { + ~ / I I ; + ~>
xt/II; can be written as c+
A>
c. As A is positive, monotonicity of the scores is established.- m c
Further, it can be verified that F ( a )
-
= .2 x?/IIi. Since z?/IIi(l-ni)
< F ( a ) =m=i z U
-
h," (a ) /hz, the conditions for a maximum are satisfied.
Maximizing ( 2 ) with respect to a is also analogous to the maximization of generalized squared distance in discriminant analysis ( SNEDECOR and COCRRAN 1967). The problem requires solving
-
U
where 2: = Var
(v)
,
k*
is a constant andx'i=
[xl,xz,.
. .
,
xm].
In this case a would contain the coefficients of the canonical variate, andx
would be the vector of mean differences between populations. From the form of I 2 and settingk*
= 1, equations(6) can be written as
-
-
-
-
-
-
m -I&
[ a i-
,Z ail&] I= xi ;i =
1 , ..
.
,m,
and in view of the location invariance of the objective function, one can take
ai = xi/& as solution; this is, of course, identical to
( 5 ) .
The scores are conditional in the probabilities and these are rarely known in advance. If maximum likelihood estimates of & are used to solve (3), then by the invariance property (e.g., MOOD, GRAYBILL and
BQES
1974) the resulting scores are maximum likelihood estimates of a.a=1
-
360 D . GIANOLA A N D H. W. N O R T O N
I M P L I C A T I O N S O N S E L E C T I O N
Genetic change of a merit function T per generation after one round of trunca- tion selection with a predictor T is given by
AT i p ( T , T ) UT
.,
(7)where
i
is the standardized selection differential or selection intensity, p (T,T) is the correlation between merit function and predictor. and uT is the standard deviation of the merit function. Selection intensity depends solely on the propor- tion selected (a),
e.g., in the multivariate normal distributioni
= z/a, where z is the ordinate at the point of truncation that divides the normal curve into two sectors with areas a and 1 - e. Hence, differences in AT stemming from using alternative predictors must be examined in terms of differences in p(T,T). Let T = g be the additive genetic value in the underlying normal scale.The problem is to predict the unobservable genetic value (g) of a set of can- didates for selection on the basis of a vector of observable records. If the candi- dates' g's and their records are uncorrelated with those of other candidates, the best selection rule is the conditional expectation of g given the data (COCHRAN 195 1 )
.
This rule: ( 1 ) is unbiased and minimizes mean-square prediction error among all predictors, (2) maximizes the correlation between predictor and pre- dictand, ( 3 ) maximizes the expected value of the predictand in the selected set upon truncation selection on the rule. and(4)
maximizes genetic progress if the predictand and the records have a multivariate normal distribution.In the underlying scale, g, and the phenotypic value of an individual, y , are assumed to be bivariate normal. By scaling and centering such that E ( y ) =
E ( g ) = 0 , u~, = 1, U, = h, p(ylg) = h, the joint density of g and y can be written as
4
( g , y ) = exp{- [y?-2 hyg+
g ' ] / [ 2 ( 1,-h2)] }/[2n(1-h2)
$61
(8) If y were observable, the best selection rule would be ? ( y ) = E ( g / y ) = h2y. so that A T ( y ) =ih'.
However. the thresholds polychotomize y into a discrete variable Y such that a response in the ith category. Y =
i
( i = 1,. . .
,m), occurs if th-l<
y<
ti. The joint distribution of g and Y is given byf i ( g ) = Prob {ts-l
<
y<
ti,g
<
G<
g + d g } ;i =
1,..
.
,m.
(9) The conditional distribution of g given Y =i
ist , t ,
z -1 8 s - x
S C A L I N G T H R E S H O L D C H A R A CT E RS 361 Note that
T (
Y
.=i)
= h2zi/lT+ = h2a+, where ai are the “optimal” scores. Hence?(Y)
= h2a’u, is the best selection rule when y is not observable. The criteriona’u will yield the same ranking of candidates as T
(Y).
Now, from results ofROBERTSON
(DEMPSTER and LERNER 1950) and of GIANOLA (1979)-
-
-
-
--
Y
which is always larger than one. From (13), it also follows that A T ( a ’ v )
>
~ ~ ( a ’ u ) for a n y a sinceP(2) > ~ ( a ) .
We have shown that a‘ U is the best selection rule or best predictor when y is not observable. The best predictor and best linear predictor are the same i n this case. The best linear predictor can be obtained from the selection index equations
- -
Y-
-
- -
- -
Z
--
a = Cov(v,g)-
= h2x-
,
(15)which are identical to (6). Hence, the set ai = xi&
i
= 1,.
.
. ,
m has the fol- lowing properties in the class of predictors when only a polychotomy { Y=i} is ob- served: (1) maximizes heritability i n the observed scale, (2) is unbiased and minimizes mean square prediction error, and (3) maximizes the correlation be- tween a’u and g. Since g and u do not follow a multivariate normal distribution, other properties of the best predictor in the multivariate normal case do not hold for d u : (1) maximization of genetic progress (this is achieved by f ( y ) = h 2 y ) ,( 2 ) maximization of the probability of overall correct ranking when the candi- dates for selection are independent and identically distributed, and (3) maxi- mization of the probability of correct pairwise ranking when all gelletic values to be predicted have the same expectation.
Several examples suggest that, in general, equally spaced scores will result in negligible losses in terms of heritability. Consider m= 3, rIl = IT, = 0.1587, r12 =
0.6826, so that the distribution i n the observed scale is symmetric. I n this case, any set of equally spaced scores will yield the maximum h,2/h2 = 0.7380, i.e., the “optimal” linear transformation of the scores would be about 74% as heritable as the variable i n the underlying scale. With m =
4,
HI = IT4 = 0.05 and = :I3 = 0.45, the maximum is h:/h2 = 0.8142. The usual scores ai =i,
f o ri
= 1,. .
.
,4 yield h”,hz = 0.8138. The increase in heritability resulting from the “op--
--
-
362 D. GIANOLA A N D H. W. N O R T O N
timal” scores is negligible because the mean values for the categories are almost equally spaced in the underlying scale. The proposed scaling procedure yields some increases in heritability in the outward scale when the outward distribu- tion is highly skewed, as illustrated in Table 1. For example, if m = 3, TI, = TI2
=
0.005 and
a3
= 0.99, the “usual” scores al I= 1, a2 I= 2 and a3 = 3 give hi/h2 =0.06827, compared to 0.07237 for a, = 0, a2 = 1 and a3 = 6.53 resulting from the development proposed here.
The impact of this increase in heritability is less in sib selection or progeny testing programs. It is well known (e.g.,
HENDERSON
1963) that the correlation between the additive genetic value of a candidate for selection and the mean of single records of n full sibs is given by k(n,h;) = {nh2,/[4+
2(n--l>h;]}%.If
h2 = 0.5, the usual scores give
&=
0.03414 andk
(4, 0.03414) = 0.1802. With the “optimal” scores of ht = 0.03619 andk
(4, 0.03619) 0.1852. Thus, a 6% larger heritability in the outward scale results in only a 2.8% difference in the accuracy of prediction when n =4.
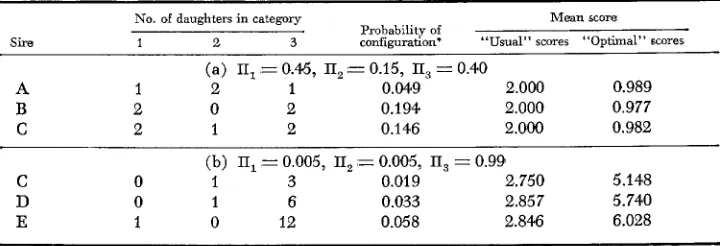
As n gets larger, this difference becomes smaller, as the family mean tends rapidly towards normality.It is interesting to observe that “optimal” scores may alter the ranking of candi- dates for selection. Consider a situation where the progeny of three sires are scored for a trichotomous variate for which the assumption of underlying normality is plausible. In case (a) of Table 2, the three sires would be ranked the same with the ‘‘usual’’ equally spaced scores, but the “optimal” weights discriminate among these candidates for selection. Taking into account the varying amounts of infor- mation also would have changed sire rankings with the “usual” scores. In case (b)
,
the usual scores yieldD
>
E>
C, but with the “optimal” scores, the ranking is changed, E>
D>
C. This change of ranking also occurs in real-life data from performance-tested cattle and may be important (FERNANDO et al. 1981).RAE (1950) considered the problem of developing a scale that would maximize the regression of offspring on dam in the context of scoring fleece quality in sheep. Data were arranged as a p X p contingency table with p grades for dams on one axis and those of the offspring on the other; the entries were the number of dam-
-
-
TABLE 1
Effect of scores on the ratio of heritability in the outward scale (hi) to heritability in the underlying scale (hg) for selected cases
~ _ _ _ _ _
Cases
h:/hZ “Usual” scores
N o . of categories Probabilities of response (a, = i ) “Optimal” scores
3 (0.005,0.005,0.990) 0.06827 0.07237
3 (0.450,0.150,0.400) 0.72160 0.72 166
4 (0.005, 0.005, 0.005,0.985) 0.09033 0.09821
4 (0.400,0.100,0.400,0.100) 0.79423 0.80544
5 (0.010,0.005,0.005,0.010, 0.970) 0.14277 0.161 64
6 (0.0001,0.0001,0.0001, 0.0001, 0.0054,6 0.00633
SCALING THRESHOLD CHARACTERS 363
TABLE 2
Effect of equally spaced versus optimal scores on sire rankings for hypothetical exumples (m,=3)
No. of daughters in category Mean score Probability of
configuration‘ “Usual” scores “Optimal” scores
Sire 1 2 3
(a) E, = 0.4.5, TI, ,= 0.15, TI, = 0.40
A 1 2 1 0.04‘9 2.000 0.989
B 2 0 2 0.194 2.000 0.977
C 2 1 2 0.146 2.000 0.982
(b) II, = 0.005, TI, = 0.00.5, II, = 0.99
0.019 2.750 5.148 0.033 2.857 5.740 0.058 2.846 6.028
C 0 1 3
D 0 1 6
E 1 0 12
* Multinomial sampling assumed.
off spring pairs corresponding to a particular combination of scores. “Optimal” scores were found by solving a determinantal equation. The method was applied to 547 daughter-dam pairs and yielded a heritability estimate of 46%, as opposed to an estimate of 26% with equally spaced scores. Because there was no exact test of significance available to assess differences between scales, RAE (1950) sug- gested that the method should be entertained with larger data sets before in- ferences concerning the efficiency of the “optimal” scale could be drawn. A clear shortcoming of the method proposed by RAE is that the “optimal” scores are not monotonic. This is a result of the fact that the method does not take advantage of the ordering of the categories of response in any way. However, it merits fur- ther attention for the case of unordered response categories.
L I T E R A T U R E CITED
BERGER, P. J. and A. E. FREEMAN, 1978 Prediction of sire merit for calving difficulty. J. Dairy Science 61: 1146-1150.
COCHRAN, W. G., 1951 Improvement by means of selection. Proc. 2nd. Berkeley Symposium Math. Stat. and Prob., pp. 449-470.
DEXVIPSTER, E. R. and I. M. LERNER, 1950 Heritability of threshold characters. Genetics 35:
212-235.
FERNANDO, R. L., R. D. BILLINGSLEY, D. GIANOLA and G. E. RICKETTS, 1981 Heritability esti- mates and sire evaluations for frame score at weaning in Illinois Angus cattle. ASAS Abstracts, 73rd Annual Meeting, North Carolina State University, Raleigh.
-,
1980 A method of sire evaluation for dichotomies. J. Animal Science 51: 1266-1271. Selection index and expected genetic advance. pp. 141-163. In: Statisti- cal Genetics and Plant Breeding. Edited by W. D. HANSON and H. F. ROBINSON. Publication 982, National Academy of Sciences, National Research Council, Washington, D.C.
The heritability of resistance to death in the fowl, Poultry Science 27: 375-388.
Zntroduction to the Theory of Stutistics, 3rd
ed., McGraw-Hill Book Company, New York. GIANOLA, D., 1979
HENDERSON, C. R., 1963
Heritability of polychotomous characters. Genetics 3 : 1051-1055.
3 64 D. G I A N O L A A N D H. W. N O R T O N
RAE, A. L., 1950
ROBERTSON, A. and I. M. LERNER, 1949
SNEDECOR, G. W. and W. G. COCHRAN, 1967 WRIGHT, S., 1934
Genetic variation and covariation in productive characters of New Zealand
The heritability of all-or-none traits: viability of
Statistical Methods, Iowa State University Press,
An analysis of variability i n number of digits i n an inbred strain of guinea
Corresponding editor: J. F. KIDWELL Romney Marsh sheep. Ph.D. Thesis, Iowa State College, Ames.
poultry. Genetics 34: 3 9 5 4 1 1.
Ames.