University of South Carolina
Scholar Commons
Theses and Dissertations
2016
Assessing individual transit vulnerability to
nuisance flooding in the Charleston, SC area
Sumathee Selvaraj
University of South Carolina
Follow this and additional works at:https://scholarcommons.sc.edu/etd Part of theGeography Commons
This Open Access Thesis is brought to you by Scholar Commons. It has been accepted for inclusion in Theses and Dissertations by an authorized administrator of Scholar Commons. For more information, please [email protected].
Recommended Citation
Assessing individual transit vulnerability to nuisance flooding in the Charleston, SC
area
by
Sumathee Selvaraj
Bachelor of Science Emory University, 2013
Submitted in Partial Fulfillment of the Requirements
For the Degree of Master of Science in
Geography
College of Arts and Sciences
University of South Carolina
2016
Accepted by:
Kirstin Dow, Director of Thesis
Michael Hodgson, Reader
Dwayne Porter, Reader
Dedication
For my family – sometimes I get lost in a distant future thinking about climate
change and sea level rise, but whenever I think about all of you, I find my ground and
Acknowledgements
I cannot express the amount of gratitude I have for the people and organizations
who have supported me in pursuing research. To my graduate advisor and mentor, Dr.
Kirstin Dow—thank you for trying to help me understand the loaded terms of risk,
resilience, and vulnerability and guiding me (and pushing me when I was giving up) to
pursue a thesis topic addressing issues that have deep personal meaning to me. To Dr.
Dwayne Porter and Dr. Michael Hodgson, thank you for feedback and insight on
different aspects of my thesis. To Dr.Liz Fly, thank you for connecting me to the
wonderful community in Charleston and your guidance throughout this research. To
Vonie Gilreath from BCDCOG and Jeff Burns from CARTA, thank you for having
interest in working with me and providing me with guidance and insight about your
community that shaped this project. To the CISA team, thank you for providing me
feedback, moral support, and resources to conduct this research. To Alysha Baratta, Alex
Braud, Aashka Patel, Jory Fleming, Angela Seidler, and Henrik Westerkam – thank you
for helping me collect data in Charleston. To Mayra Roman, Alex McCombs, and Erika
Chin, thank you for opening your homes to me when I needed a place to stay. To all the
people who participated in my survey, thank you for taking the time to give me honest
answers and share your personal lives with me. Finally, to my family, friends, and
Abstract
Minor coastal flooding, also known as nuisance flooding, is projected to be more
frequent due to relative sea level rise. Nuisance flood events in Charleston have resulted
in various social impacts caused by road closures, traffic disruptions, and economic
losses. This thesis presents research conducted to understand the dimensions of individual
transit vulnerability to nuisance flooding and how transit vulnerability will be affected by
increased extents of nuisance flooding driven by rising sea levels and heavy rainfall.
Mixed methods were used to conduct this research in Berkley, Charleston, and
Dorchester Counties, South Carolina. An electronic, in-person survey was administered
at public bus stops to collect data on normal transit behavior, route information, transit
behavior during a nuisance flood event, and demographic characteristics. Changes in
transportation vulnerability under different scenarios of nuisance flooding was evaluated
by using a geographic information systems (GIS) model that calculated travel time for
respondent route information. The survey results revealed that three sources mediate
individual vulnerability: an individual’s travel behavior and personal attributes, the
vulnerability of the transit system, and the policies regarding late arrival and
cancellations at the trip destination. Additionally, individual transit vulnerability varied
depending on the type of transit disruption and transit network stressor. The GIS
modeling results showed that the location and extent of road flooding play an important
The findings from this research highlight that adaptation strategies in the transportation
sector to prepare for current and future levels of nuisance flooding will have to consider
characteristics of transportation network users and their destinations in addition to
vulnerability of the transportation network elements. Additionally, efforts to reduce
individual transit vulnerability to nuisance flooding must consider how factors outside of
the individual’s control, such as which roads flood, disruptions to transit service, and
destination absence or late policies, play an important role in determining the potential
Table of Contents
Dedication ... iii
Acknowledgements ... iv
Abstract ...v
List of Tables ... ix
List of Figures ...x
Chapter 1. Introduction ...1
1.1 Research context ...1
1.2 Purpose of research ...4
1.3 Structure of thesis ...5
Chapter 2. Literature review ...6
2.1 Drivers of coastal flooding ...6
2.2 Hazard risk and vulnerability ...10
2.3 Transportation vulnerability ...14
2.4 Transportation accessibility and mobility ...18
2.5 Conclusions from the literature and sub-research questions ...20
3.1 Research design ...23
3.2 Study area ...23
3.3 Public transit and flooding survey ...28
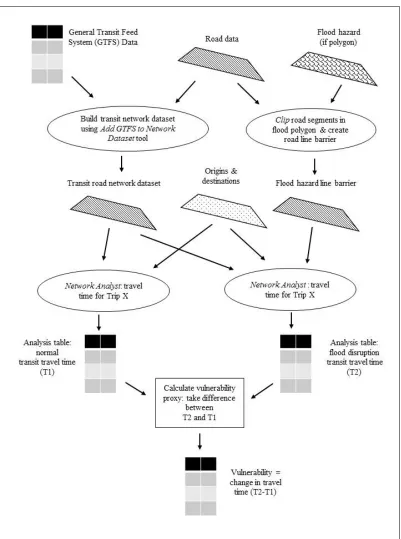
3.4 GIS model ...38
3.5 Data analysis of individual transit vulnerability using the proposed indicators ...48
Chapter 4. Findings ...49
4.1 Individual transit vulnerability as a function of adaptive capacity and sensitivity ..49
4.2 Individual transit vulnerability determined by GIS modeling ...69
4.3 Comparing individual vulnerability measured by the GIS model and survey responses ...76
Chapter 5. Conclusions ...80
References ...87
Appendix A: Supplemental figures ...92
Appendix B. Final Survey...95
Appendix C. Summary of pilot testing results ...96
List of Tables
Table 3.1 Survey questions covering adaptive capacity and sensitivity dimensions of
vulnerability ...30
Table 3.2 Sampling sites and survey response rate ...34
Table 3.3. CARTA ridership and study sample characteristics ... 35
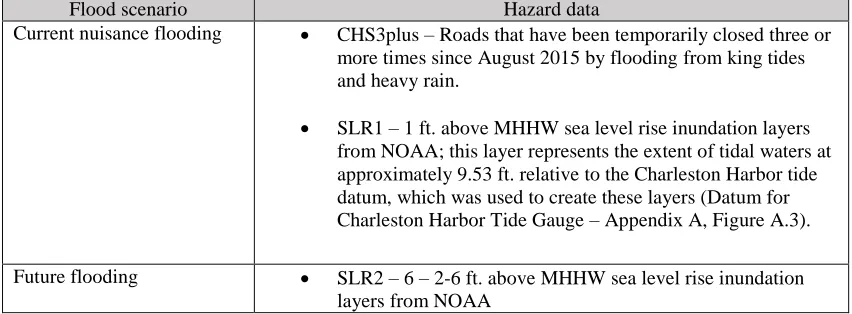
Table 3.4 Flood Hazard Data Layers ...43
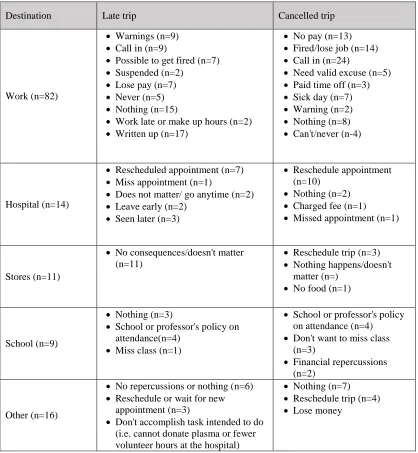
Table 4.1 Summary of impacts described by respondents based on trip destination* ... 53
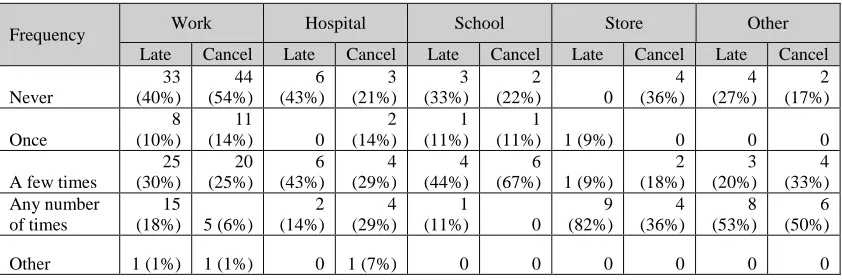
Table 4.2. Frequency that respondents could be late to or cancel the trip to their most common CARTA destination ...54
Table 4.3 Types of transit disruptions resulting from nuisance flood events ...59
Table. 4.4 Sources of sensitivity and adaptive capacity that influence individual vulnerability to transit disruptions ... 65
Table 4.5 Variation in trip travel time among model runs for different flood scenarios ..71
Table 4.6 Cause of trip cancellation ...72
Table 4.7 Number of flooded roads in study area ...72
List of Figures
Figure 2.1 General research methodology in vulnerability of transportation networks
from Wang et al. (2014, 4) ...16
Figure 3.1 BCDCOG Region with no (left) and 6ft of SLR above MHHW (right) ...25
Figure 3.2 Model data flow diagram for vulnerability indicator ...39
Figure 3.3 Location of Respondents Origins and Destinations ...44
Figure 3.4 Bus routes represented in model ...44
Figure 4.1 Transit Disruptions by Flood Scenario ...71
Chapter 1. Introduction
1.1 Research context
According to NOAA’s State of the Coast (2013), over a third of the United States
population lives in the 452 coastal shoreline counties. Although individuals living in
coastal communities, such as Charleston, South Carolina, benefit from the wide range of
opportunities that emerge from coastal and marine resources, they also must be prepared
to accommodate or avoid potential losses and damages that can be caused by coastal
hazards, such as hurricanes, flooding, and/or erosion (Moser et al. 2014; National
Research Council 2014; NOAA and US Census Bureau 2013). In many places along the
East and Gulf Coasts, the frequency of coastal flood events, particularly minor coastal
flood events also known as nuisance flooding, has been increasing due to changes in
mean sea level associated with relative sea level rise (Sweet et al. 2014). Factors
influencing relative sea level rise include climate change-induced rises in global sea
levels from glacial ice melt as well as geographically dependent features such as land
subsidence, bathymetry, and ocean currents. Nuisance flooding causes immediate impacts
to local communities, such as road closures and damages to property, and long-term,
chronic degradation of infrastructure from increasing inundation of saltwater (Sweet et al.
2014). Additionally, following an extreme event resulting in a local disaster, a
community might face challenges in recovery due to disruptions and minor damages
in how communities assess their coastal flood risk to consider repetitive, minor flood
events in addition to quick-onset, major flood events, as they try to build their resilience
to coastal hazards.
An analysis of tide exceedances above the minor coastal flood threshold measured
by the Charleston Harbor tide gauge part of the National Oceanic and Atmospheric
Administration (NOAA) National Water Level Observation Network (NWLON) from
1920 to 2013 indicates that nuisance flood days in Charleston, SC have been increasing
since the 1980s (Sweet et al. 2014). Nuisance flood events in Charleston occur primarily
during King Tide events, which are extreme high tides, and when localized precipitation
and wind speed and direction increases the extent of flooding (NOAA Digital Coast
2015). During the 2015 tide year, Charleston experienced a historic record of 38 nuisance
flood days (Sweet and Marra 2016). Social media and local news reports indicate that
nuisance flooding repetitively disrupts local transportation by flooding roads, causing
traffic, and altering normal public transit service (Peterson and Munday 2015; Peterson,
Rindge, and Boughton 2015; Peterson 2015a), which in turn impacts individuals trying to
accomplish essential daily activities, such as commuting to work or accessing medical
care. These events in Charleston exemplify how changing relative sea levels impact
transportation systems and their users by increasing salt water exposure, augmenting the
extent of flooding, and increasing the frequency of nuisance floods (National Research
Council 2008; Schwartz et al. 2014; Sweet and Marra 2016).
Adapting to the rising number of nuisance flood events and the resulting impacts
requires assessing where vulnerabilities exist and increasing the capacity of existing
perspective typically focuses on the characteristics of the entity that mediate its
predisposition to adverse impacts and amount of resulting harm from these impacts
(IPCC 2014). Conceptualizations of transportation vulnerability typically focus on the
adverse impacts caused by a disruption to attributes of the transportation system rather
than impacts to system users (Berdica 2002). Some vulnerability assessments of
transportation systems may focus on infrastructural capacity to withstand exposure to
flooding of different frequencies (National Research Council 2008; Rowan et al. 2014;
Lu, Peng, and Zhang 2014). Other assessments consider the transportation network and
its ability to remain functional either from the perspective of serviceability (Berdica
2002; Jenelius, Petersen, and Mattsson 2006) or accessibility (Suarez et al. 2005; Lu and
Peng 2011a; Kim, Pant, and Yamashita 2013). The latter vulnerability assessments
focusing on transportation network functionality provide a way to quantify how
transportation vulnerability affects populations in terms of costs, such as travel time and
distance.
However, many transportation network vulnerability assessments do not consider
the differential impacts to populations that occur from travel disruptions unless planners
have access and the ability to model individual travel patterns (Duthie, Cervenka, and
Waller 2013; Kim, Pant, and Yamashita 2013) and focus predominantly on motor vehicle
transportation rather than considering other modes, such as public transit. People depend
on transportation systems for key aspects of their livelihoods including job security,
childcare, and health services among many other activities (Jones and Lucas 2012), but
not all individuals receive the same benefits from transportation systems or have access
ability to utilize different components of the transportation system due to affordability or
location of services that stem from systemic barriers resulting from economic, historical,
and political factors (Böcker, Dijst, and Prillwitz 2013). Other individuals have reduced
accessibility due to personal characteristics, such as age or physical disability. These
individual and societal characteristics additionally influence the individual’s
transportation mode dependency, such as reliance on only on walking and/or public
transit.
1.2 Purpose of research
Anecdotal evidence suggests that nuisance flooding impacts more than just the
infrastructure and roads. Changes in road functionality not only disrupt regular public
transit routes, but also the ability of individuals dependent on those services to conduct
significant livelihood activities. Some transit users might have alternative options during
these instances while others might be dependent, which could result in
transit-dependent individuals facing additional consequences during nuisance flood disruptions.
The purpose of this thesis research is to understand relationship between nuisance flood
events, public transit and road network functionality, and public transit users. The
following research questions were proposed to guide the research:
1. How does individual transit vulnerability to nuisance-flood-induced transit
disruptions vary along individual characteristics and travel behavior?
2. How does the potential vulnerability of public transit users change under
1.3 Structure of thesis
This thesis begins with a literature review on coastal flooding, hazards and
transportation vulnerability, and transportation accessibility and mobility to summarize
approaches used to study different elements of focus in this research. The literature
review ends with key conclusions and sub-research questions used to answer the research
questions proposed in this study. The following methods section describes the study area,
research design, and data collection and analysis procedures. The discussion section
evaluates findings from three analyses conducted to understand the relationship between
nuisance flooding, public transit disruptions, and impacts experienced by public transit
riders in the study area. Finally, the conclusion chapter of this thesis identifies
contributions from this research to understanding factors that mediate individual
vulnerability in the context of nuisance flooding and transportation and what this means
as cities such as Charleston, SC plan for increases in nuisance flood days due to local sea
Chapter 2. Literature review
In order to address the research questions asked in this thesis, the literature review
covers four bodies of literature to conceptualize key terms and evaluate methods. First,
the drivers of coastal flooding are discussed to better understand why nuisance flooding
has been increasing in coastal communities. The next three sections summarize
approaches used to understand how coastal hazards and transportation systems affect
individuals. A summary of the hazards literature highlights variations in risk and
vulnerability assessments and the different dimensions and factors that influence
individual vulnerability, such as adaptive capacity and sensitivity. A separate section
covers how the transportation sector has conceptualized and measured the vulnerability
of transportation systems to different disruptions, with an emphasis on climate and
weather hazards. The final section of the literature review highlights findings from
transportation accessibility and equity research in order to conceptualize the relationship
between individuals and transportation systems. The chapter ends with a summary of the
key points from each of the sections, refined research questions, and definitions of key
terms that are used throughout the rest of this thesis.
2.1 Drivers of coastal flooding
Coastal flooding refers to inundation from the ocean caused by the movement of
water on land as a result of high tides, wind patterns, erosion, and storm surge (NOAA
minor, moderate, and major coastal flooding based on tidal datum elevations determined
using mean sea level measurements taken by the National Oceanic and Atmospheric
Administration’s (NOAA) tide gauges part of the National Water Level Observation
Network (NWLON) (Sweet et al. 2014). These inundation thresholds inform fixed
elevations for coastal infrastructure design and when to issue public safety advisories in
the event of potential flooding. For example, when tide levels reach above 7 ft. at the
Charleston, SC tide gauge, which is referenced to local datum mean lower low water
(MLLW), the National Weather Service issues a public safety advisory for minor coastal
flooding (National Weather Service Charleston Weather Forecast Office 2015).
Physical drivers, such as geomorphological, hydrological, and climatological
factors, influence the extent and likelihood of coastal flooding in an area (NOAA 2015).
Geomorphological features of an area include elevation above sea level and shoreline
processes and features can change the ability of the ocean to penetrate further inland and
mitigate incoming water (National Research Council 2014; NOAA 2015). Meteorological
and climate drivers influencing ocean temperature and currents and the formation of
tropical systems, such as hurricanes, severe storms, and nor’easters, can cause storm
surge and wind driven tides that add additional water on top of the existing tide and
pushes water further inland than the normal tide at the time (NOAA 2015; National
Research Council 2014). Localized precipitation influences the extent of coastal flooding
by increasing runoff, placing additional pressures on stormwater systems that also might
be inundated with tidewaters. Climate change also exacerbates drivers of coastal flooding
global mean sea levels due to melting of glacial ice from increasing temperatures and
thermal expansion of ocean waters (Moser et al. 2014).
Relative sea level rise, which is determined by global sea level rise and local
factors including land subsidence, shoreline processes, and bathymetry worsens existing
coastal flood patterns in many parts of the U.S. coast (National Research Council 2014;
Wong et al. 2014; Parris et al. 2012; Sweet et al. 2014). According to Sweet et al. (2014),
when local sea levels rise and change the mean sea level relative to fixed tidal datum
elevations, there is a greater chance that the inundation levels will exceed the existing
flood thresholds. Consequentially, relative sea level rise can worsen all flood types,
resulting in spatial and temporal changes in flooding due to the potential increase in
magnitude and frequency of coastal flood events, particularly minor flood events (Sweet
et al. 2014). While Sweet et al. (2014) acknowledge that sea level rise will exacerbate
extreme flood events by increasing the level of storm surge, their analysis of tide gauge
records focuses on the increasing numbers of minor flood events observed across the
country consistently over the past couple decades. They define the increase in floods
above “the NWS ‘minor’ thresholds as a location’s nuisance flood level” (Sweet et al.
2014, 2), and many of these minor flood events are now known as “King Tides” which
typically occur during astronomical high tides. After analyzing NWLON tide gauge water
level exceedance data from records going back to at least 1920, Sweet et al. (2014)
conclude that nuisance flood events have been increasing across the U.S. but at different
rates. For example, tide gauge records along the U.S. and Gulf Coasts show accelerating
increases in nuisance floods compared to those of gauges other regions. Although Sweet
levels, other drivers of coastal flooding can also exacerbate these minor floods, such as
localized precipitation and seasonal climate variability influencing wind patterns and
ocean forcing. For example, Sweet and Marra (2016) conclude that a strong El Niño
Southern Oscillation during the 2015 tide year from May 2015 to April 2016 contributed
to increased tidal flooding in the mid-Atlantic and California coasts.
While not a comprehensive discussion of all factors contributing to and types of
coastal flooding, this overview highlights the variable nature of coastal flooding both
spatially and temporally due to concurrently occurring physical and social processes that
interact at various scales to create local coastal flooding conditions. Of the factors
discussed above, storm surge and coastal erosion have and will continue to play a central
role in the discussion around coastal flooding, especially since storm surge flooding has
caused devastating damages throughout coastal areas in the United States (NOAA 2015).
However, the increasing frequency of nuisance flooding caused by sea level rise also
deserves attention due to the range of impacts that can result from repetitive nuisance
flooding, including slow-onset impacts (e.g., infrastructure corrosion) and immediate
impacts (e.g., business closures) (Sweet et al. 2014). Exceedances in the minor flood
thresholds will have different impacts in communities depending on both the amount of
water exceedance during nuisance flood events and how local infrastructure has been
designed relative to fixed tidal datum, which not only determine current flood thresholds
but also often inform building guidelines. Thus, communities will be better prepared for
coastal flooding if they consider both the impacts of repetitive nuisance flooding and
2.2 Hazard risk and vulnerability
Impacts to society caused by hazards, such as nuisance floods, do not affect all
entities equally due to variations in exposure, hazard likelihood, and vulnerability (IPCC
2014). Risk and/or vulnerability assessments provide a way to better understand the
variations in impacts and identify options to allocate finite resources strategically to
minimize consequences caused by the hazard (Füssel 2007). The conceptualization of
risk and vulnerability differs depending on the discipline and sector of focus (Birkmann
2012; Adger 2006), which in turn results in numerous methods to assess risk and
vulnerability varying along factors such as scale (e.g. temporal or spatial), entity (e.g.
individual vs. household), and dimension (e.g. human, ecological, coupled
socio-ecological) of interest. This first section provides an overview of the conceptualization of
risk and vulnerability from the perspectives of the natural hazards and global
environmental change literature followed by a section on transportation vulnerability.
Although a plethora of definitions and assessment methodologies exist in the
hazard risk reduction and global environmental change literature, the majority of risk
definitions identify two common components: 1) the likelihood of a hazard event or
climate stressor occurring and 2) the potential adverse effects or consequences that may
result (Pine 2014; IPCC 2012; National Research Council 2014; IPCC 2014). The first
component of risk, the likelihood of a hazard event or climate stressor occurring, is often
measured by looking at the probability of the hazard event occurring. For coastal
flooding, future probabilities of flood events are determined by using historical tide
gauge measurements and past occurrences of flooding (National Research Council 2014;
floodplain maps. The likelihood of future sea level rise has been depicted by projections
adjusted to consider the impact of local conditions, such as land subsidence (Parris et al.
2012). However, calculating future probabilities becomes challenging since there is still
much uncertainty regarding the expected magnitude and frequency of major and minor
coastal flood events, which could vary dramatically depending on future rates of sea level
rise and dynamic meteorological factors.
Rather than calculate the risk associated with impacts for a particular hazard event
with uncertain probabilistic outcomes, Parris et al. (2012) recommend the use of
scenarios to assist with planning for multiple futures with different amounts of sea level
rise. The use of scenarios can be coupled with an assessment of potential consequences
that may occur, which is typically considered a function of the entity’s vulnerability and
exposure to the hazard. The Intergovernmental Panel on Climate Change (2014) defines
vulnerability as “the propensity or predisposition to be adversely affected” (5) and
identifies key components to be “sensitivity or susceptibility to harm and lack of capacity
to cope and adapt” (5). Sensitivity is a measure how much the system of focus is
impacted by the hazard while adaptive capacity is the ability to cope and mediate the
number of changes that might occur during the hazard (Adger 2006; Birkmann 2012).
A vulnerability assessment differs from risk assessments in that it does not
consider the probability of specific consequences, but instead focuses the hazard
consequences a particular entity faces as a function of its sensitivity and adaptive
capacity. Factors mediating sensitivity and adaptive capacity often are not
hazard-dependent but rather existing characteristics of the entity (Adger 2006; Birkmann 2012).
include income, education level, race and ethnicity, gender, and age. For example, a
family with limited financial resources might be more sensitive to damages caused by a
flood because they might not be able to afford flood insurance.
Beyond these core components of exposure, adaptive capacity, and sensitivity,
Birkmann (2012) highlights that vulnerability also varies along spatial and temporal
scales and dimensions, such as geographic, economic, social and biophysical. Assessing
vulnerability along geographic dimensions focuses on characteristics embedded in
geographic context, such as proximity to public transit stations or place of residence, that
influence the entity’s ability to cope with or sensitivity to different hazard impacts.
Evaluating economic dimensions result in a focus on access to financial capital, income
level, job stability, and other similar factors. At larger scales beyond the household or
individual, evaluating economic dimensions help understand impacts to the economy by
considering the number of jobs available after a disaster or changes in regional
production and consumption. Social dimensions of vulnerability captures how personal
characteristics, such as culture, demographics, access to information, and social
networks, predispose individuals to adverse impacts (Susan L. Cutter, Boruff, and Shirley
2003). Additionally, economic and geographic factors, including income, occupation, and
place of residence, influence social vulnerability. Biophysical dimensions of vulnerability
emphasize how adverse impacts may result as a consequence of certain biological,
ecological, or geological characteristics of the entity that influence exposure to the
hazard. Evaluating how the entity functions normally because of factors in these different
dimensions helps identify preconditions of vulnerability that exist independent of the
evaluating how an entity with specific characteristics functions when exposed to a
hazard. Factors making an entity vulnerable to a particular hazard are those that that
increase the entity’s sensitivity to the hazard and limit its ability to cope with any hazard
impacts.
Vulnerability assessments and indicators help identify sources of vulnerability
that stem from different dimensions, such as using a social vulnerability assessment to
identify which population has a greater predisposition to be impacted by a specific
hazard. These indicators and assessments can also be constructed to compare how
vulnerability changes across temporal and spatial scales. For example, social
vulnerability assessments and indicators can be developed for use at various geographic
and population scales such as county or census unit (Susan L. Cutter, Boruff, and Shirley
2003), household, or individual. Sensitivity analyses of the Social Vulnerability Indicator
(SOVI), which combines demographic and economic attributes of populations measured
by the census to measure vulnerability, shows that vulnerability measured by SOVI
changes across temporal and spatial scales (S. L. Cutter and Morath 2012). The variations
in vulnerability that emerge across different scales and dimensions, or differential
vulnerability, highlights that impacts caused by a hazard do not affect all entities equally.
Differential vulnerability also highlights how certain groups may be disproportionately
predisposed to more hazard impacts compared to others.
A limitation of many assessments arises from data availability on characteristics
that make an entity vulnerable. Assessments like SOVI rely on readily available data for
empirical analyses that can be compared across geographies and different time periods
various geographic units, this indicator does not provide information on how these
attributes relate to sensitivity and adaptive capacity of populations to a specific hazard.
To understand the dynamics between population characteristics and these other
components of vulnerability, research at the individual scale would provide more detail
but would require independent data collection since readily available data sets might not
provide this information.
Hazards vulnerability assessments provide a framework to understand different
components and dimensions that influence the vulnerability of an entity. By focusing on a
particular dimension of vulnerability, researchers can better identify how social,
economic, and geographic characteristics mediate and influence adaptive capacity and
sensitivity, and ultimately the entity’s vulnerability. However, in addition to focusing on
a particular dimension, De León (2012) calls for a sectoral approach to vulnerability
assessments that has policy applications beyond hazards mitigation and general planning.
Based on De León’s model, vulnerability differs based on the hazard, dimension, and
sector of interest. Thus, the next section looks to the literature from the transportation
sector to identify how they have characterized the transportation system vulnerability to
hazards.
2.3 Transportation vulnerability
Vulnerability of transportation system functionality and performance has been
conceptualized and measured in a variety of ways. Faturechi and Miller-Hooks (2014)
review literature on transportation infrastructure performance and identify that the
concepts risk, vulnerability, reliability, robustness, flexibility, survivability, and resilience
definitions of vulnerability consider the adverse impacts to the transportation system that
result from an incident (Faturechi and Miller-Hooks 2014; Berdica 2002). Some authors
explicitly differentiate vulnerability from risk in that vulnerability does not consider the
likelihood of the incident (Berdica 2002) while others consider probability of incident
and consequences as part of vulnerability (Jenelius, Petersen, and Mattsson 2006; Lu and
Peng 2011b; Wang et al. 2014). Operationalization of vulnerability also varies depending
on the transportation mode being assessed (Wang et al. 2014). The remainder of this
section focuses on road network vulnerability since this is the primary transportation
network used by the public in Charleston.
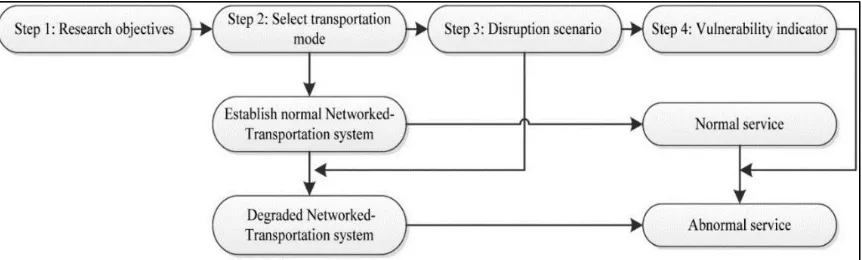
Typically, vulnerability of transportation networks has been assessed using spatial
and quantitative models. Upon reviewing transportation literature on modeling
vulnerability using network analysis, Wang et al. (2014) identify four common stages of
vulnerability assessment research methodology employed by researchers (Figure 2.1).
Vulnerability is quantified by assessing changes to network performance before and after
a disruption scenario using a predefined vulnerability indicator. In vulnerability
assessments of transportation to coastal flooding and/or sea level rise, variations among
assessments emerge because of the type of coastal flood disruption scenarios and
vulnerability indicator used to measure system performance during a flood event.
Researchers use flood disruption scenarios based on different storm and flood intervals
(e.g., 10-, 50-, 100-, and 500-year events) and/or sea level rise rates (Lu and Peng 2011b;
Suarez et al. 2005; Kim, Pant, and Yamashita 2013; Lu, Peng, and Zhang 2014; Oswald
and Treat 2013; Rowan et al. 2014) that have been created from hydrologic inundation
various scenarios to assess the sensitivity of the road network under different amounts of
coastal flooding and how vulnerability changes (Suarez et al. 2005).
Figure 2.1. General research methodology in vulnerability of transportation networks from Wang et al. (2014, 4)
Vulnerability indicators vary depending on how researchers conceptualize and
operationalize vulnerability. Berdica (2002) proposes that vulnerability in the road
network should consider serviceability and mobility of the network, which shifts from
other conceptualizations of vulnerability focusing on safety and infrastructure stability.
Berdica defines serviceability of a road network as “the possibility to use that [road]
network during a given time period” (118). She notes mobility considers both “the
performance/effectiveness of the transport system in connecting spatially separated
locations, and individual characteristics influencing the extent to which people are able to
make use of the transport system” (Berdica 2002, 118). Berdica considers accessibility,
another term commonly used to consider changes in road network vulnerability, as part of
mobility. Serviceability, mobility, and accessibility are common measures of road
network performance, but what distinguishes these system performance measures from
changes in road network performance caused by a disturbance in the system. Thus,
Berdica’s proposed vulnerability framework defines vulnerability as “susceptibility to
incidents that can result in considerable reductions in road network serviceability” (2002,
119).
Later research builds off of Berdica’s conceptualization of vulnerability to also
explicitly define consequences as a function of exposure to an incident as a component of
vulnerability (Jenelius, Petersen, and Mattsson 2006). Others look at changes in
accessibility and mobility as a function of travel time or vehicle miles traveled (Suarez et
al. 2005; Kim, Pant, and Yamashita 2013) or by developing an accessibility index that
incorporates weights for origin and destination attractiveness (Lu and Peng 2011b; Lu,
Peng, and Zhang 2014). Some researchers developed vulnerability indicators using a
hazards framework. For example, Rowan et al. (2014) developed a composite
vulnerability indicator based on subcategories of sensitivity, adaptive capacity, and
exposure and Kim et al. (2013) used the Threats Hazard Identification and Risk
Assessment (THIRA) by the U.S. Department of Homeland Security in order to develop
a transportation risk score.
Literature on transportation vulnerability highlights that most conceptualizations
and assessments define vulnerability by looking at changes in transportation network
functionality measured using proxies for travel cost, such as travel time and distance.
These models provide useful insights on how to measure possible consequences to the
transportation network caused by a hazard, but they do not provide a detailed
understanding of the sensitivities of transportation users to a disturbance in the road
like individual socioeconomic or travel behavior characteristics (Böcker, Dijst, and
Prillwitz 2013). Many models of transportation vulnerability focus on changes in
vulnerability from the perspective of the network rather than the user and assume that
individuals who use the disrupted transportation network experience similar impacts and
have identical, unlimited capacities to afford the alternative least cost travel route.
However, in reality, individuals will have different experiences depending on their
transportation mode, with travel times often being longer and less flexible for public
transit users than car riders. Similarly, if individuals have access to fewer financial
resources or are transit dependent on a one transportation mode, they might face greater
impacts during transportation system disruptions than someone else with greater
flexibility in choosing their transportation mode.
2.4 Transportation accessibility and mobility
Impacts to the transportation system do not necessarily translate into burdens for
all users. Depending on individual socioeconomic and geographic attributes, such as
ability to afford a car or bus routes near residence, individuals might be impacted
differently during a transportation disruption. Thus, measuring road network vulnerability
as a function of accessibility and travel behavior provides an opportunity to better
understand how transportation disruptions impact individuals dependent on the road
network by focusing on travel characteristics dependent on individual traits and
preferences (Böcker, Prillwitz, and Dijst 2013; Lu et al. 2014). Transportation
accessibility captures the availability of transportation options and ability of riders to
utilize these options to reach their desired destination while travel behavior looks at
Although Berdica (2002) notes that traditional accessibility and system performance
evaluation measures do not account for impacts of an incident on the system, research on
broader transportation accessibility provides insights on general performance of the
transportation network to meet user needs. In turn, an accessibility framework provides a
way to understand how users (demand-side) are impacted by road network vulnerability
to coastal flooding. Additionally, focusing on behavioral aspects provides a bridge to
better understand how demand can adapt or fluctuate in response to road network
disturbances.
Findings from past studies indicate that transportation accessibility, mobility, and
travel behavior choices vary by demographic and socioeconomic characteristics (Hanson
2010; Alsnih and Hensher 2003), changes in weather (Böcker, Dijst, and Prillwitz 2013),
and extreme events (Lu et al. 2014; Kim, Pant, and Yamashita 2013). Accessibility may
vary by transportation mode (e.g. public transportation vs. car use), and changes in
accessibility results in impacts to individual livelihoods, such as their journey to work
and employment opportunities (Sanchez 1999; Hanson 2010; Niedzielski and Boschmann
2014). Weather and extreme events alter travel behavior depending on the meteorological
or hazard event and the trip purpose, with more leisure trips being cancelled than work or
other utilitarian trips (Böcker, Prillwitz, and Dijst 2013). However, many of these studies
depend on detailed data on transportation behavior through time-intensive data collection
methods, such as travel diaries, that may not be feasible to collect data for large study
2.5 Conclusions from the literature and sub-research questions
In order to better understand impacts caused by coastal flooding in a community,
coastal flood risk and vulnerability assessments should consider the impacts caused by
increasing frequencies of nuisance flooding. Vulnerability assessments provide a way to
understand how nuisance flooding affects the entity of interest. Conceptualizations of
vulnerability from the hazards literature provides a way to evaluate which dimensions
influence individual hazard vulnerability and how individual sensitivity to disruptions or
adaptive capacity shape individual vulnerability. Selecting appropriate measures of
vulnerability, however, also depend on the sector of interest. For this research,
appropriate indicators of adverse impacts experienced by an individual during a public
transit disruption requires understanding how the transportation sector determines
vulnerability and measures social impact. Many methods of assessing transportation
vulnerability to flooding focus on network performance measures that do not characterize
how system performance may affect individuals. Thus, the research on transportation
accessibility and travel behavior provides information on how changes in the
transportation network affect individuals.
Based on the conclusions from the reviewed literature, additional questions were
proposed to answer help the research questions identified in Section 1.2:
How does individual adaptive capacity and sensitivity to transit disruptions
vary among public transit riders?
How does transit vulnerability assessments vary under different coastal
How does information from a hazard vulnerability assessment compare to
results from a transportation vulnerability assessment of the same system of
interest?
To emphasize the focus of this research on individual vulnerability to transit disruptions,
the rest of this research refers to the following terms using the definitions below that have
been selected based on the literature review and study area context:
Transit disruption – an alteration in normal public transit service caused by a
stressor in the system that has the potential to change transit riders’ intended trips.
Travel behavior – individual choices and characteristics, including transportation
mode choice and accessibility to transit service, that influence how a person gets
from one point to another
Nuisance flooding - minor flooding that inundates roads partially or completely
and is caused by high tides above the minor flood threshold, heavy rainfall events,
or a combination of both (adapted from Sweet et al. 2014).
Vulnerability – the potential for an individual to experience consequences from
public transit disruptions (adapted from IPCC 2014)
Sensitivity - severity of consequences that result from transit disruption
Adaptive capacity – characteristics that allow an individual to cope with
This research focused on two types of transit disruptions: 1) trip delay (late to
destination) and 2) trip cancellation. Transit disruptions were assessed in the context of
two stressors—those caused by nuisance flooding and those that have the potential to
occur on a regular basis, regardless of weather conditions (i.e., traffic, bus problems,
railroad). Vulnerability was measured using adaptive capacity and sensitivity defined by
travel behavior as well as using changes in travel time resulting from a transit disruption.
Operationalization of these terms to address the research sub-questions is discussed in
Chapter 3. Methodology
3.1 Research design
Mixed methods were used to conduct this research in the Greater Charleston
Metro study area including Berkley, Charleston, and Dorchester Counties, South
Carolina. Transit behavior characteristics were used to measure individual vulnerability
to normal and nuisance flood-induced transit disruptions. An electronic survey
administered in person at public bus stops was used to collect data on normal travel
behavior, route information, travel behavior during a nuisance flood event, and
demographic information. Variation of transportation vulnerability under different
scenarios of coastal flooding was evaluated by using a geographic information systems
(GIS) model that calculates transit travel time from respondent route using different
flooding scenarios. The following sections discuss the rationale for the study area, the
development of these methods, and data analysis procedures.
3.2 Study area
The study area was the Greater Charleston Metropolitan Area, which consists of
Charleston County and parts of Berkley and Dorchester Counties (Figure 3.1). Although
sampling only occurred at bus stops in Charleston County, this study area was selected to
include individuals who live in the entire region for the following reasons: 1) the
commute to and from the urban core; 2) regional public transit system and transportation
planning include requirements to address impacts to vulnerable populations; and, 3)
current and future levels of nuisance flooding disrupt roads and normal public transit
service for riders who live outside of the flooded areas.
The Berkley-Charleston-Dorchester Council of Governments (BCDCOG) is the
South Carolina regional planning organization for municipalities in Berkley, Charleston,
and Dorchester Counties and also serves as the regional Metropolitan Planning
Organization (MPO) in charge of regional transportation planning and distribution of
state and federal funds for projects (BCDCOG 2012). To be eligible for Federal
transportation funding, the BCDCOG must address how they will assess transportation
equity and environmental justice impacts of transportation projects (BCDCOG 2015).
Thus, transportation planners and managers with BCDCOG have an interest in vulnerable
populations in the region, their transportation use, and their vulnerability to different
transportation disruptions, such as those caused by nuisance flooding.
The Charleston Area Transportation Study (CHATS), which encompasses all
long-range and short-term improvement projects and planning for the region, addresses
all modes of transportation vital to regional economic and community growth including
public transportation. Two public transit systems serve the BCD region: the Charleston
Area Regional Transportation Authority (CARTA) (Appendix A, Figure A.1) and the
TriCounty Link (Appendix A, Figure A.2). This research focused on CARTA routes,
which run through Charleston County and are most likely to be affected by sea level rise
and nuisance flooding since they run through areas in the tri-county region most exposed
Figure 3.1 BCDCOG Region with no (left) and 6ft of SLR above MHHW (right). Colored lines represent CARTA Routes while dashed grey lines represent TriCounty Link.
As of April 2016, the CARTA transit system consisted of 16 fixed routes, 4
express commuter routes, and 3 downtown area shuttles servicing 1,371 bus stops in
urban and suburban areas (CARTA 2015; BCDCOG and CARTA 2016). CARTA’s
routes include fixed, Tel-A-Ride with park and ride centers, flex/demand service, and
express routes. In 2016, CARTA conducted a Comprehensive Operational Analysis
(COA) to evaluate system strengths and weaknesses to determine short-, mid-, and
long-range transit service goals and modifications that will improve CARTA service. They
started implementing short-range plan recommendations to service routes in May 2016,
which has resulted in new service routes and changes to existing bus routes.
In 2014, CARTA provided 5 million rides with weekday ridership averages of
15,694 riders (CARTA 2015). According to CARTA’s Comprehensive Operational
and the majority (75%) of riders do not have access to a car for their trip. CARTA’s
ridership characteristics reveal that CARTA serves majority low-income (58% with
annual income below $30,000) and minority (65% Black/African American) individuals.
CARTA does serve non-transit dependent populations, such individuals who have access
to a vehicle but use CARTA’s Park and Ride locations and ride CARTA for convenience
rather than necessity in order to avoid traffic and parking constraints in downtown
Charleston. Many large employers, including College of Charleston and Medical
University of South Carolina, also have partnerships with CARTA to encourage their
employees to use these CARTA express routes. The diverse populations served by
CARTA provides a unique opportunity to assess differential vulnerability among transit
and non-transit dependent users who represent a range of socioeconomic backgrounds.
Currently, nuisance flooding in Charleston results in rerouting of public transit
service provided by CARTA (Burns and Gilreath 2015). The National Weather Service in
Charleston, SC issues a minor coastal flood warning when the tide level at the Charleston
Harbor tide gauge reaches 7ft above MLLW. Sweet and Marra (2014) use the minor
coastal flood threshold to define “nuisance flooding” in coastal areas. Minor coastal flood
events typically occur during the astronomical high tides, also known as “King Tides.”
During these events in the past, many roads in Charleston County, primarily in the City
of Charleston, have closed due to inundation from tidewaters (Peterson and Munday
2015). Although the timing of King Tides that cause nuisance flooding can vary, King
Tides coinciding with morning or evening commutes can significantly impact individuals
living throughout the tri-county area who travel to destinations that might be flooded.
impacted if any roads along the route they take from their origin to a destination has been
flooded.
Sweet and Marra (2015) forecasted 26 days of nuisance flooding in Charleston,
SC during the 2014 and the 2015 federal flood year, which runs from May 1 to April 30
of the following year. The forecast was exceeded in both years with a total of 33 days of
nuisance flooding recorded in 2014 and a historic record of 38 nuisance flood days in
2015 (Sweet and Marra 2016). In some instances, these floods were exacerbated by
heavy precipitation events, such as the October 2015 historic rainfall event in South
Carolina that resulted in a shutdown of all CARTA operations over the weekend (Burns
and Gilreath 2015). However, nuisance flooding has also occurred on days without
precipitation, and have been called “blue-sky flooding” according to William Sweet, a
NOAA Oceanographer in an interview with the Post and Courier (Peterson 2015b).
Factors contributing to nuisance flooding in Charleston, SC include relative sea
rise as well as wind and precipitation patterns influenced by El Niño Southern Oscillation
(Peterson 2015b; Sweet and Marra 2015; Sweet and Marra 2016). Mean sea level rise at
the Charleston Harbor gauge has been increasing at a rate of 3.16 mm/year based on
monthly sea level records dating back to 1921 (NOAA Center for Operational
Oceanographic Products and Services 2013), and researchers project sea level rise to
range from 0.6 to 1.8ft by 2050 in South Carolina (Strauss et al. 2014). Although
estimates show a wide range due to uncertainty in global sea level rise rates, recent
statements by public officials, such as former Mayor Joe Riley, and the establishment of
groups like the Charleston Resilience Network indicate a local commitment to build
regardless of the amount of sea level rise that occurs (Riley 2015). In 2015, the City of
Charleston released its Sea Level Rise Strategy, further establishing a commitment to
addressing sea level rise impacts.
3.3 Public transit and flooding survey
The survey instrument was designed and used to collect information about
different dimensions of individual public transit user vulnerability: the type of impacts
experienced by the transit user during transit disruptions, the sensitivity of the respondent
to these disruptions, and whether the respondent had the ability to adapt or take
alternative actions to prevent or reduce the impact from these disruptions.
3.3.1 Survey design and development
The survey instrument consisted of three sections with multiple-choice and short
answer questions (Appendix B). The first part of the survey collected information on each
respondent’s normal public transit use, including regularly used routes and stops, and
established a baseline for individual sensitivity and adaptive capacity to two types of
transit disruptions – late trips and cancelled trips under non-nuisance flood conditions.
The second portion of the survey contained questions about the types of consequences
and transit disruptions the respondent experienced during a nuisance flood event. The
questions in this section were designed to collect information on CARTA service changes
when nuisance flooding occurred and how this impacted the individual’s sensitivity (i.e.
late, cancelled trip) and adaptations in response. The third section of the survey collected
information on individual and household socioeconomic and demographic characters,
Survey vulnerability indicator
Individual vulnerability was measured via the survey by assessing the individual’s
sensitivity to transit disruptions and adaptive capacity to handle any resulting
consequences. Sensitivity is defined as the severity of the consequences and was
measured by collecting data about the types of consequences the individual has or could
experience during late and cancelled bus trips. Adaptive capacity is defined as any factor
that enables the rider to cope with resulting impacts from the transit disruption or still
complete the trip as originally intended. Adaptive capacity was measured in the survey by
collecting information about how the respondent coped with or prepared for any
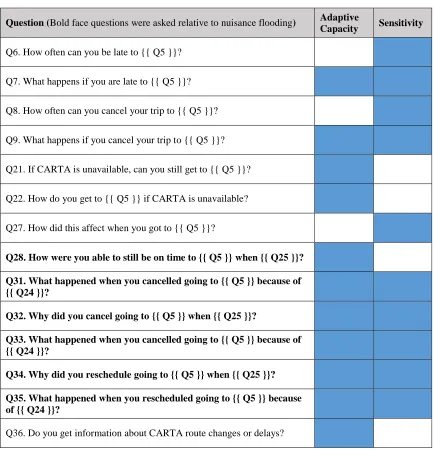
experienced or future consequences. Table 3.1 shows the questions in the survey
(Appendix B) that were used to measure adaptive capacity and sensitivity. The survey
asked about consequences to transit disruptions resulting from general stressors and those
that occur due to nuisance flooding (bolded questions in Table 3.1). This vulnerability
indicator assumed the best possible situation is when the respondent’s trip still occurred
as planned – no change in trip route or the individual was still on time to his or her
desired destination. Thus, types of consequences focused on what happened during two
general outcomes of a transit disruption—late trip or cancelled trip—and in the case of
nuisance flood-induced transit disruptions, two other outcomes were added as
possibilities—rescheduled trip and unchanged trip. The latter two outcomes provided
additional measures of adaptive capacity by providing information about how the
individual still achieved his or her original trip despite experiencing a transit disruption
Table 3.1 Survey questions covering adaptive capacity and sensitivity dimensions of vulnerability
3.3.2 Survey pilot testing
The survey format and questions were developed and selected in conjunction with
local stakeholders and were pre-tested in February 2016 (Appendix C). The purpose of
pre-testing was to evaluate whether the survey questions elicited appropriate responses
from individuals to answer the research question, how respondents reacted to the survey
Question (Bold face questions were asked relative to nuisance flooding) Adaptive
Capacity Sensitivity
Q6. How often can you be late to {{ Q5 }}?
Q7. What happens if you are late to {{ Q5 }}?
Q8. How often can you cancel your trip to {{ Q5 }}?
Q9. What happens if you cancel your trip to {{ Q5 }}?
Q21. If CARTA is unavailable, can you still get to {{ Q5 }}?
Q22. How do you get to {{ Q5 }} if CARTA is unavailable?
Q27. How did this affect when you got to {{ Q5 }}?
Q28. How were you able to still be on time to {{ Q5 }} when {{ Q25 }}?
Q31. What happened when you cancelled going to {{ Q5 }} because of
{{ Q24 }}?
Q32. Why did you cancel going to {{ Q5 }} when {{ Q25 }}?
Q33. What happened when you cancelled going to {{ Q5 }} because of
{{ Q24 }}?
Q34. Why did you reschedule going to {{ Q5 }} when {{ Q25 }}?
Q35. What happened when you rescheduled going to {{ Q5 }} because
of {{ Q24 }}?
questions, which questions needed clarification, questionnaire logic, and the time the
survey took to complete (Barribeau et al. 2012). Feedback from local stakeholders
provided information about context and study population, which informed how to phrase
questions and discuss sensitive topics. The first draft of survey questions was developed
after meeting with the BCDCOG mobility manager and CARTA operations director in
December 2015 to discuss how public transit operates during nuisance flooding and
options available to transit users during a transit disruption (Burns and Gilreath 2015).
The first draft of survey questions was then pre-tested with graduate students at
University of South Carolina to assess clarity and flow of questions. The second round of
pre-testing occurred with the BCDCOG mobility manager and CARTA operations
director to provide input and suggestions on feasibility of administering the survey. The
final round of pre-testing was conducted with a sample of the targeted study population
and administered in-person at two CARTA transfer stops. Pre-testing the survey at the
bus stops revealed bus riders associated the terminology “flooding” with extreme events,
such as the severe flooding that occurred in October 2015 when CARTA suspended
service completely. Thus, the wording in the survey was changed to ask respondents
whether they experienced CARTA service changes during heavy rainfall or high tide
events rather than saying minor flooding or nuisance flooding.
The final version of the survey and sampling protocol was submitted to the
University of South Carolina Institutional Review Board (IRB) for review and approved
3.3.3 Survey administration and sampling logistics
The survey was administered in-person by trained interviewers using
SurveyMonkey kiosk mode on an iPad mini. In-person survey administration was chosen
to reduce barriers in participation due to low literacy or limited access to technology to
take a mobile or web-version of the survey. Other advantages of having an interviewer
administer the survey included the ability to get more short-answer responses, ask more
detailed questions, and a higher response rate to questions (Barribeau et al. 2012). An
electronic survey was chosen so that responses could be recorded directly into a database
and to incorporate answer piping and question skip logic, which allowed for automatic
skips of irrelevant questions based on the respondent’s previous answer. All interviewers
received IRB certification and completed survey training designed by the researcher prior
to beginning data collection. During survey training, interviewers practiced
administration of the survey, reviewed a standard protocol for probing open-ended
questions, and were prepared on how to respond to different encounters that might occur
at the study area (Appendix D).
Sampling occurred at four CARTA transit stops with larger volumes of riders in
order to sample from a larger population of CARTA riders and to ensure that a wide
range of transit users who take different routes were represented in the sample. In order to
increase the chances of speaking with CARTA riders who have experienced transit
disruptions caused by nuisance flooding, two of the sampling sites were also selected
because of their location in downtown Charleston near streets that regularly experience
nuisance flooding. The survey was administered at different times of the day and days of
respondents to discuss their most frequent route on CARTA, the sampling time did not
seem to make a difference aside from having more declines during rush hour when buses
ran very frequently (Table 3.2 for sampling logistics).
Survey respondents at each sampling site were recruited by interviewers asking
individuals waiting for the bus to take the survey. Interviewers walked from one end of
the bus stop to the other asking each person waiting for the bus if they would be
interested in taking the survey. Each person waiting at the bus stop that was in the path of
the interviewers was asked to take the survey in order to reduce sample recruitment bias.
If the individual agreed to participate, the interviewer then read each question and answer
choices aloud to the participant. The interviewer held the tablet so the respondent could
follow along with the interviewer and mark answers directly on the tablet if desired. All
survey questions were voluntary, and respondents were allowed to skip any questions
they did not wish to answer. All declines to participate were marked on the tablet in order
to keep track of the survey response rate (Table 3.2).
3.3.4 Survey data processing and analysis
Since survey responses were directly entered into a tablet using SurveyMonkey,
the raw data spreadsheets were downloaded from SurveyMonkey. Each response was
given a unique Respondent ID, and abbreviations that interviewers used during data entry
were edited. Frequencies and descriptive statistics of survey answers were compiled
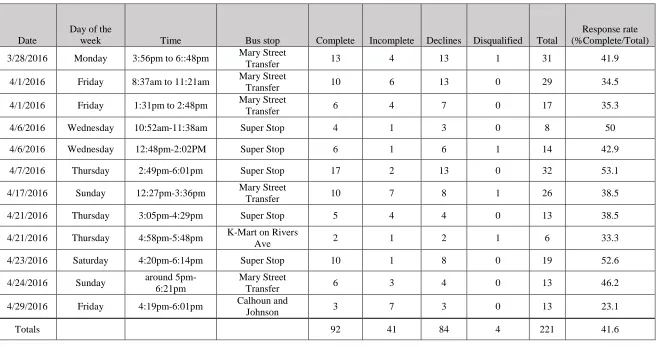
Table 3.2 Sampling sites and survey response rate
Date
Day of the
week Time Bus stop Complete Incomplete Declines Disqualified Total
Response rate (%Complete/Total)
3/28/2016 Monday 3:56pm to 6::48pm Mary Street
Transfer 13 4 13 1 31 41.9
4/1/2016 Friday 8:37am to 11:21am Mary Street
Transfer 10 6 13 0 29 34.5
4/1/2016 Friday 1:31pm to 2:48pm Mary Street
Transfer 6 4 7 0 17 35.3
4/6/2016 Wednesday 10:52am-11:38am Super Stop 4 1 3 0 8 50
4/6/2016 Wednesday 12:48pm-2:02PM Super Stop 6 1 6 1 14 42.9
4/7/2016 Thursday 2:49pm-6:01pm Super Stop 17 2 13 0 32 53.1
4/17/2016 Sunday 12:27pm-3:36pm Mary Street
Transfer 10 7 8 1 26 38.5
4/21/2016 Thursday 3:05pm-4:29pm Super Stop 5 4 4 0 13 38.5
4/21/2016 Thursday 4:58pm-5:48pm K-Mart on Rivers
Ave 2 1 2 1 6 33.3
4/23/2016 Saturday 4:20pm-6:14pm Super Stop 10 1 8 0 19 52.6
4/24/2016 Sunday around
5pm-6:21pm
Mary Street
Transfer 6 3 4 0 13 46.2
4/29/2016 Friday 4:19pm-6:01pm Calhoun and
Johnson 3 7 3 0 13 23.1
Totals 92 41 84 4 221 41.6
Table 3.3. Sampling sites and survey response rate
3.3.5 Study sample
For this research, the targeted population was CARTA bus riders who live in the
study area. A total of 132 CARTA riders volunteered to take the survey, and of those
respondents, 90 were complete responses. Table 3.3 shows a comparison of the study
sample with CARTA rider demographics (BCDCOG and CARTA 2016).
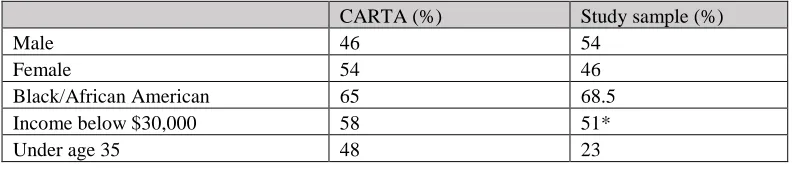
Table 3.3. CARTA ridership and study sample characteristics
CARTA (%) Study sample (%)
Male 46 54
Female 54 46
Black/African American 65 68.5
Income below $30,000 58 51*
Under age 35 48 23
Source: CARTA Comprehensive Operational Analysis (BCDCOG and CARTA 2016)
*In the survey, this represents the sample with a household income below $25,000. CARTA does not provide information about whether the reported income below $30,000 is based on individuals or households.
The study sample has a slightly higher percentage of male respondents compared
to female respondents and fewer respondents under the age of 35 compared to the
available numbers on CARTA ridership. The lower number of respondents under the age
of 35 might be due to the sampling time frames and the inability to get complete
responses during rush hour when a younger working crowd or students might be at the
bus stop. Overall, the majority of the sample had a household income of $25,000 or
below and identified as Black or African American race/ethnicity.
Many respondents rode CARTA either every day or on weekdays (n=84, 63.4%)
or at least a few times a week (n=26, 17.4%) and got to the bus stop by walking (n=85,
74.6%). The most frequent destination respondents traveled to using CARTA was work
sometimes (n=91, 81.3%) if CARTA was unavailable, the most popular alternate mode of
transportation was either getting a ride with someone they knew (n=36, 40%) or taking a
taxi (n=31, 34.4%).
In addition to riding CARTA often, the majority of the survey sample was also
transit-dependent, meaning that CARTA was their primary source of transportation for
completing their most frequent trip described in the survey. The survey measured transit
dependency using four indicators: alternate transportation if CARTA was unavailable
(Appendix B, Q21 and Q22), household ownership of a car (Appendix B, Q48), access to
a car (Appendix B, Q49), and ability to drive a car (Appendix B, Q50). Few respondents
said they could drive a personal car if CARTA was unavailable (n=4, 4.4%).
Additionally, majority of the study sample did not own a car (n=60, 64.5%). The other
measures of transit dependency—access to a car and ability to drive—helped evaluate
whether access to vehicles through the respondent’s social network may reduce the
individual’s level of transit dependency. However, most respondents still indicated that
they either never, rarely, or only sometimes (n=72, 79.1%) have access to a car if they
need one. Over half the respondents can drive a car (n=67, 73.6%), which showed that
transit dependency for most of the respondents stemmed from lack of access to a vehicle
when they had to make their trip.
3.3.6 Sample biases and survey limitations
Many individuals volunteered to take the survey while they waited for the bus,
with the total complete response rate being 43.6% (Table 3.2). The presence of
interviewers might have increased interest and willingness to participate among
the high number of incomplete surveys due to respondents leaving in the middle of the
survey when their bus arrived. Incomplete responses are used in the analysis of some
research questions, which is why some survey questions have a smaller sample size than
others. The higher frequency of buses during rush hour made it more difficult to sample
during the morning and evening rush hour since many people declined to participate as
they expected the arrival of their bus. Another possible bias stemming from this sampling
strategy could be that the sample might consist of more individuals who arrived early to
the bus stop. However, many individuals often gave information about trips different
from the one they were taking during the interview, indicating that this bias might only be
a relatively small issue. The sampling locations also influences the sample composition
since the survey was administered only to individuals taking busses at those transit stops.
To minimize this source of bias, two of the sampling sites selected were transfer stations,
which increased the possibility of sampling riders from a diverse range of bus routes.
Another survey limitation came from the lack of detailed information about
individual sensitivities and adaptive capacity to respond to various impacts that result
from general and flood-induced transit disruptions. This research was designed as a first
step to collect exploratory information about how transit disruptions affect CARTA riders
regularly and during nuisance flood events. The survey tool was selected as the data
collection method to determine how impacts varied among a larger sample size.
Therefore, the short answers collected by the survey provide insight into general factors
that influence the types of impacts the respondent described experiencing during transit
disruptions but not necessarily detailed information about how these factors shaped the