University College London
A
m\tk
The gas sensitive material
Cr (
2
-x) Ti (x) O
3
by
Dirk Niemeyer
PhD, 2001
-ProQ uest Number: U 6 4 2 9 2 9
All rights reserved
INFORMATION TO ALL U SE R S
The quality of this reproduction is d ep en d en t upon the quality of the copy subm itted. In the unlikely even t that the author did not sen d a com plete manuscript
and there are m issing p a g e s, th e se will be noted. Also, if material had to be rem oved, a note will indicate the deletion.
uest.
ProQ uest U 6 4 2 9 2 9
Published by ProQ uest LLC(2016). Copyright of the Dissertation is held by the Author. All rights reserved.
This work is protected against unauthorized copying under Title 17, United S ta tes C ode. Microform Edition © ProQ uest LLC.
ProQ uest LLC
789 East E isenhow er Parkway P.O. Box 1346
Abstract
Chromium titanium oxide (CTO) is a recently discovered gas sensor material that is capable of detecting small concentrations of toxic or flammable gases in air with stability of performance over the short and long-term and minor influences of variations of humidity. CTO is the first new material to be successfully commercialised in large-volume manufacture for sensing of hydrocarbons, VOCs, hydrogen and carbon monoxide at low (ppm) concentrations in air since the introduction of SnOz for this purpose in the 1960s. The main focus of this thesis lies in the systematic investigation of this material in order to develop a detailed theoretical understanding of the gas response mechanism.
CTO was prepared by solid-state reaction of CrzOs and TiOz in air at 1000°C. It crystallises in a solid solution with the general formula Crz-xTixOs. The phase limit is at x ~ 0.3-0.4. Above the phase limit a 2-phase mixture with CrTiOs is found. Substitution of Ti strongly decreases the electrical conductivity of the porous bodies studied. This effect, and the surface segregation of Ti, controls the gas sensor behaviour. Atomistic simulations have been performed on the (0001) and (1012) face to assess defect models for pure- and titanium doped CrzOg. In the absence of titanium, one stable defect is a Cr^ - V d " pair, which segregates to the (0001) surface and contributes to the relatively high p-type conductivity shown by finely porous bodies of CrzOs at elevated temperature; with titanium addition, a stable defect, segregated on both of the investigated surfaces, is the complex (Ti^)3Vc/^. The proportion of surface Cr^ is decreased.
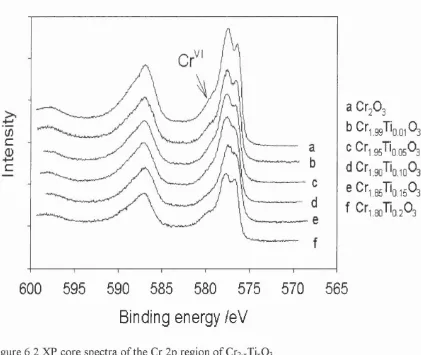
splitting, proposed to originate from local magnetic moments at the Cr site. A Cr^ state is also detected. Substituting titanium decreases the proportion of surface Cr^ and reduces the splitting of the Cr 2p3/2 state. A reappearance of the splitting at higher Ti concentrations was observed, speculatively attributed to ordering of the surface structure.
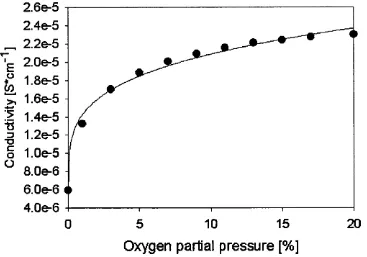
Although currently used solely in oxygen-containing environments CTO can also detect gases in a nitrogen atmosphere. Decreasing oxygen partial pressure caused a large decline in conductivity that is explained by removal of oxygen surface acceptor states. Whilst carbon monoxide and ethanol react with the few remaining acceptor states causing a large gas response, H2S sulphates the
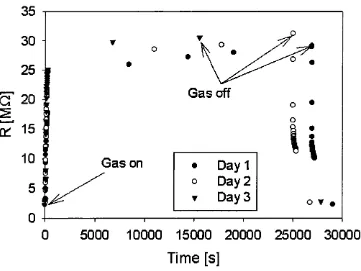
surface. The stable gas response to H2S is caused by reversible adsorption of
H2S molecules on a Ci^ site, forming a new surface trap state.
Replacing titanium in CTO by vanadium, iron, magnesium or manganese resulted in a significantly reduced gas response to carbon monoxide. These elements did not form a solid solution with the Cr20s lattice. However, if introduced as additional elements in CTO manganese and iron dopants crystallised as MnCr2 0 4 and (Cro.4Feo.6 ) 2 0 3 impurity phases and reduced the
amount of chromium. A significantly reduced response to water vapour relative to the response to carbon monoxide was observed with these materials.
-Table o f Contents
Abstract... 2
Table of Contents... 4
Table of Figures... 9
Table of Tables... 12
Table of Abbreviations... 13
Acknowledgements... 14
1 Introduction... 15
1.1 General introduction...15
1.1.1 Development of solid state gas sensors...16
1.1.2 Applications for gas sensors...17
1.1.3 The aim of this research work...18
1.2 Gas sensor properties...19
1.3 Organisation of the thesis...21
2 Experimental methods... 23
2.1 Preparation of the specimen...23
2.2 X - r a y photoelectron spectroscopy (XPS)... 24
2.3 X - ray powder diffraction XRD... 25
2.4 Conductivity and gas response measurements...26
3 Computational simulations...28
-3.2 MARVIN S Program... 29
3.3 Total energy... 30
3.4 How is the total energy derived?...30
3.5 How is this total energy minimised?... 33
3.6 Recent work... 34
4 Computational studies of the chromium oxide surface: analysis of defects and interpretation of the Mars-van Krevelen mechanism for redox catalysis and gas response...35
4.1 Introduction... 35
4.2 CriOs surfaces... 37
4.2.1 General...37
4.2.2 (0001) face... 38
4 2 3 (lOT2)face... 39
4.3 Computational models and results...39
4.3.1 Simulations of the CrzOg corundum structure... 39
4.3.2 Defect models for CrzOs... 42
4.3.3 (0001) face... 42
4.3.4 ( 1 0 l2 ) f a c e ... 43
4.3.5 Computational exploration of the possibility of Chromium vacancy migration... 44
4.3.6 Computational investigation of other defect migrations... 45
4.4 Discussion...45
4.5 Summary... 46
5 Gas-sensing behaviour of the solid-solution Cri-xTixOa (x < 0.5)...53
5.1 Introduction...53
5.1.1 Phase diagram and defect model...53
5.1.2 Electric properties...54
-5.2 Experimental... 55
5.3 Results... 56
5.3.1 Phase characterisation...56
5.3.2 Electrical behaviour... 59
5.3.3 Gas response...61
5.4 Discussion... 65
5.4.1 Phase behaviour... 65
5.4.2 Electrical behaviour... 65
5.4.3 Gas response...66
5.4.4 Speculations concerning surface interactions mediating the gas response ... 67
5.4.5 Summary... 68
6 The influence of defects on the x-ray photoelectron spectra of CrzOj...69
6.1 Introduction...69
6.2 Multiplet splitting (exchange splitting)... 70
6.3 Experimental...71
6.3.1 Sample preparation... 71
6.3.2 Surface investigation... 72
6.4 Results...72
6.4.1 The effect of the Ti defects on the Cr peaks...73
6.4.2 XPS investigation of surface segregation...77
6.5 Discussion...80
6.6 Summary... 82
7 Gas response of semiconducting oxides in a nitrogen atmosphere ..83
7.1 Introduction...83
7.2 Experimental... 84
-7.3.1 Electrical behaviour... 84
7.3.2 Gas response to H2S ... 85
7.3.3 Long term exposure to H2S ... 87
7.3.4 Gas response to carbon monoxide and ethanol... 89
7.4 Discussion:... 91
7.4.1 Electrical behaviour...92
7.4.2 H2S gas adsorption and response model... 92
7.4.3 Variation of the response to carbon monoxide and ethanol with oxygen partial pressure...94
7.5 Summary... 98
8 CO and water response of Chromium oxide doped with transition metal cations in addition to titanium... 99
8.1 Introduction...99
8.2 Preparation method... 100
8.3 Results... 102
8.3.1 Phase characterisation... 102
8.3.2 Electrical behaviour...104
8.3.3 Gas response to carbon monoxide...106
8.4 Discussion...108
8.5 Summary... 108
9 CO and water gas response of manganese and iron doped chromium titanium oxide...109
9.1 Introduction...109
9.2 Preparation of the powders... 110
9.3 Results...110
9.3.1 Phase behaviour... 110
9.3.2 Gas response experiments...116
9.3.3 Variation of manganese and titanium concentration... 121
9.3.4 Gas response of Chromium titanium manganese oxide sensor
devices ... 123
9.4 Discussion...126
9.5 Summary...128
10 Summary and conclusions... 129
11 References... 131
-Table of Figures
Figure 1.1 Gas response of a CTO sensor device at 400°C...17
Figure 2.1 Pellet rig ...27
Figure 3.1 Schematic of the MARVINS simulation cell... 29
Figure 4.1. Top view of the CriOs (0001) surface...47
Figure 4.2 View along the CriOs (0001) face... 47
Figure 4.3 Top view of the defective CrzOg (0001) face...48
Figure 4.4 View along the defective CrzOs (0001) face...48
Figure 4.5 Top view of the CriOg (0 0 0 1) surface with the 3 Ti^A^cr cluster. 49 Figure 4.6 View along the (0001) face with the 3 Ti^/Vcr cluster... 49
Figure 4.7 (1012) face...50
Figure 4.8 View along the (1012) face...50
Figure 4.9 Activation energy of chromium vacancy migration... 51
Figure 5.1 x - ray powder diffraction patterns of Crz xTixOs 0 < x < 0.5...57
Figure 5.2 Lattice parameter variation with Titanium concentration... 58
Figure 5.3 Average crystallite size determined by the Scherrer equation 58 Figure 5.4 Resistivity at 300°C... 59
Figure 5.5 Activation energy for conductivity... 60
Figure 5.6 Arrhenius plots... 60
Figure 5.7 Ramp experiment... 61
Figure 5.8 Response to carbon monoxide at 350°C... 62
Figure 5.9 Gas response to 500 ppm of CO and 100% rel. humidity...63
Figure 5.10 Gas response of a pellet to 500 ppm of CO as a function of temperature... 64
Figure 5.11 Gas response to CO and water of a sensor device... 64
Figure 6.1 Survey spectrum of Chromium titanium oxide...73
Figure 6.2 XP core spectra of the Cr 2p region of Cr2.xTixOs... 74
Figure 6.3 XP valence band spectra of Crz xTixOs... 75
Figure 6.4 XP core spectrum of the Ti 2p region (Cr1.8Tio.2O3) ... 76
Figure 6.5 Variation of surface Cr^ with increasing titanium concentration . 76
Figure 6.6 The Cr 2p peak of CriOg before and after etching... 77
Figure 6.7 Surface segregation of titanium in CriOg... 79
Figure 7.1 Conductivity of a sensor device at 400°C...85
Figure 7.2 Gas response to 5 ppm of H2S in N2 at 450°C...86
Figure 7.3 H2S response of a sensor device in N2 at 450°C...86
Figure 7.4 Response to 5 ppm of H2S in N2 at 530°C... 87
Figure 7.5 Long term exposure to 6 ppm H2S in N2 at 453°C...88
Figure 7.6 Magnification from Figure 7.5...89
Figure 7.7 Response to 200 ppm of carbon monoxide at 400°C and 530°C .90 Figure 7.8 Response to 100 ppm of ethanol at 400°C and 530°C... 90
Figure 7.9 Conductivity of the sensor in the presence of 100 ppm carbon monoxide at 300 °C...91
Figure 8.1 X-ray powder diffraction patterns of Chromium vanadium oxide and chromium iron oxide... 102
Figure 8.2 X-ray powder diffraction patterns of Cr2 0 3 and Chromium magnesium oxide... 103
Figure 8.3 X-ray powder diffraction patterns of chromium manganese oxide and chromium titanium oxide... 103
Figure 8.4 Response to 500 ppm of C O ... 106
Figure 8.5 Response to carbon monoxide at 300°C... 107
Figure 8.6 Response to 100% relative humidity at RT... 107
Figure 9.1 X-ray diffraction patterns of Cr2-x-yTixMny0 3 ...I l l Figure 9.2 X-ray diffraction patterns of Cr2.x-yTixFey0 3... 112
Figure 9.3 XP spectra of the Cr 2p region... 113
Figure 9.4 Valence band spectra...114
Figure 9.5 Cross section of a chromium titanium manganese oxide pellet... 115
Figure 9.6 Ramp experiment... 116
Figure 9.7 Ramp experiment... 117
Figure 9.8 Response to 500 ppm of C O ... 119
Figure 9.9 CO response at 350°C. Resistance over time... 119
Figure 9.10 Response to 50% relative humidity at RT... 120
Figure 9.11 Gas response to carbon monoxide at 300°C,... 121
10-Figure 9.13 Gas response to 500 ppm of carbon monoxide... 123 Figure 9.14 CO and H2O response of sensor devices... 124
Figure 9.15 + 9.16. CO response at 300°C and 350°C over the titanium bulk concentration... 125
-Table of -Tables
Table 4.1 Perfect surface energies calculated by Lawence and Parker ...38
Table 4.2 Potential parameters chosen for use by MARVINS... 40
Table 4.3 Buckingham parameters chosen for use by MARVINS... 41
Table 4.4 Structural parameters of Cr20g...41
Table 4.5 Bulk defect energies for the isolated defects...44
Table 4.6 Defect formation energies... 44
Table 6.6.1 Sensitivity factors... 72
Table 6.2 The main elements on the surface and their binding..energies... 73
Table 8.1 Elements that have been chosen... 100
Table 8.2 Ternary compositions prepared... 101
Table 8.3 Investigation of the impurity phases...104
Table 8.4 XRD characterisation of the powders...104
Table 8.5 Resistivity at 350°C...105
Table 8.6 Activation energy for conductivity for the prepared compounds.. 105
Table 9.1 Surface enrichment of defective atoms...114
Table 9.2 The gas response S = (R/Ro)-l for the different gas sensors... 124
Table 9.3 Corrected Cr to Ti ratio in Cr2-x-yTixMny0 3 and Cr2.x.yTixMhy0 3 .. 127
12-Table o f Abbreviations
voc
Volatile organic compound LPG Liquefied petroleum gas XRD X-ray powder diffractionXPS X-ray photoelectron spectroscopy IR Infra red spectroscopy
FTIR Fourier transform infra red spectroscopy LEED Low energy electron diffraction
TPD Temperature programmed desorption ED AX Energy dispersive analysis of x-rays eV Electron volts
mol Moles
ppm Parts per million
s Seconds
K Degrees Kelvin °C Degrees Celsius
a Conductivity
Go Conductivity in the absence of gas R Resistivity
Ro Resistivity in the absence of gas
P g a s Partial pressure of a gas
mm Millimetres (10'^ metres) □m Micrometres (10*^ metres) nm Nanometres (10'^ metres)
Â
Angstroms (10‘^® metres) pm Picometres (10'^^ metres)Acknowledgements
^ I like to thank my supervisor David E. Williams for providing and supporting this interesting project.
^ Many thanks also to Ben Slater for much advice concerning the computational part of my thesis.
My sincere gratitude goes to Darren Caruana and Keith Pratt for continuous advice in practical and theoretical matters.
A big cheers for the support I got from all my friends and colleagues and for the very pleasant working atmosphere in room G15, G16 and G 25
^ Last but not least I thank my wife Angela for all her support during the difficult times of my Ph.D.
This project was sponsored by the Engineering and Physical Science Research Council and Capteur Sensors Ltd.
14-1 Introduction
1.1 General introduction
Carbon monoxide is the most commonly encountered poison in our environment. It is formed by incomplete combustion of fossil fuels like coal, charcoal, wood or gasoline. Being inhaled, CO combines with the haemoglobin present in the blood and forms carboxyhaemoglobin (COHb). This stable compound is incapable of transporting oxygen to the vital organs like the heart or the brain. So low levels of CO can slowly starve body tissues and organs of oxygen and lead to death.
Annually, due to CO exposure ^
• Tens of thousands of people in the United States seek medical attention or lose several days, weeks, months of normal activity
• More than 500 people die through unintentional exposure • As many as 2000 people commit suicide using CO
Carbon monoxide is particular dangerous because it has no colour, odour or taste and can therefore not be detected by human beings. Every fuel-burning place in homes is a source of carbon monoxide and therefore causes an important risk to personal safety. As a consequence research has been driven to develop sensor devices that provide a cost effective and reliable way to detect carbon monoxide and to ensure a healthy environment.
1. Introduction
1.1.1 Development of solid state gas sensors
Brattain and Bardeen ^ demonstrated about forty years ago that the conductivity of semiconducting oxides could be altered by small concentrations of adsorbed gases. These observations led to the development of zinc oxide as the first solid-state gas sensor. Shortly after, tin dioxide (SnOz) was discovered to be a gas sensing material and commercialised in the 1960s.^ Tin dioxide offered a bigger sensitivity than ZnO at a lower operating temperature and easier fabrication into sensor devices. Although able to detect quantitatively amounts of polluting gases in air, sensors based on tin dioxide suffered from poor baseline stability and a large interference of water vapour. As a consequence, research has focussed on developing better sensor materials. A large range of oxides has been studied systematically in order to examine their changes in conductivity in the presence of small traces of gases. These studies revealed that the response to any kind of gas is a common phenomenon for oxides. *
From the survey of the gas sensing behaviour of a large range of oxides, titanium-doped chromium oxide (CTO) was discovered as an alternative and commercialised by Capteur Sensors & Analysers Ltd. This gas sensing material detects carbon monoxide and volatile organic compounds (VOCs). A good baseline stability and only small water vapour interference made this compound a real breakthrough in sensor technology. The gas response to several concentrations of carbon monoxide in the presence of various water vapour concentrations is illustrated in Figure 1.1. First one notes that the material shows an increase in resistivity in the presence of carbon monoxide, in contrast to the behaviour of tin dioxide, which shows a decrease. Secondly, it can be observed that the increase in the resistivity caused by the water vapour is very small compared with the gas response to carbon monoxide.
1. Introduction
i
800
-600
-400
-200
-4 0 0 ppm CO
150 ppm
70 ppm CO
15000
— — 50% RH at 20°C • . 25% RH at 20“C —m— 10% RH at 20°C
20000
T im e /s
25000
Figure 1.1 Gas response of a CTO sensor device at 400°C
Due to its good stability and low water response the commercial carbon monoxide sensor utilising CTO has been approved by Underwriters Laboratories Inc. (ULI) under the UL 2034 Conformity Assessment. This approval states that the key enabling sensing technology has been fully assessed and tested specifically for use within home safety products and will carry the UL Recognition Mark."^
1.1.2 Applications for gas sensors
Resistive adsorption based sensors are a simple and cost effective way to determine gas components in the atmosphere. These gas sensors can be used for characterisation of the atmosphere concerning air quality or potential hazards, and the assessment of air. The aim is often not to quantify gas components in the atmosphere completely but rather to detect and approximate the quantification of a class of gases or gas mixtures present in the air. It is often the case that normal conditions have to be monitored by
17-1. Introduction
measuring any deviation from an acceptable air quality or from the usual ambience of a process. There is a wide range of uses, for example in car heating-system controls or in self-regulating ovens, or to control waste gases by monitoring for harmful compounds or to monitor high-quality air, low in pollution and odours. There are also certain conditions that are crucial for products to be a success on the mass market, such as prices appropriate to the market, a high degree of reliability at little maintenance cost, small dimensions and low energy consumption.
1.1.3 The aim of this research work
The present work is an attempt to enhance the basic scientific understanding of the material chromium titanium oxide and its gas response to carbon monoxide and water. This aim has been achieved by a combination of experimental and surface analysing techniques with modem computational simulations. A review of the standard gas response model and the main analysing techniques is given in the next section. The results obtained have founded the basis of a deeper theoretical understanding and can be used for development of new sensor materials.
-1. Introduction
1.2 Gas sensor properties
The current consensus is that the conductivity of porous bodies of semiconducting oxides in air is determined by the trapping of electrons in surface states associated with adsorbed oxygen. If oxygen vacancies or interstitials are immobile in the lattice, then the behaviour is described entirely in terms of the distribution of the electrons between surface and bulk states. At elevated temperatures (200-600°C) the conductivity is sensitive to the presence of trace reactive gases because catalytic surface processes result in a kinetically determined change in the surface coverage of the oxygen surface trap states. If oxygen defects are sufficiently mobile in the lattice, then the conductivity is simply determined by the equilibrium between bulk lattice defects and oxygen in the gas phase, and the sensitivity to trace reactive gases is lost. In intermediate cases, a conductivity sensitive to the presence of trace reactive gases but varying in time as the lattice defects equilibrate is observed.
Time-variation of conductivity can also be caused by migration of metal or oxygen defects, which change the potential and hence charge carrier distribution near the surface. The sensitivity to gases, and the time dependence of response, is further modified in a porous body because this behaves as a complex network in which part of the conductivity, that modified by the surface interaction, is gas sensitive, whilst another part, that contributed by the ‘bulk’ sufficiently far from any surface, is not gas sensitive^. Several models concerning the influence of microstructure on the gas response have been proposed. Three different cases are distinguished from another according to the relative magnitude of the crystallite size (D) and the thickness of the space charge layer (2L) ^
D > 2L (grain boundary control). These conditions happen in a well-sintered material. The depletion layer is restricted to the surface region and the grains are connected via wide necks. The conductivity is controlled by activation of electrons from bulk donor states. The gaseous atmosphere would only affect
19-1. Introduction
the conductivity by substantially narrowing the electron channel inside the necks.
D □ 2L (neck control). A less well-sintered material consists of depletion zones which are larger in comparison to the crystal size and which therefore overlap. The grains are connected by narrower necks with a higher resistance through the centre. The conductivity is determined by activation of electrons from surface states and would therefore directly be affected by changes of surface states due to the influence of the gaseous atmosphere.
D < 2L (grain control). In porous bodies with very short and narrow necks the space charge region is extended over each particle. Schottky barriers are formed at the contact points between the grains. Charge transport through the barrier controls the conductivity.
The effects have a substantial impact on the gas sensing behaviour of the material. Such effects complicate the interpretation of data obtained on porous artifacts. Despite such complications, Wilhams and Moseley * showed that there was a general framework within which the behaviour of semiconducting oxides as reactive gas sensors could be understood. Oxygen species act as surface acceptors; if the bulk oxide is n-type then a decrease in the surface acceptor density increases the conductivity whereas if the bulk material is p-type then a decrease in the oxygen surface acceptor density decreases the conductivity. Behaviour which changed from apparently p-type to n-type with change of gas concentration or temperature could be easily rationalised using this model. The first report of CTO as a p-type sensor material for reactive gases was made by Moseley and Williams who claimed that it was selective to ammonia in air. Subsequently, the properties of CTO as a sensor material for H2S in air were described by Dawson et. al. and by Henshaw et. al. A
surface conditioning caused by sulphation and hydroxylation of surface sites was demonstrated, and a model for the sensor action based on reaction of surface oxygen species (Oads ) to form surface sulphate was developed.
1. Introduction
Williams and Pratt ^ described in outline the response of CTO to CO, acetone and toluene in air, and to ethanol, and assumed a response mechanism involving reaction of the target gas with doubly occupied oxygen surface states (0^'ads), by analogy to the mechanisms proposed for the response of SnOz/ Jayaraman et. a l reported responses to NH3, H2 and LPG, showing a response to ammonia increasing with increasing mole fraction of TiOz, to a maximum at approximately Cr1.gTio.2O3. Sensors based on this material have
been introduced commercially for detection of carbon monoxide in air, and for hydrocarbons and VOCs
1.3 Organisation of the thesis
A description of the experimental and surface analytical techniques that have been used in this thesis is given in Chapter 2. It involves the preparation of the specimen, the analysis of these samples via XRD and XPS techniques and the conductivity and gas response measurements. Chapter 3 gives an introduction into the computational simulation techniques that have been used in this thesis. Chapter 4 is the first result chapter. It describes the two mainly exposed surfaces in Cr2 0 3 and sets up a defect model for the plain and the
titanium doped Cr2 0 3. The stability of these defects on the surfaces is assessed
by computational modelling and fitted into a general model, which rationalises the gas response to carbon monoxide.
Chapter 5 focuses on the systematic experimental investigation of CTO. A phase diagram is produced and the electrical and gas sensing behaviour of the different Cr2-xTix0 3 samples is presented. Surface analysis of the CTO samples
via XPS is reported in Chapter 6. Two main areas are investigated, firstly the surface segregation of titanium and secondly the nature of the Cr 2p3/2 peak. Gas sensing experiments of CTO in a nitrogen atmosphere have been carried out in Chapter 7. The first part deals with the H2S response of CTO in a
nitrogen atmosphere, whilst the second part focuses on the variation of the gas response with varying oxygen partial pressure. CO and ethanol have been used
1. Introduction
as target gases. Chapter 8 explains the electrical and gas-sensing effects of CrzOs doped with metal cations adjacent to chromium and titanium, whilst Chapter 9 investigate the iron and manganese doped CTO. A summary and conclusion of the thesis is given in Chapter 10 and the references are listed in Chapter 11.
2 Experimental methods
2.1 Preparation of the specimen
Materials were prepared by solid-state reaction of CrzOg and TiOi. Preliminary work showed that the degree of reaction was sensitively dependent on the particle size and mixing of the two powders, an effect that probably explains the discrepancies in the literature. It has been shown by Shukri“ that with sufficiently small particles sufficiently well dispersed (for example by mixing colloidal dispersions of Cr(0H)3 and TiOi, drying and firing), complete reaction can be obtained in relatively short time at relatively low temperature. A convenient procedure is the following. CriOg in the form of a fine powder with typical particle size 50nm was prepared by careful thermal decomposition in air of ammonium dichromate contained in a large flask fitted with air condenser and dust trap {DANGER: EXPLOSION HAZARD). The temperature should be raised slowly to the ignition point, then the heating ceased. The amount o f material decomposed at any one time should be limited). The powder was dispersed in propan-2-ol, typically 20 gram of powder and 500 cm^ propan-2-ol and the required amount of titanium propan- 2-oxide solution in propan-2-ol was added under ultrasonic agitation, typically 15 cm^ titanium propan-2-oxide in 100 cm^ propan-2-ol. After five minutes 5 cm^ of water was added. After stirring under ultrasonic agitation for another 15 minutes the solvent was evaporated using a rotary evaporator with continuing application of ultrasound throughout the evaporation in order to maintain intimate mixing of the two components. The powder was dried at 120°C for two hours. Subsequently the powder was fired in recrystallised alumina crucibles for twelve hours at 1000°C. The preparation to form a solid solution can be represented by the equation
-2. Experimental methods
2x
Cr^O^
+xTi02
C r
/ (2.1)The preparation was performed by mixing x moles of TiOz with (l-x/2) moles CriOs and so the balanced equation for the reaction is
2 y +
xTiO^
(2.2)2
The representation of this component as Cr2-xTix0 3 is a convenient
approximation.
2.2 X - ray photoelectron spectroscopy (XPS)
X - ray photoelectron spectroscopy is a very powerful technique and was used extensively in this thesis. It provided information about the surface composition of the doped Cr2 0 3 materials. With the help of this technique, the
ions and their charge states on the surface have been identified. Quantification of the peaks gave information about the concentration of the particular ion on the surface. The valence band structure has been also investigated. A detailed description about XPS technology and interpretation of the spectra can be found in the literature. XPS spectra were recorded (VG ESCALAB 220iXL instrument) using focused (300 pm spot size) monochromatized A1 Ka radiation. The binding energies were referenced to the oxygen Is peak at 531.0 eV binding energy and the sample charging was controlled with a 3 eV flood gun. Spectrum quantification was performed using a Shirley background and sensitivity factors were obtained fi'om Wagner et. a l
2. Experimental methods
XPS measurements involve the ejection of electrons from the surface atoms, leaving them with a positive charge. This charging can lead to peak broadening and has to be minimised during the measurements. In order to do that the specimen to be investigated was pressed into a very thin pellet and mounted onto an aluminium tray with doublesided carbon tape. Then the sample was covered with a silver foil, leaving a small hole over the analysis area. Recalibration of the XPS machine was performed regularly in order to eliminate any peak drift.
2.3 X - r a y powder diffraction XRD
X - ray powder diffraction analysis was used to study the phase system of the prepared chromium titanium oxide powders and to evaluate the influence of cation substitution. This technique was used because it provides information about changes in the bulk structure caused by lattice defects. The results obtained from these investigations were used to set up a phase diagram. Apart from the CrzO] phase structure, XRD provided information about the lattice parameters, and the average crystallite size.
The sample was prepared by grinding about 20 milligrams of powder using a mortar and pestle. The powder was then applied between two pieces of amorphous Scotch tape and inserted into a Siemens D 5000 XRD machine. The instrument used an incident beam monochromator and operated in transmission mode. In order to get a good spectrum a step time of 12 s and a step size of 0.02° were chosen. The scan was done from 2 0 = 20°-73°. The duration of one run was eight hours and fifty minutes.
2. Experimental methods
The average crystallite size was determined by additional X-ray line broadening. This phenomenon occurs when the crystallite size is roughly below 200 nm. Line broadening can only give an estimate of the crystallite size, since the K a line has an intrinsic breadth. The Scherrer formula was used to calculate the average crystallite size D.
D= 0 . 9 X / B C O S Os (2 .3 )
where D is the thickness of the crystal in A, À is the x ray wavelength 0b is the Bragg angle and B is the line width in degrees at half peak maximum
2.4 Conductivity and gas response measurements
About 1 g of chromium titanium oxide powder was pressed into pellets with about 2 mm thickness and 13 mm diameter. Those pellets were examined with a computer-controlled rig. (Fig. 2.1)
The rig consisted of a long quartz gas tube with a thermocouple and a ceramic sample holder for up to four samples. Each sample was fitted between two gold electrodes. Alumina spacers divided the gold electrodes.
The quartz tube was fitted into a tube furnace (Carbolite MTF 12/3 8a) to heat the pellets. The resistance changes of the pellets and the thermocouple voltages were recorded every 120 seconds by a Keithley 175A autoranging multimeter and fed into a computer, which recorded the data separately for each of the four samples. The computer also controlled the furnace temperature and the amount of gas flowing through the glass tube via mass flow controllers and solenoid valves. The gas response of the samples was described as:
S = R/Ro (2.4)
One gram of powder was pressed at one tonne pressure into a pellet of 13 mm diameter and 1.5-2 mm thickness, which was sintered before measurement at
-2. Experimental methods
1000°C fo r tw e lv e h o u rs. It is n o te d th a t th e ele c tric p ro p e rtie s o f p re sse d p o w d e rs a re influenced by m any variables, in cluding th e n u m b er and area o f in terg ra n u lar c o n ta c ts, w h ich c o n tro l th e c o n d u c tio n path. T h e re fo re every single pellet b eh a v es d ifferently and th e o b ta in e d re su lts a re n o t strictly re p ro d u cib le. T e m p e ra tu re g ra d ie n ts inside th e fu rn a c e an d small v aria tio n s o f th e gas flo w a re also a so u rc e o f erro rs. All o b ta in e d re su lts w e re co m p ared against a sta n d a rd pellet o f C r1.8Tio.2O3, w hich w a s p re se n t in ea ch run.
Electrical contacts
Gas outlet
■
■
■
■
I
Alumina spacer
Gold contact
F ig u re 2.1 P ellet rig
Pellet
-3 Computational simulations
3.1 Why computational chemistry?
In recent years computational simulations have become a major tool for exploring surfaces and interfaces. These very powerful new methods are able to provide information about the most stable atomic configuration at the surface. Defect calculations deliver information about surface irregularities such as point defects, steps, adsorption or surface segregation of bulk defects.
Static lattice simulations have been chosen for this thesis because they are a common way of carrying out calculations on all kinds of crystals and surfaces. They are based on the use of interatomic potentials, which have either been derived ab initio or empirically by fitting to bulk elastic or dielectric properties. These potentials subsume knowledge of atomic structure into a numerical or analytical function describing the variation of the total energy of the system with the positions of the nuclei. The goal of these calculations is to predict the most stable structure by finding the atomic configuration in which the total energy is at a minimum.
Results that have been obtained in this way have proven to be consistent with many different computational models. Accordingly using pair potentials can simulate the short-range interactions of atoms very effectively. The long-range Coulomb interactions over two-dimensional periodic structures can be summated in a very general way that is computationally efficient. For that purpose the Ewald method has been modified for two-dimensional systems.
Dipolar electronic effects are described by the shell model, in which the ion core is connected via a spring to a massless shell. These methods are capable of reproducing the bulk properties of defect crystals such as the lattice
3. Computational simulations
parameters, and bulk defect energies. Calculations of bulk properties in this thesis have been carried out with the GULP code.
Recent advances have led to the development of sophisticated software codes for computation of surface energies that require only a crystal structure and a specified surface. MARVINS Program was used in this thesis.
3.2 MARVINS Program
MARVINS stands for (Minimisation And Relaxation o f Vacancies and interstitials at Surfaces). As is common for surface simulations the simulation cell used by MARVINS consists of a stack of planes which is infinitely repeated in x and y directions but finite in the z direction (two dimensional periodic boundary conditions). This cell is divided into two regions. Region I symbolises the surface region. Defects are placed in this region. During the calculation, the ions of region I are relaxed to equilibrium. Region II simulates the bulk lattice adjacent to region I. All atoms in region II are kept fixed.
region
region
Figure 3.1 Schematic of the MARVINS simulation cell.
3. Computational simulations
3.3 Total energy
The total energy is the sum over all short and long range interactions of the entire region I structural units interacting with themselves, all the region II structural units and the periodic images of both regions. The total energy is the most important quantity that MARVINS calculates and that is minimised in order to get the most stable surface configuration. In defect calculations the gradient of the total energy provides essential information about the most favourable configuration of the defect.
3.4 How is the total energy derived?
The total energy consists of different terms that depend upon the number of atoms that determine the interaction. The energy Ea for every atom is expressed as
+ Œ U ‘'2 + 4 Z —+ higher order terms (3.1)
b be bad
where is the interaction energy of order (N) between the atoms and a b c d are indexing all atoms in the system. Double counting of the atoms is avoided by the fraction before each summation. The sum of all Ea's is the total energy. Considering only two body interactions the energy of each atom in region I is given by
-3. Computational simulations
b I
The sum over all 2 dimensional lattice vectors is expressed by I and Naii stands for the sum over all of the other atoms in the cell. This equation expresses that the two body potentials depend only upon the magnitude of the atom a b separation. The total energy for all region I atoms is
N, N,
I a b^a
(3 3)
where rab simply means ra - rb and means that 1 = 0 is not included in the
sum. This equation expresses the interaction of each atom a with its periodic images (UH^) and with a periodic plane of atoms b. The second part of the equation can be split in two parts to express the summation over all region I atoms and all region II atoms.
b ^ a b>a
The last term in the sum is the boundary interaction energy.
(3-5)
l a b
The largest contribution to the energy is electrostatic. The long-range interaction is accounted for by using a two-dimensional Ewald sum.
^ M adelung ~ 2 ^ ® (3.6) a b
-3. Computational simulations
with U “ "8 = U r " + U : " (3.7)
Heyes*^ has demonstrated that
t / J '= I e t f c ( G l f ^ + / |) / |/ - , , + / | (3.8)
1
and
= ; r / A { - l z , e r f { G z ^ ) - 2 e x p ( - G z ^ ) /
+ E e x p (il.rJ/|A :|[e x p ^ Â :|z ^ ,)e r/c (jA :|/2 G + G z ^ J (3.9) + e x p ( - \k\z^, ) e r fc \k \ / 2 G - Gz_, )]}
where Zab is the vertical separation between the ions a and b perpendicular to the surface, k are the 2D reciprocal lattice vectors and A is the surface area of the simulation cell. The Gaussian weighting factor G determines how the sum is divided between real and reciprocal space and was chosen to minimise the number of terms in the sum.
G = (7 I/A )^ " (3.10)
These expressions can be directly incorporated into the equation describing the total energy to produce the total coulombic energy with one small correction. The reciprocal sum for an ion interacting with its own images will include a self-interaction term, which is removed by subtracting 2^'^!AG for each region I particle.
A hilly ionic model is used for the potentials of most oxides and halides. The effect of the ionic polarisability is modelled by the shell model of Dick and Overhauser, in which an ion is modelled by a massive core that is connected to a mass less shell via an isotropic harmonic spring restoring force. The full
-3. Computational simulations
charge of the ion is divided between the core and the shell. The electronic polarisability a is given by
a = — (3.11)
where k is the spring constant Y is the ionic charge.
All short-range potentials are acting between the different ion shells. Shell model calculations are based on an ionic crystal model assuming formal ionic charges and dominating pairwise interionic potentials. They are given as long- range Coulomb interactions and short-range potentials. The Buckingham formula was used for the short-range interactions.
= ^ e x p [—^
\ P J
- C r J
(3 12)
with the Buckingham parameters A, p and C. Vab is the Buckingham potential and rab is the distance between atom a and b.
3.5 How is this total energy minimised?
Three types of minimiser are currently available in the MARVINS code.
• The downhill Simplex method is efficient at a distance far from the minimum; however, it is very inefficient near the minimum. For this type of minimiser, only function evaluations are required.
• The conjugate gradient method is very efficient at moderate to close distances to the minimum. Unfortunately this method shows difficulties at very close distance to the energy minimum. It uses energy and first derivative evaluations.
-3. Computational simulations
The hybrid Newton minimiser provides great efficiency in close vicinity to the energy minimum but proves to be inefficient at far distances. This method incorporates the second derivative as well.
3.6 Recent work
B. Slater el al used the MARVINS code to carry out bulk and surface calculations on the behaviour of Sb^ and Sb^ ions substituted in tin dioxide. The (001) and (110) faces were examined. In the absence of any dopant a Sn“ /oxygen vacancy defect pair was predicted to be stable on the surface. Sb^/Sb^ defect pairs were predicted to be highly surface segregated. Sb^ was predicted to be associated with in-plane surface oxygen species, while Sb^ was predicted to be subsumed below bridging oxygen ions in a more bulk-like environment. The most significant driving forces for surface segregation were found to be for Sb^ and Sn“.
R.W. Grimes^^ used atomistic simulation methods to investigate the solution of TiOz in AI2O3, which is isostructural to CrzOs Ti^ defects were charge
compensated either by an 0 ‘“ ion on an interstitial position or by Al vacancies. Assuming clustering of defects a solution energy of 2.31 eV/cation was calculated for the Oi compensation, whilst 1.20 eV/cation was calculated for the Vai compensation. These energies show that aluminium vacancy compensation is much preferred over the oxygen interstitial mode.
4 Computational studies o f the chromium oxide
surface: analysis of defects and interpretation of
the Mars-van Krevelen mechanism for redox
catalysis and gas response
4.1 Introduction
The objective of this chapter is to establish a defect model for both the undoped and the titanium doped Cr2 0 3 surface and then to use these models as
a basis of interpretation of the catalytic activity of CrzOs Atomistic simulations are used to predict the defect energies and site occupancies of those defect states throughout the host lattice.
Chromium oxide catalysts have always attracted much interest and are now used in a variety of hydrocarbon reactions such as dehydrogenation and dehydration of alcohols or the methanol synthesis Surface investigations and oxygen adsorption experiments have been performed extensively during the last decades in order to get a deeper understanding about the reaction mechanism on a molecular scale. Burwell et. a l ^ introduced the notion of the coordinatively unsaturated site to account for a gain in catalytic activity of CrzOg on heating. They identified these sites as exposed Ci^ surface atoms. Activation of the catalyst is achieved by removal of water molecules. Consequently adsorption of reactant gases (especially oxygen) increases rapidly. Zecchina et. al ^ performed infrared experiments and reported a dissociative oxygen chemisorption on the Cr2 0s surface at room temperature,
-4. Computational studies of the CrzOg surface
was observed at 400°C. The existence of these higher oxidised chromium states was confirmed by chemical analysis, X ray photoelectron spectroscopy (XPS) and Raman spectroscopy^'^,^^ The properties of the CrzOg are often improved by other materials, acting either as support or as dopant. Callister et. al studied the influence of TiO: additives and reported an enhanced sintering. They suggested that the cause of this enhancement lay in suppression of the formation of volatile chromium ions such as Cr^.
A generally accepted mechanism for redox catalysis on metal oxides, applicable to chromium oxide, is that of Mars and Van Krevelen^^ (M-vK)
Msurf+CO“> [M:CO]suif
[M:CO]surf + Olatt, surf Mjurf + Vq, surf + CO2 (4.1 )
Vo,surf+ (1/2)02 Olatt,surf
Over et. al.^^ provided an atomic-scale verification of the mechanism for CO oxidation on RUO2. Vedrine et. al ^ pointed out that the M-vK mechanism
required sites having both redox and acid-base properties, particularly if hydrogen abstraction or oxygen insertion formed part of the reaction. They introduced the idea of a surface ensemble of ions constituting the active site, of particular structure: an inorganic molecular complex of a particular arrangement to promote a particular reaction. The element of the reaction which involves the dissociation of molecular oxygen has recently been explored in a computational study of the Sn02 su rface.T h is work showed that oxygen gas will dissociate at a bridging oxygen vacancy on the oxide surface, with one atom filling the vacancy and the other being adsorbed onto a coordinatively unsaturated (5-fold coordinated) adjacent surface Sn^®. Zaki el al^^ showed that CO oxidation on Cr2 0 3 commences at a temperature as low
as 120°C and 100% conversion is achieved at near 220°C. They showed that this good combustion rate is achieved by surface chromate species Cr^ and the main reaction site to be Cr^-Cr^. A detailed reaction scheme was not proposed.
-4. Computational studies of the CrzOg surface
4.2 CriOg surfaces
4.2.1 General
a CT2O3 is a semiconductor with a band gap of 3.4 eV. Like AI2O3 it
crystallises in the corundum structure, in which the oxygen atoms are hexagonal closed packed. The Ci^ cations are octahedrally coordinated by oxygen ions and one third of the possible cation sites are vacant. Zecchina et. al performed IR investigations of a CriOs that they prepared by decomposition of ammonium dichromate. They identified the (0001) face as the main exposed face at which the major reactions like oxygen, water or carbon monoxide adsorption take place. Twenty-three years later Zecchina et. al. now assigned the (1O I2) face as the predominant phase in a CriOs,
using FTIR spectroscopy and high-resolution electron microscopy.
Lawrence and Parker used atomistic lattice simulation techniques to calculate the surface energies for several planes of CrzOs, displayed in Table 4.1. The (0001) face had the lowest surface energy after relaxation. The (1 0 1 2) surface energy is found to be low before and after relaxation. From
that Lawrence and Parker deduced that the latter face is most likely to be experimentally observed.
-4. Computational studies of the CrzOs surface
Table 4.1 Perfect surface energies calculated by Lawence and Parker36
Surface Unrelaxed energy (J*m‘^) Relaxed energy (J*m'^)
0001 4.59 1.61
loTo 5.05 2.10
1120 3.42 1.90
iiT o 4.34 2.05
1 0 l2 2.77 1.70
4.2.2 (0001) face
The (0001) basal plane is the most commonly investigated surface of CriOs (see Figure 4.1 and 4.2). A good review is given by Freund.^^ It is a polar surface of corundum structure. (0001) CriOs films have been prepared by careful oxidation of Cr (110). Adsorption experiments revealed that oxygen was molecularly adsorbed at 90 K. A wide band in the infi-ared spectra indicated the presence of several different adsorbed 0% species. At 415 K oxygen dissociation takes place resulting in the formation of chromyl groups with Cr=0 double bonds. Experiments with isotope labelled revealed that no exchange of oxygen atoms with the lattice occurred in the stage of molecular oxygen adsorption. 0% dissociation and the formation of chromyl groups resulted in an exchange with lattice oxygen. Freund concluded that the oxygen adsorption changes the electronic structure of the molecule. Photoelectron experiments confirmed that these changes arise from charge transfer from the surface to the molecule. 34
4. Computational studies of the Cr203 surface
4.2.3 (l012)face
The (1012) surface is non-polar and has been found by Zecchina et. to be the predominantly exposed surface in a Cr2 0 3. (See Figure 4.7 and 4.8) All
O^' ions in the top layer are three coordinate and the Ci^ cations contained in the second atomic layer are five coordinate, so both ions have one degree of coordinative unsaturation relative to their bulk counterparts. Cox et. al.^^
performed LEED experiments on the ion bombarded and annealed surface. They discovered that the most stable configuration is a simple bulk termination, which corresponds with calculations that predict a low surface relaxation. Just as for the (0001) surface, IR investigations show dissociative oxygen adsorption at elevated temperatures, leading to formation of chromyl groups. Cox et. estimated full coverage of the surface Cr atoms with oxygen leading to Cr at the surface in formal oxidation state (V). Molecular oxygen is adsorbed on top of these species.
4.3 Computational models and results.
4.3.1 Simulations of the Cr2 0 3 corundum structure
The Cr2 0 3 (0001) plane consists of buckled layers of chromium between flat
layers of oxygen atoms. Electrostatic stability is achieved by cutting the stack between the buckled metal ion layer, so that only half of the number of atoms is left on each surface created. The surface was simulated by using the MARVINS code developed D.H Gay and A. Rohl in 1995 (see section 3.1.2). The Buckingham formula was chosen to represent the short-range interactions. The potentials for chromium oxide have been derived by Lawrence and Parker^^, the potentials for the titanium impurity have been taken fi-om R.W. Grimes.^^
-4. Computational studies of the Cr203 surface
The potentials were tested by carrying out a bulk constant pressure relaxation prior to the surface simulations. This was done by using the GULP code The potentials have been able to reproduce the lattice parameters (Table 4.1) quite accurately. After that GULP was used to calculate bulk defect energies for isolated defects (Table 4.5), which were then summed together in Table 4.6.
Table 4.2 Potential parameters chosen for use by MARVINS
Chromium charge +2.03 Shell Charge +0.97 Spring constant [^J 100 Titanium charge +4.00 Shell Charge 0
Spring constant |^ j
Oxygen Charge +0.18 Shell Charge -2.18 Spring constant [^J 27.29
The Buckingham Formula was used for the short-range interaction
K i
=^exp
- r
abI
P J
- C r J
(4
2
)
with the Buckingham parameters A, p and C. Vab is the Buckingham potential and rab is the distance between atom a and b.
-4. Computational studies of the CrzOs surface
Table 4.3 Buckingham parameters chosen for use by MARVINS
Interaction A(eV) p(A ) C (eV*A")
OII _ 1734.1 0.301 0
0 " - C r ^ 985.8 0.301 0
q Ii_ o « 22764.3 0.149 27.88
OII _ jjiv 2549.4 0.299 0
Table 4.4 Structural parameters of Cr20g
Literature Calculated Diff(% ) Space group
Lattice constant (Â)
R-3c R-3c
a 4.952 5.024 1.45
c 13.598 13.101 -3.10
Unit cell volume (Â 288.71 286.430 0.7
Table 4.3 shows the computed structural parameters. The close agreement between theory and experiment for the lattice parameters and unit cell size is taken as evidence for the reliability of the interatomic potentials used.
-4. Computational studies of the Cr203 surface
4.3.2 Defect models for Cf2 0 3
The postulate offered is that the water vapour removal needed to activate Cr2 0 3 leaves exposed Cr atoms on the surface, which are coordinatively
unsaturated Cr^ states are formed as a consequence acting as acceptor states. These states remove electrons out of the valence band and cause the p-type conduction of the plain Cr2 0 3 The Cr^ states are charge balanced by
chromium vacancies. According to this model Cr^ should be restricted to the surface region, in fact, it has never been regarded as existing in the bulk lattice.
Crfl,
^C r tS C O ,
(4.3)This was the first model calculated. The second model was set up to describe the case of titanium doped Cr2 0 3 Ti^ states are created on the surface. They
are charge balanced by chromium vacancies. This mechanism is also proposed by Holt and Kofstad
2x
1
^ ^ 2 ^ 3 “*■ ^ T i 0 2 (4.4)4.3.3 (0001) face
The stability of lattice defects was explored computationally, both for bulk defects and for defects approaching the (0001) surface. Since the largest term in the lattice energy is the electrostatic term, the most stable defect in
-4. Computational studies of the CrzOg surface
Cf2.xTix0 3 was a cluster of three Ti^ in an equilateral triangle surrounding a Cr
vacancy (Fig.4.5/4.6). The most stable position of this cluster was near the surface. Defect formation energies relative to the perfect crystal are given in Table 4.6. The segregation energy for this cluster was large. In the surface- segregated defect cluster, oxygen anions surrounding the chromium vacancy relaxed away from the vacancy and moved up slightly out of the surface. If the Ti cations were placed on the surface, then in the relaxed structure they also moved out of the surface slightly - again, this is an electrostatic effect due to the image forces. The defect pair Cr^-VcR^^^ in pure CriOs was also explored. Again, the most stable state was an associated pair segregated to the surface. The defect formation energies and segregation energies are also given in Table 4.6. There was a significant distortion of the surface oxygen configuration: the oxygen ions clustered closely around the Cr^ and relaxed away from the chromium vacancy. There was an optimum distance apart for the chromium vacancy and the Cr^: approximately 5 Â. The optimised surface configuration for this cluster is illustrated in Figure 4.374.4.
4.3.4 (1 0 l2 )fa c e
The same defects have been also exposed at the (1012) face (Fig.4.7, 4.8) The 3 Ti^/Vcr showed surface segregation as well, however, the calculation did not converge when the defect was put on top of the surface. This particular total energy listed in Table 4.6 was calculated with the defects one layer below the surface. This problem illustrates the major difficulty with calculations such as these, which is that of choosing appropriate potentials. The Cr^/Vcr defect was found to be unstable. No distortion of the lattice was observed in either calculation.
-4. Computational studies of the Cr2 0 3 surface
Table 4.5 Bulk defect energies for the isolated defects, calculated by GULP Isolated defect Bulk defect energy [eV]
Tiiv -33.40
Vcr +55.19
Vo +25.98
C r" -234.07
Table 4.6 Defect formation energies
Face Cluster Bulk defect Surface defect Segregation Energy [eV] Energy [eV] Energy [eV] 0001 3 Ti'^/Vc" -44.86 -48.62 -3.76
0001 Cr"A^c/" -178.88 -180.54 - 1.66 10l2 3 Ti^A^cr® -44.86 - 47.24 -2.38 10l2 Cr"/Vc,® -178.88 -176.60 +2.28
4.3.5 Computational exploration of the possibility of Chromium vacancy migration
The possibility of chromium vacancy migration was explored computationally by using the GULP code. For that a chromium vacancy was placed between three titanium ions and the defect energy was calculated. This vacancy was then moved via interstitial places into the chromium site one layer below. The defect energy for the interstitial sites was calculated and subtracted from the initial defect energy. Defect formation energies of the interstitial sites with respect to the initial surface are given in Figure 4.9. An energy barrier of 7.26 eV was calculated for chromium vacancy migration (see Figure 4.9). It appears that this defect is stable and does not migrate.
-4. Computational studies of the CrzOg surface
4.3.6 Computational investigation of other defect migrations
Charge balance in the lattice consequent upon introduction of Ti could be achieved also either by reduction of Ti^ to Ti°^ or by introduction of oxygen vacancies. In the calculations clustering of the defects was assumed. The charge neutral defect including an oxygen vacancy (Ti^VcrVo) shows a bulk defect energy of +39 eV and is therefore unlikely to exist in the CTO lattice. Formation of Ti°^ seems also unlikely because there is no experimental evidence of such a species in CTO (see chapter 6).
4.4 Discussion
The computational studies suggest that some lattice defects can be stabilised by the formation of defect clusters and by the segregation of these clusters to the surface. We have noted in the introduction that the surface sites of Cr20a are well characterised and that there have been speculations concerning the involvement of different parts of surface sites in the catalytic activity of chromium trioxide. Combination of these ideas with our computational studies of the chromium oxide surface suggest an interesting interpretation of the carbon monoxide combustion. It seems reasonable to propose that the chromium vacancy provides a site for carbon monoxide adsorption, promoted by the relaxation of the surface oxygen atoms away from the vacancy: the vacancy carries a net negative charge and CO is a dipole with oxygen positive, so it is plausible to suggest that CO adsorbs with oxygen down, in the pocket over the vacancy. Dissociation of the oxygen molecule is on Cr^ (mainly for the case of CriOs) or Ti^ (mainly for the case of CTO). The postulate is that oxygen is bound first as a peroxo species that then slowly dissociates: an analogous mechanism has recently been shown through computation to be feasible on Ti-substituted zeo lites.T h e second adsorption site needed for an oxygen atom could be either adjacent Cr® or the surface pocket formed over
-4. Computational studies of the CriOg surface
the Cr vacancy. The two surface oxygen atoms would then constitute the surface electron trap states, one of which would be significantly more reactive than the other. Removal of these surface trap states could be achieved by reaction with the carbon monoxide. (Scheme 1). Exposed Cr^ on the surface could provide an extra adsorption side for carbon monoxide. Carbon dioxide would be formed by reaction with oxygen, adsorbed on an adjacent Cr^ or Ti^ site. Reoxidation could then be achieved by dissociation of an oxygen molecule between the Cr^ or Ti^ and an adjacent chromium vacancy. This is a M-vK mechanism in which the catalytic entity is a surface defect cluster. Removal of Cr^ sites, as believed to be the case in CTO, did indeed lead to a substantial decline in CO oxidation activity.'^^ The reaction site would involve a Ti^A^cr defect cluster, as shown in Scheme 1.
The proposed model is capable of explaining the redox behaviour of CriOs (0001) films that are grovm as combustion catalysts. Although the formation of a Cr^ Vcr cluster is unfavourable for the (1012) face, it is likely that the Cr^ charge can be balanced and therefore stabilised by adsorbed oxygen atoms from the air.
4.5 Summary
Atomistic simulations have been performed on the (0001) and (1012) face to assess defect models for pure- and titanium doped CrzOg In the absence of titanium, one stable defect is a Cr^ - Wei" pair, which segregates to the (0001) surface. With titanium addition, a stable defect, segregated on both of the investigated surfaces, is the complex (Ti^)3Vc/^. Distortion of the
arrangement of surface oxygen above the Cr vacancy creates a potential binding site; the high-valence surface cation creates another. The spacing of the two sites is such that they could act in consort to promote a surface reaction, which can be formulated as a Mars- Van Krevelen mechanism.
-4. Computational studies of the Cr203 surface
F ig u re 4 .1 . T o p v iew o f th e C riO ] (0001 ) surface.
4:"
€ 4'
4' 4' wT
4
F igure 4.2 V iew alo n g th e CrzO ] (0 0 0 1 ) face
47-4. Computational studies of the Cr203 surface
C rVI
C r v a c a n c y
F igure 4.3 T o p v iew o f th e d efectiv e C r2 0 3 (0 0 0 1 ) face. T h e a rro w s m ark th e p o sitio n o f C r^ ‘ an d th e ch ro m iu m vacancy.
LO
4
vacancy
F ig u re 4 .4 V iew alo n g th e d efectiv e C r2 0 3 (0001 ) face
-4. Computational studies of the Cr203 surface
F igure 4.5 T o p v iew o f th e CrzO ] (0 0 0 1 ) su rface w ith th e 3 T i‘^/V cr clu ste r
Cr vacancy
4
F ig u re 4 .6 V iew alo n g th e (0 0 0 1 ) face w ith th e 3 Ti'^A^cr clu ste r
-4. Computational studies of the Cr203 surface
c O
F igure 4 .7 ( 101 2 ) face
• C l 5 ^
F ig u re 4 .8 V iew alo n g th e ( 101 2 ) face
-4. Computational studies of the CrzO] surface
3.0
1.0 2.0
0.0
z[A]
Figure 4.9 Activation energy of chromium vacancy migration
-4. Computational studies of the CriOg surface
Scheme 1: Model for surface processes. Reactions A create reactive oxygen species, which can also act as surface trap states for electrons. Reactions B remove the reactive surface oxygen species. Reactions C regenerate the initial surface
state.
A
B
VI
Or— VCr
O'.0 o=po c f — VCr
(+)
0
C r
+ CO
- CO.
T i — VCr
O 0 ^ 0: IV
fi — Vqj
(0 (+)
°rJ
Ti Cr+ CO
- CO,
O
Cr — Vc,
C = 0
o oc
C r — VCr
- COr
V I
Cr— VC r
O
Ti — Vqj
C = 0
O OC
Cr — VC r
- COfl
Ti — VC r
52-5 Gas-sensing behaviour of the solid-solution
Cr
2
-xTix
0 3
(x < 0.5)
5.1 Introduction
It has been mentioned in chapter 1 that chromium titanium oxide (CTO) has excellent capabilities for carbon monoxide detection. The purpose of this research was to present the behaviour of this material particularly in respect of its response to carbon monoxide and water vapour, to describe critical factors controlling the response and to discuss the surface chemistry which mediates the electrical response.
5.1.1 Phase diagram and defect model.
Early phase diagram work on the Cr2 0 3 - TiOz system reported a series of
phases of the form Cr2Tin-202n-i and a phase (the ‘E ’ phase) of nominal composition Cr2Ti20? with a wide composition range. Above 1300°C, a two- phase mixture of ‘E ’ and corundum phases is reported to exist over the range 45 to 98 mol% TiÛ2 in CrOi.s However Henshaw et. al. reported a solid
solution phase in Cr2-xTix0 3 with x < 0.4. Jayaraman et. al. ^ showed that,
over the range x=0.1 to 0.4, the solid solution was the major phase, merging with CrTi0 3 as the minor phase. All of these reports used solid-state reaction
of mixed Cr2 0 3 - TiÛ2 as the preparation method. Oyama et. al. prepared
CTO by laser-induced explosive chain reaction of Cr02Cl2-TiCl4-H2 in the