Volume 7, No. 6(Special Issue), November 2016
International Journal of Advanced Research in Computer Science REVIEW ARICLE
Available Online at www.ijarcs.info
Estimating the Severity Level of Alcohol Use in Future
Navdeep Kaur
Research Scholar, Punjabi University, Patiala
Williamjeet Singh
Professor (CE), Punjabi University, Patiala
Abstract: Alcohol addiction is a persistent, often relapsing and mental disorder that makes the brain of people uncontrollable. The global status report on alcohol and health by World Health Organization, WHO (2014) states that 38.3% of the world’s population consumed alcohol regularly. The objective of this study is to implement the software which predicts the severity level of alcohol consumed by people in future means how prone the person will be addicted to alcohol. 204 heavy drinkers were taken into consideration for collecting the data through questionnaires. This study divides the results in three parts: Red alert means you will be highly prone to alcohol in future, Yellow alert means you will be at middle level of getting addicted to alcohol, Green alert that means there are very less chances that you will be addicted in future.
Keywords: Addiction, Prediction.
I. Introduction
Alcoholism is not a noble issue, not a lack of commitment or not a matter of choice. Addiction of alcohol changes the brain of people and quitting alcohol is very difficult job. This portrays the negative outcome for individual and society. In [10], a global status report on alcohol and health by World Health Organization, WHO (2014) estimated that about 3.3 millions of deaths occur each year due to high addiction of alcohol. There is a need to resolve the problem of alcohol consumption by deeply knowing the risk factors that indulge the people to take alcohol.
.NET is a framework that provides the better user interface to interact with the people. This paper predicts the severity level of people means how prone the person is to take alcohol in future. There is an implementation of work in .net framework which estimates the chances of drinking alcohol for a single individual in future.
The objective of this paper id to design a software that will predict that whether the person will be addicted to alcohol in future or not and how many chances are there that he will get addicted. This paper is organized as follows: Section 2 represents the method used for designing the software followed by section 3 which confers the result and section 4 discusses the conclusion and future scope.
II. Method for Implementation
Data is collected through questionnaire by visiting the alcohol de addiction centers in Patiala, Punjab. There are four age groups: 0-24, 25-40, 41-60 and >60. Every age group has its different questionnaire and this is based on the risk factors which affects the person to turn into drink. In [1], [4] authors take the factors which include: family factors, physical factors, quantitative factors, environmental factors, medical factors, religious factors. Each and every factor has its different sub factors corresponding to their group. 204 heavy drinkers are taken into consideration for collecting the data. On the basis of collected data each option for a particular question has given the probability. This probability is based on the answers that are given by addicted persons.
A. Selecting the Framework
NET framework is used to design the software. This framework is composed of two components that are: common language runtime (CLR) and .NET framework class libraries. The CLR is the actual base of .NET framework. CLR acts as an execution engine for all the applications build in .NET framework. Every target computer needs the CLR to execute the .NET application that uses this framework. The language that is used to design the software is C# and SQL server 2008 is used to store the database at the back end.
B. Key tasks for designing the tool
1.Prepare the database 2.Make the web pages
3.Prepare the graphical user interface for people 4.Writing the codes behind the pages
5.Handle the control navigation from other pages 6.Apply constraints according to requirement 7.Link the pages to the database
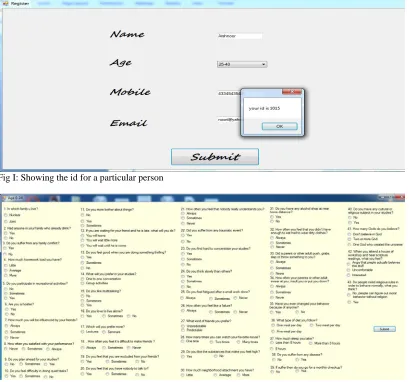
C. Software Interface
Fig I: Showing the id for a particular person
Fig II: Represent the interface for age group 0-24
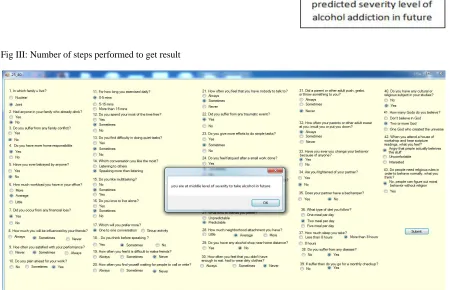
III. Results generated by the tool
Results are on the basis of answers given by an individual. All the ticked options get added together and conclude the particular result. The result can lie in the three intervals: the interval where level of severity is low means there are very less chances that you will be addicted to alcohol in future, the interval where level of severity is middle means the chances are more than first level and the third interval where
Navdeep Kaur et al, International Journal of Advanced Research in Computer Science, 7 (5) (Special Issue) September 2016,321-326
Fig III: Number of steps performed to get result
Fig IV: Result given by tool to a patient after filling the form
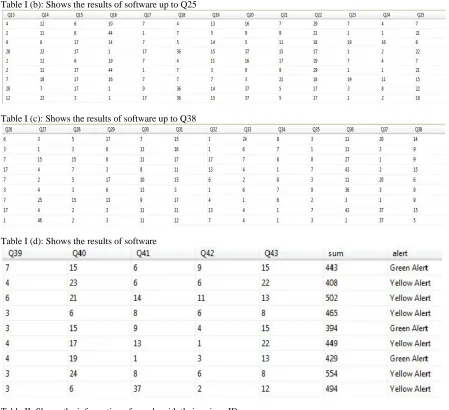
[image:3.612.71.513.499.601.2]Table I (d): Shows the results of software
Table II: Shows the information of people with their unique ID
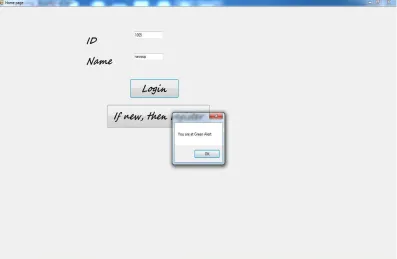
The software stores the information of all the people who registered their self for estimating their severity level of getting addicted to alcohol in future. If someone wants to know about the results again then he or she do not need to
[image:4.612.59.508.52.462.2]Navdeep Kaur et al, International Journal of Advanced Research in Computer Science, 7 (5) (Special Issue) September 2016,321-326
Fig V: Getting results through login into the page
IV. Conclusion and Future Scope
The present findings predict the alcoholic behavior of a person and his level of taking alcohol in future. The software helps the people to know about their addictive behavior and they come to know about the factors that cause themselves to turn into drink. This study divides the results in three parts: Red alert means you will be highly prone to alcohol in future, Yellow alert means you will be at middle level of getting addicted to alcohol, Green alert that means there are very less chances that you will be addicted in future. This tool concludes the results on the basis of data which is collected from addicted people. People who will be at the high level of taking alcohol in future can improve their behavior by knowing their most affected characteristics which turn them to be alcoholic in future. This work can be improved by taking the more attributes that affect the alcoholic person and by surveying the more de-addicted centers to collect the large amount of data from addicted people.
V REFERENCES
[1] Brett Maclennan, Kypros Kypria, John Langleya and Robin Room, “Non-response bias in a community survey of drinking, alcohol-related experiences and public opinion on alcohol policy,” in Drug and Alcohol Dependence, vol. 126, pp. 189–194, 2012. [2] Helene Raskin White, PhD, and Kristina Jackson,
PhD, “Social and psychological influences on emerging adult drinking behavior,” in Alcohol
Research and Health, vol. 28(4), 2004-2005.
[3] Katrijn Houben, Klaus Rothermund, W. Reinout
Wiers. “Predicting alcohol use with a recoding-free variant of the Implicit Association Test,” in Addictive Behaviors, vol. 34, pp. 487–489, 2009.
[4] Louise Legault, Michelle Anawati and Robert Flynn, “Factors favoring psychological resilience among fostered young people,” in Children and Youth Services Review, vol. 28, pp. 1024-1038, 2006. [5] M. E. Hamburger, R.T. Leeb and M.H. Swahn,
“Childhood Maltreatment and Early Alcohol Use among High-Risk Adolescents,” in Journal ofStudies on Alcohol and Drugs, vol. 69(2), pp. 291-295, 2008. [6] Marie Yap, Anthony Jorm, Renee Bazley, Claire Kelly, Siobhan Ryan and Dan Lubman, “Web-Based Parenting Program to Prevent Adolescent Alcohol Misuse: Rationale and Development,” in Orygen Youth Health research Centre, Centre for Youth Mental Health, University of Melbourne, Parkville, VIC, vol. 19(4), pp. 339-344, 2011.
[7] Natalie Guillen, Erick Rotha, Alhena Alfaroa and Erik Fernandez, “Youth alcohol drinking behavior: Associated risk and protective factors,” in Revista Iberoamericana de Psicologia Y Salud, vol. 6, pp.53-63, 2015.