Volume 7, No. 1, January-February 2016
International Journal of Advanced Research in Computer Science
RESEARCH PAPER
Available Online at www.ijarcs.info
Web-based Automated Time and Effort Tracking Software for a Software Project
Vivian Brian Lobo
Department of Computer Engineering St. Francis Institute of Technology
Mumbai, India
Sehba Siddiqui
Department of Computer Engineering St. Francis Institute of Technology
Mumbai, India
Nazneen Ansari
Department of Information Technology St. Francis Institute of Technology
Mumbai, India
Ibtisam Mogul
Department of Information Technology Fr. Conceicao Rodrigues College of Engineering
Mumbai, India
Abstract: A time tracking software is the one that permits users to record time spent on tasks. This software is used by many people such as individual employees or workers, project management team members in a company for a software project, professionals who charge their customers by the hour, and hourly workers. A time tracking software epitomizes an automated version of the conventional paper timesheet. It helps in increasing productivity, boosts responsibility for big companies, and allows company managers to save time-related data at a central location, which helps in straightforward analysis of data. This study aims to develop a web-based automated time and effort tracking software for a software project. This study also discovers the advanced thoughts to measure time and effort of a project member in a project.
Keywords: effort tracker; project; software; time tracker; web
I. INTRODUCTION
A time tracking software is the one that permits users to record time spent on tasks. This software is used by many people such as individual employees or workers, project team members in a company for a software project, professionals who charge their customers by the hour (e.g., solicitors, auditors, and freelancers), and hourly workers.
A time tracking software epitomizes an automated version of the conventional paper timesheet. It helps in increasing productivity (i.e., companies are able to better understand what practices or methods waste time), boosts responsibility for big companies, and allows company managers to save time-related data at a central location, which helps in straightforward analysis of data.
Time and effort tracking of a project in a company is a challenging task. There are several reasons why a company may need to track time.
Each company’s reasons for tracking time will have large impact on the details of their own best time tracking solution. Tracking time—no matter the reason—is a big step toward corporate cost accounting experience.
The real value of your time data is its accuracy and completeness. The process of tracking time has to be easy. Dedication to time tracking has to start at the top of a company [1].
However, it is not easy to gage effort spent on a project in a company for determining a valid and concrete status since the traditional system of tracking effort experiences ambiguities and inaccuracies leading to confusing results. Uncertainty in information cannot be used to make strategic decisions.
Effort measurement expended on a project is vital to predict
study also discovers the advanced thoughts to measure time and effort of a project member in a project, which helps in providing a transparent view of a company’s effort on a team project.
The remainder of this paper is organized as follows. Section 2 explains the proposed system, Section 3 describes the block diagram of the proposed system and system requirements, Section 4 explains the working of the proposed system, and Section 5 concludes the study with scope for future work.
II. PROPOSED SYSTEM
Our effort tracker system (www.efforttracker.co.in)—a smart way to track all your project efforts—not only tracks individual efforts but also team efforts of a project in a company.
It helps in picturing comprehensive data analysis with colorful histograms and pie charts. It provides an automated entry and shows real-time project data on a dashboard.
It can be used for data analysis, time and effort analysis, analyzing an individual’s productivity, and comparative study of productivity and project hours.
In other words, it helps in organizing, managing, and analyzing information.
The advantages of our proposed system are as follows: • Free from manual task
• Time saving
• Managing extensive amount of qualitative data • Increased flexibility
• Improved validity and auditability • Easy accessibility
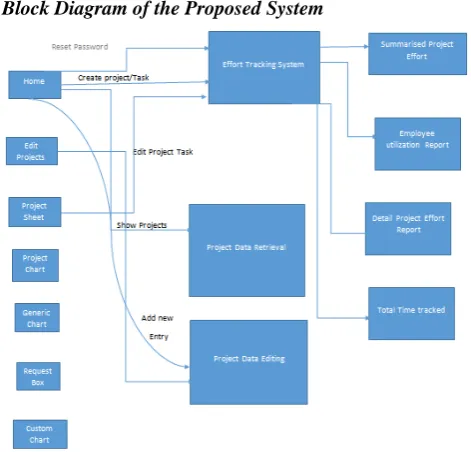
A. Block Diagram of the Proposed System
Figure 1. Block diagram of our proposed system.
[image:2.595.53.289.56.282.2]B. System Requirements
Table I lists the system requirements for the proposed system.
Table I. System Requirements for the Proposed System
Hardware Requirements Software Requirements
• A computer with 1.9 GHz
or higher processor with 2 GB RAM
• Approximately 80 GB
hard disk space
• A server machine with
99.99% uptime
• Microsoft ASP.NET 4.0
• Windows 7 or higher
• .NET framework 4.0 or
higher
• Internet with minimum 2
Mbps speed (to send packets to the server)
• Mailing server
• JQuery and HTML5
support
III. WORKING OF THE PROPOSED SYSTEM
Our proposed system can be gained access via http://www.efforttracker.co.in/Login/Login?ReturnUrl=%2f, which transmits a user to the login page—on intranet—of our proposed system.
Figure 2. Login page of the effort tracker.
Figure 2 shows the login page of the effort tracker where a user needs to enter his valid email ID and password to “sign in” the system. For first-time users, they need to “sign up” (i.e., create an account) and then they can “sign in” the system.
[image:2.595.313.547.278.671.2]Figure 3. Dashboard of the effort tracker system.
[image:3.595.314.553.61.500.2]Figure 4. Home pageCreate Project\Task.
Figure 4 shows how a user can create a project in the system by adding the Project Name, Time Bound (Yes/No), Start and End dates for a software project, and Expected Hours for a software project.
Once the user has successfully entered all the project details, the user can view his/her newly created projects. Figure 5 shows the list of all projects that are successfully created by users. In other words, Show Projects display all active projects that a user has created. Moreover, there is a play button () that enables the logger—a device or computer program for making a systematic recording of events—to be shown.
Figure 5.Home pageShow Projects.
For every successfully created project, there is a timer that helps in keeping a track of time (i.e., our system has made a provision of a timer that helps in maintaining a start and stop time for a software project). If a user has selected Time Bound (Yes), then only the timer can be activated for a software project. However, if a user has selected Time Bound (No), then the timer will not be activated for a software project. Figure 6 shows the activation or working of a timer for a software project.
[image:4.595.306.566.201.318.2]Figure 6.Home pageShow ProjectsTimer.
Figure 7. Home pageAdd New Entry.
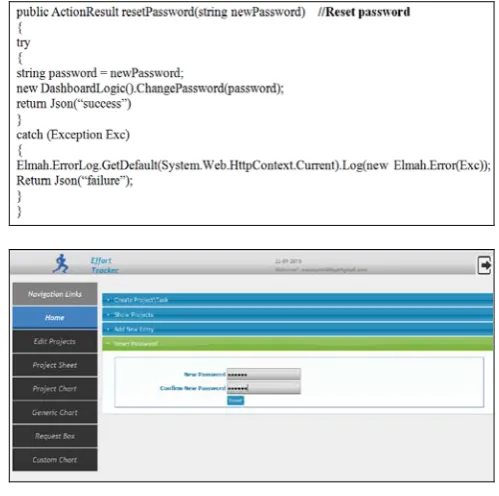
[image:4.595.39.287.343.475.2]Furthermore, the user can add a new entry for a software project, as shown in Fig. 7. Alternatively, if the user has forgotten to initiate the logging process for a software project, then his/her respective project manager can do the needful. This feature in our proposed system acts as a safety backup. The user can also reset his/her password, as shown in Fig. 8.
[image:4.595.307.557.427.675.2]B. Edit Projects Module
Figure 9. Edit ProjectsEdit Projects/Task.
[image:5.595.308.559.77.230.2]For any project that a user has successfully created, he/she can edit or modify the project details in the Edit Projects module. The parameters that can be modified for a software project are the Project Name, Time Bound (Yes/No), Start and End Dates, Expected Hours, Complete (Yes/No), and Active (Yes/No). When the Submit button is pressed after making the necessary changes, the new changes are reflected for a specific project, as shown in Fig. 9.
Figure 10. Edit ProjectsEdit Time Tracker Entries.
[image:5.595.312.558.308.423.2]Figure 10 shows how time tracker entries can be edited or modified (i.e., how the start and end dates can be changed). Moreover, if the incorrect start and end dates are entered, then Incomplete Data Warning is showed—end date should be greater then start date, as shown in Fig. 11.
Figure 11. Edit ProjectsEdit Time Tracker EntriesIncomplete Data
Warning.
[image:5.595.39.286.329.575.2]C. Project Sheet Module
Figure 12. Project Sheet.
Figure 12 shows the total number of entries done for a specific project, which include the name of the user who entered the details, the From and To time, duration, allocated time, time consumed, percentage, and accessed time.
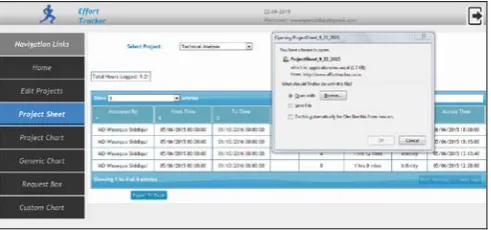
Figure 13. Project SheetExport to Microsoft Excel Sheet.
An important or unique feature included in the proposed system is the data entered for a software project can be exported to a Microsoft Excel sheet, which can be used for analysis at a later stage, as shown in Fig. 13.
[image:5.595.303.555.520.780.2] [image:5.595.37.561.524.785.2] [image:5.595.38.292.670.780.2]Figure 14. Project Chart.
The Project Chart module shows the graphical representation of a project. As the project name Technical Analysis was Time Bound (No) (i.e., Total Hours Logged: 0), there are no solid graphical lines shown (Fig. 14).
[image:6.595.42.287.55.131.2]E. Generic Chart Module
Figure 15 shows the generic/general chart (i.e., the pie chart) that shows data for all project names that are entered by different users. It also mentions the Total Hours Logged.
Figure 15. Generic Chart.
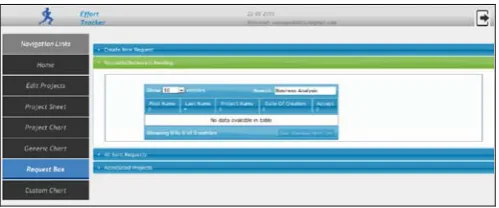
F. Request Box Module
This module is responsible for handling all requests that are sent by the users. This module is basically helpful for a software project manager or project leader or coordinator to keep a track of all pending or received requests. At the same time, the user can create a new request, as shown in Fig. 16.
Figure 16. Request BoxCreate New Request.
[image:6.595.309.559.105.209.2]The project manager/leader/coordinator can view pending or received requests (Fig. 17).
Figure 17. Request BoxRequests (Received or Pending).
[image:6.595.43.284.282.545.2]Figures 18 and 19 show All Sent Requests and Associated Projects, respectively. Here, the project manager/leader/coordinator can view all requests that are sent by his/her team members for a software project. Simultaneously, he/she can view related or associated projects for requests.
[image:6.595.309.557.320.540.2]Figure 18. Request BoxAll Sent Requests.
Figure 19. Request BoxAssociated Projects.
G. Custom Chart Module
Figure 20. Custom Chart.
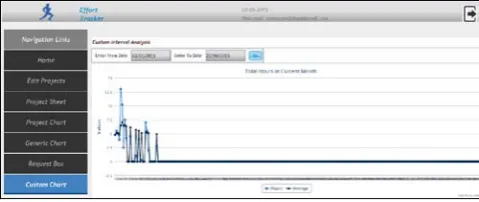
[image:6.595.310.555.579.697.2] [image:6.595.39.286.657.768.2]Figure 21. Custom chartCustom Interval Analysis.
In the above figure, the graph shows the total hours for a software project in a given time (i.e., for a period of eight months). It represents the statistical data on y axis and the total hours on x axis. The average numbers of hours are represented by dark blue and the hours are shown by light blue.
[image:7.595.42.282.54.155.2]Figure 22 shows the Custom Effort Distribution Analysis for all projects represented in the form of a pie chart.
Figure 22. Custom ChartCustom Effort Distribution Analysis.
IV. CONCLUSION
We have successfully developed a web-based automated time and effort tracking software for a software project that will track effort and time spent on a project and will help a company to better understand the productivity of an individual or team members in a project. This in turn will help the company’s manager to analyze resources to various projects and will also help to better understand and evaluate an individual’s or team performance. In future, we plan to integrate this software in biometric attendance system.
V. REFERENCES
[1] B. Peterson, “Best Practices for Time Tracking,” A Journyx White
Paper, pp. 1-14. Available online: http://www.rbryanpeterson.com/files/Best_Practices_for_Time_Tracking
.pdf.
[2] S. Gupta and N. K. Dokania, “Challenges and Implementation of Effort
[image:7.595.40.285.287.380.2]