International Journal of Research in Advent Technology, Vol.6, No.10, October 2018
E-ISSN: 2321-9637
Available online at www.ijrat.org
2669
Synthesis and characterization of Eu:CaTiO
3
nanopowder
by using sol-gel method
S. Anjelin Ursula Portiaa, K. Ramamoorthyb,*
a
Research scholar ofPhysics, Research and Development Centre, Bharathiar University, Coimbatore– 641046, India
b
Assistant professor of Physics, Govt. Arts & science College, Komarapalayam - 638183, India. E.mail: [email protected]
Abstract- The main work is to synthesize perovskite type of Eu doped CaTiO3 nanopowder using sol-gel method. The as-synthesized sample was characterized by various highly developed techniques. The Structural analysis was calculated by using X-ray Diffraction Method (XRD). The functional groups were examined by using Fourier Transform Infrared Spectrophotometer (FTIR). The Surface structure was examined by Scanning Electron Microscopy (SEM). The elemental configuration was calculated by Energy Dispersive X-Ray Spectroscopy (EDAX) . The optical property was obtained by Ultra - Violet visible Infrared Spectroscopy (UV-vis DRS), and the Microstructure analysis were performed by using high resolution transmission electron spectroscopy (HRTEM). This technique is suitable, low price, simple, and successful in comparison to the familiar methods of the synthesis of nanopowders.
Key words: nanopowder;, Eu:CaTiO3; sol-gel
1. INTRODUCTION
TiO2 has a broad variety of applications. They are UV filters for optics and packing equipment [1], humidity sensors [2], antireflection coatings for photovoltaic cells and passive solar collectors [3], transparent conductors [4], electro chromic displays [5], photo catalysts for refinement and treatment of water and air [6], gas sensors [7], anodes for lithium-ion batteries [8], and self cleaning coatings of windows and tiles [9], These oxides have some characteristics such as pyroelectrical, dielectrical, ferroelectric, photo restrictive, piezoelectric, magneto restrictive, and electro-optical characters [10, 11].
CaTiO3, being one of the member of perovskite Family. It has many usage such as dielectric resonators in wireless communication system [12], bio-medical, [13], equipment operating at microwave frequencies [14], photo catalytic [15] . Calcium Titanate doped with rare earth ions grant a variety of applications in the fields of opto-electronic devices [16-19].It has lot of attraction among the researchers because of their friendly environment ,luminescence properties and well- known chemical stability . They are used in field emission displays and white light emitting diode devices[19].
Number of methods have been suggested in literature for synthesizing Eu:CaTiO3 powders. This type of perovskite was initially equipped by solid
state reaction at room temperatures 1623k [20]. In this method we perceive a number of problem, such as in-homogeneity, high –processing temperatures and infectivity by impurities with a non uniform particle sizes allocation [21]. These troubles can be condensed by wet chemical methods. So wet chemical methods have been employed to synthesize CaTiO3 powders, such as ahydrothermalprocess[22], sol-gel[23], co-precipitation [24],organic-inorganic solution technique[25] and combustion method[26].The optical performance depends preparation method, structural organization and heat behavior conditions[27].
Sol-gel procedure is a positive method that offers relative low price, uniform, and high clarity of the ceramics. In the present study, we have reported about the Eu:CaTiO3 nanopowder synthesized by using sol-gel technique. The sample was analyzed by using XRD, FTIR, SEM , EDAX, UV and HRTEM
2. EXPERIMENTAL SECTION
2.1 Materials used
International Journal of Research in Advent Technology, Vol.6, No.10, October 2018
E-ISSN: 2321-9637
Available online at www.ijrat.org
2670 2.2 Sample preparation
The sample were synthesized by using sol-gel method. For this synthesis a solution of Ca: Ti: Citric acid: ethanol mole ratio 0.8: 1: 1:1 was magnetic stirred for an hour. After that 0.2 mole of Eu2O3 solution was prepared by adding Eu2O3 to a 10:1 mixture of ethanol and HNO3 and stirred for 1 hour. Then both the solutions were added and allowed to stir and evaporated at 70oC for 2 hours. Then it was dried in a hot plate for overnight and the solvent was removed by heating to at 100oC. The resulting powder was annealed at different temperatures like 500oC , 700oC and 900oC for 2 hours in a muffle furnace. Then the as-synthesized samples were crushed in to powder to form Eu:CaTiO3 nanopowder.
2.3 Characterization of Eu : CaTiO3 nanopowder The as-synthesized Eu : CaTiO3 samples were characterized by various superior techniques. The Structural analysis were monitored by X-ray Diffractometry (XRD) in the 2Ө range from 5◦ to 90◦ .The FTIR micro-analysis were carried out and it covers the range of wavenumbers from 400 to 4000 cm-1. The Surface Morphology were measured using Scanning Electron Microscopy (SEM). The Composition was studied using Energy Dispersive X-Ray Spectroscopy(EDAX), The Optical band gap was recorded using Ultra - Violet visible Infrared Spectroscopy (UV-Vis) from 200-900 nm, and the Microstructure investigation were analyzed by using High Resolution Transmission Electron Spectroscopy(HRTEM).
3. RESULTS AND DISCUSSIONS
3.1 X-ray diffraction analysis
The structure and crystallite size was investigated by X-ray diffraction (XRD) using Bruker diffractometer within the 2θ range of 5◦ to 90◦ using CuKα as X-ray source (λ=1.5406Å). The following calculations were done.The particle size of the nanopowder was calculated based on Scherer’s equation [28], the Scherrer’s equation is described as
(nm) ---Eq.(1)
Where, D : mean crystallite size, K : shape factor taken as 0.94, λ : wavelength of the incident beam, β : full width at half maximum and θ : Bragg angle. The Dislocation density is calculated by:
lines/m2 ---Eq.(2) The strain is calculated by using the equation:
---Eq.(3)
The Micro strain is calculated by using the equation:
[image:2.612.327.573.159.588.2]
√ ---Eq.(4)
Table 1: Parameters of Eu doped CaTiO3 nanopowder in a sol-gel method
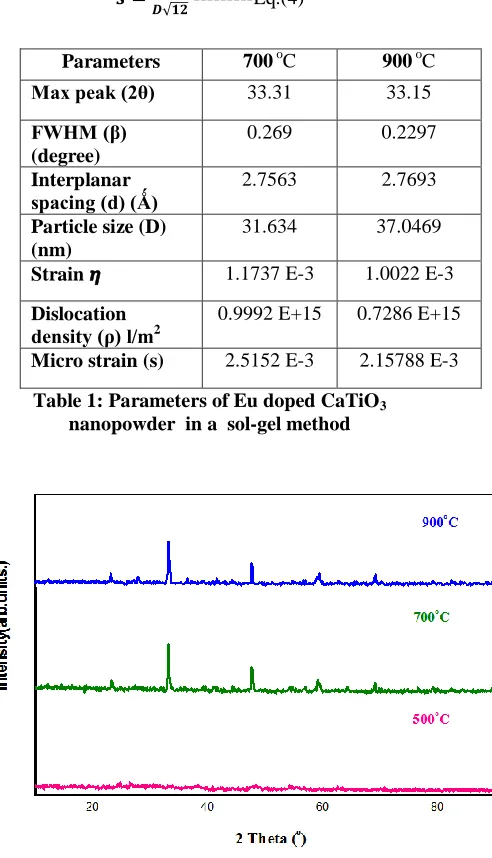
The increase of temperature leads to the CaTiO3 phase. Comparing the annealing temperature, at 900oC the sample displayed a superior crystallization. Above 1580 oC the formation of CaTiO3 is Cubic ,amid 1500 oC to 1580 oC it is tetragonal, below 1500 oC it is orthorhombic[29,30]. All the peaks can be assigned to the orthorhombic
Parameters 700 oC 900 oC
Max peak (2θ) 33.31 33.15
FWHM (β) (degree)
0.269 0.2297
Interplanar
spacing (d) (Ǻ) 2.7563 2.7693
Particle size (D) (nm)
31.634 37.0469
Strain 1.1737 E-3 1.0022 E-3
Dislocation density (ρ) l/m2
0.9992 E+15 0.7286 E+15
Micro strain (s) 2.5152 E-3 2.15788 E-3
Fig.1. XRD pattern of Eu:CaTiO3nanopowder
International Journal of Research in Advent Technology, Vol.6, No.10, October 2018
E-ISSN: 2321-9637
Available online at www.ijrat.org
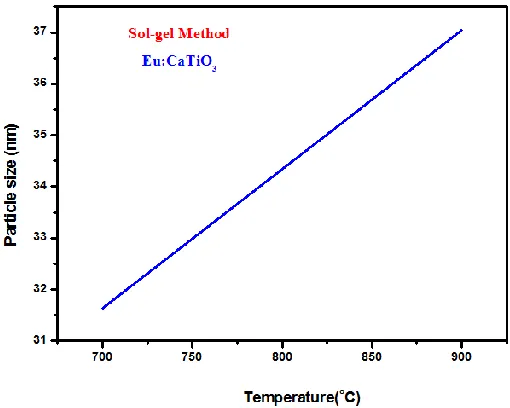
2671 organization is shown in fig.1 . Increase of
temperature cause an increase in the particle size is shown in fig.2. This performance can be linked with
[image:3.612.305.587.204.600.2]the aggregates making and nuclei formation [31] . CaTiO3 phase was conformed by the comparison between the XRD patterns with the JCPDS card no. 88-0790.
Table 2: Lattice Parameters of Eu:CaTiO3 nanopowder synthesized by sol-gel method.
3.2 FTIR Analysis
FTIR analysis were performed for the powder sample annealing temperature at 900 oC . Fig.3 shows the FTIR spectra of Eu:CaTiO3 nanopowder prepared by sol-gel method.Table 3 gives the FTIR analysis of Eu :CaTiO3 nanopowder. The band at 3377.26cm-1 was related to the super position of the vibration band of the hydroxyl group and the stretching vibration of the adsorbed water molecule. The C-H stretching band is occurred at 2924.78cm-1 . The COOH stretching band is occurred at 2856.07cm-1 . The C ≡ C stretching band is occurred
at 2264.99cm-1 The band at 1633.23 cm-1 are due to symmetric stretching vibrational modes of metal-oxygen bond. The C-H bending band is occurred at 1384.79cm-1 The C-O stretching band is occurred at 1118.59cm-1 and 1066.88 cm-1 .A band around 571.90cm-1 and 430.24cm-1 are caused by stretching vibration due to interactions produced between the oxygen and the metal bonds..
Table 3 FTIR analysis of Eu :CaTiO3 nanopowder prepared by sol-gel method
3.3 Surface morphology analysis
Fig.4 shows the SEM analysis of Eu : CaTiO3 nanopowder synthesized by sol-gel method. The product show foamy and porous with agglomerated particles. The particles are nearly spherical in shape. Lattice
parameters
JCPDS (88-0790)
700oC 900 oC
a (Å) 5.378 5.5126 5.5380
b(Å) 5.444 5.6105 5.50412
c(Å) 7.637 7.8213 7.8244
Wave number
cm-1
Functional group
Types of vibrations
Intensity Class of Compounds
3377.26 O-H Stretching, H-bonded
Strong, Broad
Alcohols
2924.78 C-H Stretching Strong Alkane 2856.07 COOH Stretching Strong Enols 2264.99 C ≡ C Stretching Variable Alkynes 1633.23 C=C Stretching Variable Alkenes
1384.79 C-H Bending Strong Methyl
groups 1118.59 C-O Stretching Strong Carbonyl
groups 1066.88 C-O Stretching Strong Carbonyl
[image:3.612.50.305.309.513.2]groups 571.90 C-Cl Stretching Strong Alkyl Halide 430.24 C-Cl Stretching Strong Alkyl Halide Fig.2.Particle sizes as a function of heat treatment of
[image:3.612.317.588.392.598.2]Eu:CaTiO3 nanopowder synthesized by sol-gel method
Fig.3 . FTIR spectra of Eu : CaTiO3 nanopowder prepared by sol-gel method
FTIR-A6-Name Description
4000 3500 3000 2500 2000 1500 1000 500400
100
0 10 20 30 40 50 60 70 80 90
cm-1
%T
571.90cm-1 2264.99cm-1
2924.78cm-1 2856.07cm-1 3377.26cm-1
1633.23cm-1 1384.79cm-1
430.24cm-1 1118.59cm-1
International Journal of Research in Advent Technology, Vol.6, No.10, October 2018
E-ISSN: 2321-9637
Available online at www.ijrat.org
2672 The introduction of Eu ions does not change the
CaTiO3 morphology.
3.4 Energy dispersive x-ray spectroscopy analysis The EDAX measurement of the Eu : CaTiO3 nanopowder prepared by sol-gel method is shown in Fig.5. The EDAX examination indicated that the nanostructures are composed of Ca, Ti, Eu and O atoms and it exhibits clear peaks of only Ca, Ti, Eu and O elements, whereas no additional peaks were established, which means that the Eu :CaTiO3 powder is exempted from impurities.
Table 4 shows that the atomic and weight percentage of Eu doped CaTiO3 powder prepared by sol-gel method.
Table 4 : EDAX analysis of Eu : CaTiO3 nanopowder prepared by sol-gel method
Element Series Weight % Atomic %
O K 44.17 70.47
Ca K 17.97 13.07
Ti K 35.02 15.98
Eu L 2.84 0.48
[image:4.612.53.293.138.706.2]Fig.4 .SEM analysis of Eu :CaTiO3 nanopowder prepared by sol-gel method
[image:4.612.320.582.230.451.2] [image:4.612.320.544.610.673.2]International Journal of Research in Advent Technology, Vol.6, No.10, October 2018
E-ISSN: 2321-9637
Available online at www.ijrat.org
2673 3.5 Ultra - violet visible infrared spectroscopy
analysis
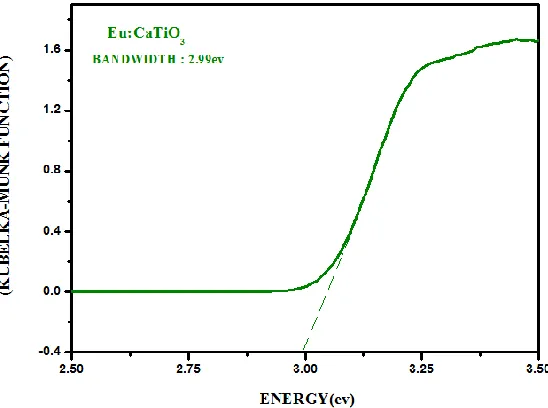
The optical properties of Eu:CaTiO3 nanopowder prepared by sol-gel method was analyzed by UV-VIS diffusion reflectance spectroscopy in the wavelength range of 200 – 900 nm.
UV absorption spectra of Eu :CaTiO3 nanopowder was obtained from the diffuse reflectance data by using the Kubelka-Munk function[32]. The optical band gap energy was 2.99ev corresponds to optical absorption edge of 381 nm . Fig .6. shows the Optical band gap calculation of Eu:CaTiO3 nanopowder
3.6 High resolution transmission electron
microscopy
The microstructure of Eu :CaTiO3 nanopowder prepared by sol-gel method was examined by HRTEM. Fig 7a is the high –resolution image of Eu :CaTiO3 nanopowder which exhibits the clear lattice fringes. The interlayer spacing 0.15nm is corresponds to (204) plane of CaTiO3.
[image:5.612.345.576.102.749.2]Fig.7b shows the selected area electron diffraction (SAED) pattern of Eu :CaTiO3 nanopowder calcined at 900oC. The circular bright continuous rings in the SAED pattern reveals the fact that particles where nanosized and confirmed the crystalline nature of nanopowder. Fig.7c shows the grains of the of Eu :CaTiO3 nanopowder look like sphere.
Fig .6. Optical band gap calculation of Eu :CaTiO3
nanopowder prepared by sol-gel method
a
b
c
[image:5.612.30.304.282.486.2]International Journal of Research in Advent Technology, Vol.6, No.10, October 2018
E-ISSN: 2321-9637
Available online at www.ijrat.org
2674
4. CONCLUSION:
Eu:CaTiO3 nanopowder prepared by using sol-gel method at low temperature calcinations . The sample was characterized by various advanced techniques. Particles were sphere-shaped and the Particle size was from 31-37nm, and the lattice parameters are a=5.523(Å), b=5.607(Å), c=7.8013(Å). The band width is 2.99ev. The interlayer spacing 0.15nm is corresponds to (204) plane of CaTiO3. The functional group, surface morphology and compositional analysis were carried out using FTIR,SEM and EDAX respectively.
REFERENCE
[1] Ivanova T, Harizanova A, Surtchev M, Nenova Z (2003) Investigation of sol–gel derived thin films of titanium dioxide doped with vanadium oxide. Sol Energy Mater Sol Cells 76:591–598.
[2] Su PG, Huang LN (2007) Humidity sensors based on TiO2 nanoparticles/polypyrrole composite thin films. Sens Actuators B Chem 123:501–507
[3] Shan MN, Wang SS, Bian ZQ, Liu JP, Zhao JL (2009) Hybrid inverted organic photovoltaic cells based on nanoporous TiO2 films and organic small molecules. Sol Energy Mater Sol Cells 93:1613–1617.
[4] Lansaker PC, Backholm J, Niklasson GA, Granqvist CG (2009) TiO2/Au/TiO2 multilayer thin films: novel metal-based transparent conductors for electrochromic devices. Thin Solid Films 518:1225–1229.
[5] Toma SH, Toma HE (2006) Versatile electrochromic displays based on TiO2 nanoporous films modified with triruthenium clusters. Electrochem Commun 8:1628–1632 [6] Ao CH, Lee SC (2005) Indoor air purification by
photocatalyst TiO2 immobilized on an activated carbon filter installed in an air cleaner. Chem Eng Sci 60:103–109
[7] Mohammadi MR, Fray DJ (2007) , Semiconductor TiO2–Ga2O3 thin film gas sensors derived from particulate sol–gel route. Acta Mater 55:4455–4466
[8] He BH, Dong B, Li HL (2007) Preparation and electrochemical properties of Ag-modified TiO2 nanotube anode material for lithium–ion battery. Electrochem Commun 9:425–430
[9] Yuranova T, Mosteo R, Bandara J, Laub D, Kiwi J (2006) Selfcleaning cotton textiles surfaces modified by photoactive SiO2/TiO2 coating. J Mol Catal A Chem 244:160–167
[10]Montenero A, Canali M, Gnappi G, Bersani D, Lottici PP,Nunziante P, Traversa E (1997) Structural and electrical properties of sol-gel processed CdTiO3 powders and films. Appl Organomet Chem 11:137–146
[11]. Zhang X, Wang H, Huang A, Xu H, Zhang Y, Yu D, Wang B,Yan H (2003) Synthesis of cadmium titanate powders by a solgel- hydrothermal method. J Mater Sci 38:2353– 2356
[12]S.Y. Lee, M.C.C. Custodio, H.J. Lim, R.S. Feigelson, J.P. Maria, S. Trolier- McKinstry, J. Cryst. Growth 226 (2001) 247.
[13]Stanishevsky AV, Holliday S (2007) Mechanical properties of sol–gel calcium titanate bioceramic coatings on titanium. Surf Coat Technol 202:1236–1241
[14]Kim JS, Cheon CI, Kang HJ, Lee CH, Kim KY, Nam S, Byun JD (1999) Crystal structure and microwave dielectric properties of CaTiO3– (Li1/2Nd1/2)TiO3–(Ln1/3Nd1/3)TiO3 (Ln = La, Dy) ceramics. Jpn J Appl Phys 38:5633– 5637
[15]Zhang D, Zhang CL, Zhou P (2011) Preparation of porous nano calcium titanate microspheres and its adsorption behavior for heavy metal ion in water. J Hazard Mater 186:971–977
[16]P. Boutinaud, E. Tomasella, A. Ennajdaoui, R. Mahiou, Structural characterization and luminescent properties of CaTiO3:Pr3þ thin films deposited by radio frequency sputtering, Thin Solid Films 515 (2006) 2316-2321 [17] A.T. de Figueiredo, V.M. Longo, S. de Lazaro,
V.R. Mastelaro, F.S. De Vicente, A.C. Hernandes, et al., Blue-green and red photoluminescence in CaTiO3:Sm, J. Lumin 126 (2007) 403-407.
[18]P.J. Dere_n, R. Mahiou, R. Pa˛ zik, K. Lemanski, W. Stre˛ k, P. Boutinaud, Upconversion emission in CaTiO3:Er3þ nanocrystals, J. Lumin 128 (2008) 797-799. [19] B. Marí, K.C. Singh, P. Cembrero-Coca, I.
Singh, D. Singh, S. Chand, Red emitting MTiO3 (M ¼ Ca or Sr) phosphors doped with Eu3þ or Pr3þ with some cations as co-dopants, Displays 34 (2013) 346-351.
[20] H.F. Kay, P.C. Bailey, Structure and properties of CaTiO3, Acta Cryst. 10 (1957) 219–226. [21] I.R. Evans, J.A.K. Howard, T. Sreckovic, M.M.
International Journal of Research in Advent Technology, Vol.6, No.10, October 2018
E-ISSN: 2321-9637
Available online at www.ijrat.org
2675 [22] T.R.N. Kutty, R. Vivekanandan, P. Murugaraj,
Precipitation of rutile and anatase (TiO2) fine powders and their conversion to MTiO3 (M= Ba, Sr, Ca) by the hydrothermal method, Mater. Chem. Phys. 19 (1988) 533–546.
[23]G. Pfaff, Synthesis of calcium titanate powders by the sol–gel process, Chem. Mater. 6 (1994) 58–62.
[24]X. Zhang, J. Zhang, X. Ren, X.-J. Wang, The dependence of persistent phosphorescence on annealing temperatures in CaTiO3:Pr3+ nanoparticles prepared by a coprecipitation technique, J. Solid State Chem. 181 (2008) 393–398.
[25]S.J. Lee, Y.C. Kim, J.H.Hwang, An organic– inorganic solution technique for fabrication of nano-sized CaTiO3 powder, J. Ceram. Process. Res. 5 (2004) 223–226.
[26]M. Muthuraman, K.C. Patil, S. Senbagaraman, A.M. Umarji, Sintering, microstructural and dilatometric studies of combustion synthesized synroc
phases, Mater. Res. Bull. 31 (1996) 1375– 1381.
[27]L.S. Cavalcante, M.F.C. Gurgel, E.C. Paris, A.Z. Sim˜oes, M.R. Joya, J.A. Varela, P.S.Pizani, E. Longo, Combined experimental and theoretical investigations of the photoluminescent behavior of Ba(Ti, Zr)O3 thin films, Acta Mater. 55 (2007) 6416–6426. [28]C. Suryanarayana, M.G.Norton, X-Ray
Diffraction: A Practical Approach, Plenum Press, New York, 1998.
[29]Jianhua Hao, Weidong Si, X. X. Xi, Ruyan Guo, AS. Bhalla, LB. Cross, Applied Physics
Letters, 76 (21), 3100(2000).
[30]H. Veenhuis, T. Borger, K. Peithmann, M. Flaspohler, K. Buse, R. Pankrath, H.Hesse, E.
Kratzig, Appl. Phys. B 70,797 (2000) [31]G. Zhou, M. L ¨ u, F. Gu, D. Xu, D. Yuan, J.
Cryst. Growth 276 (2005) 577–582
[32] Phosphor Handbook edited under the