3398
Building Detection Using Enhanced HOG– LBP
Features and Region Reinement Processes Using SVM
Harisa Firdose, G.C Sathish
Reva University, Bangalore
Abstract-Building revelation from two-dimensional high-resolution satellite pictures is a PC vision, photogrammetry, and remote identifying errand that has developed in the latest decades with the advances in sensors advancement and can be utilized as a part of a couple of utilizations that require the arrangement of urban maps or the examination of urban changes. Regardless, the collection of insignificant articles that appears in an urban space and takes after structures, and the significant assortments in the shape and generally the nearness of structures render building area an exceptionally asking for errand. In this way, motorized systems that can energetically recognize structures in satellite pictures are vital. To this end, we propose a building area system that includes two modules. The first module is a part discoverer that concentrates histograms of oriented gradients (HOG) and Local binary pattern (LBP) from picture regions. Utilizing a novel approach, a support vector machine classifier is prepared with the presentation of an uncommon de-noising separation measure for the estimation of divisions between HOG– LBP descriptors before their classification to the building or non-building class. The second module involves a plan of region refinement frames that utilize the yield of the HOG– LBP finder as recognized rectangular picture zones. Image segmentation is performed and a novel building acknowledgment philosophy is proposed to precisely recognize building areas, while all the while dispose of bogus recognitions of the first module of the proposed procedure. We demonstrate that the proposed technique can healthily recognize structures from satellite pictures and out performs cutting edge building location methodologies.
Index Terms—Buildings, Feature extraction, image segemntation, satellite applications, vegetation, water.
1. INTRODUCTION
The presence of the primary satellite pictures has made the earth cover characterization a broadly contemplated field. The sensors appended to satellites have developed in the previous two decades, in a way that these days permit the catch of high-determination multispectral satellite pictures. This innovative progress made the arrangement of formation, discovery and other man-made structures from satellite pictures conceivable. Building identification from satellite pictures can discover convenience in a few remote-detecting applications, for example, city arranging, urban mapping, and urban change location. The information of building areas can be demonstrated profitable to districts in their endeavors to help, secure, and ensure their residents, while unlawful building construction exercises can without much of a stretch be identified and restricted. Besides, urban development or decay can be contemplated and connected to climatic changes and social, financial, or regular factors, and proper measures and safeguards can be taken to guarantee human thriving.
Regardless of the way that building area can be expert physically by human authorities, the repetitiveness of the system and the speed with which show day urban groups expand make the progression of customized developing disclosure figuring’s fundamental. Manufacturing recognizable proof from two-dimensional (2– D) multispectral pictures has woefully become a great degree troublesome errand. It is difficult to recognize the structures that appear in changed sizes and shapes makes the headway of a comprehensive approach. There can even be spooky or surface assortments in a comparable rooftop as the building
roof tops in an urban space may move appallingly. The way that reasonably objects, for instance, trees and greater structures, can obstruct little structures, which makes difficult in identifying the buildings. Building distinguishing proof technique is effected by atmosphere conditions and sun zone can genuinely impact the idea of a satellite picture. By introducing exact and more information rich data, the existence of high-assurance multispectral pictures allows a lift in the heaviness of building disclosure it in like manner raises a hell in the treatment of such gigantic measure of data. As needs be, the change of effective, exact, and computationally snappy building recognizable proof methodologies is of focal noteworthiness.
Utilizing an assortment of strategies we accomplish building discovery from 2– D pictures, Building can be portrayed as a question depicted by particular highlights or geometric properties or as a gathering of pixels sharing some normal properties. Structures are separated by the pixel-based strategy by fittingly grouping picture pixels into homogeneous areas. An outline of the most prevalent among these strategies takes after. A dynamic form calculation was proposed by L. Theng [1] to portion structures from foundation. Roundabout cast calculation [1] made the introduction of the dynamic shape calculation.
3399 D. Singh et al. [3] proposed "Building extraction from
high determination multispectral pictures utilizing NDVI
based division and morphological administrators,"
Construction of a vitality work is frequently hard or even difficult to that can portray each working in a urban region, because of shading and shape varieties structures illustrate. A few different philosophies take advantage of the standardized contrast vegetation record (NDVI) to isolate man-made items from vegetation as in our approach. NDVI was utilized by Singh et al. to evacuate vegetation and sifted the rest of the picture areas to keep just those with sizes in a range proficient to speak to building competitors.
"Assessment of programmed assembling location
approaches consolidating high determination pictures and LiDAR information", was proposed by T. Hermosilla et al. [4] for the technique was taken after with the expansion of a question based characterization system after the vegetation expulsion to separate blobs that have a place with structures from blobs that don't. In view of the blend have scale-invariant element change key focuses and diagram hypothesis Sirmacek and Unsalan [5] included a building discovery strategy. Then again, to describe structures question based techniques distinguish remove shapes or highlights from a picture. To recognize urban zones and diagram cuts they utilized sub chart coordinating to distinguish isolate structures in a urban encompassing.
"A probabilistic structure to recognize structures in aeronautical and satellite pictures," was proposed by B. Sirmacek and C. Unsalan [6] in another work, similar creators built up a strategy to separate corners inclination greatness based help areas (GMSR) from satellite and elevated pictures and [Harris, highlights from quickened portion test (FAST)], Gabor highlights. They combined those utilizing information and choice combination plans to find building focuses and processed the piece thickness estimation of these highlights. P. Hough [7] proposed "Strategy and means for perceiving complex examples", in a few investigations, lines turned out to be noteworthy highlights for the assignment of building identification. Lines can either be found by Hough change or by recognizing edges and framing edge chains. T. Kim and J. Muller [8] proposed "Advancement of a chart based approach for building recognition". Edge ties were utilized to recognize lines, which were utilized at a later stage to shape building competitors.
D. Haverkamp [9] proposed "Programmed constructing extraction from IKONOS symbolism", rectangles were shaped and the missing lines surmised. In this approach another building location technique in light of line gathering was endeavored here. D. Charm et al. [10] proposed "Building location and remaking from aeronautical pictures", to frame building theory the creators joined line gathering and corner marking. D. Charm et al. [11] proposed, in particular formats, Parameterized shapes, are utilized to tackle the assignment of building discovery as an elective way that is utilizes deformable layouts of discretionary scale and introduction to fit with the blobs extricated in the wake of applying a tallness limit to an advanced height show. Karantzalos and Paragios [12]
proposed consolidated a level-set division way to deal with achieve building division in urban zones that is driven by 2– D shape priors. The presentation of shape formats was exhibited in an information driven approach could enhance the building discovery comes about.
O. Benarchid et al.[13] proposed "Building extraction utilizing object-based order and shadow data" in high determination multispectral pictures, a contextual analysis: Tetuan, Morocco", in a few building recognition strategies shadow identification has additionally been consolidated, as an approach to mean the presence of tall structures, which can be competitor structures. Nonetheless, By the situation of sun the time the picture is caught will essentially influence the shadow recognition procedures. S. Kluckner and H. Bischof [14] proposed "Picture based building grouping and 3d displaying with super-pixels", The utilization of machine learning strategies was shone by the advances in the field of manmade brainpower to take care of the issue of building discovery. Super pixels can frame the littlest groups of pixels with comparable multispectral data. A. Shackelford and C. Davis [15] proposed "A joined fluffy pixel-based and question based approach for arrangement of high-determination multispectral information over urban regions", the creators to name super pixels and frame building applicants utilized Conditional arbitrary fields. A pixel-based fluffy classifier was utilized to mark pixels in a multispectral picture and an area blending division method to part a picture into significant dis-joint arrangements of pixels. A short time later, to gather the limits of the recognized building they utilized polygon guess and skeletonization techniques.
[image:2.595.319.561.510.703.2]Z. Sheng-hua et al. [16] proposed "another strategy for building location from a solitary aeronautical photo," Similarly, To recognize structures in an elevated picture the surface and line highlights was utilized with the deduction
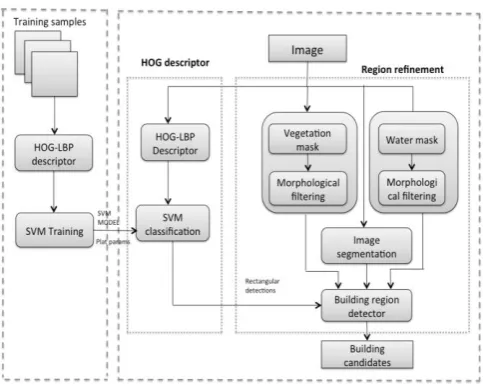
Fig 1: Block diagram of SVM Technique.
3400 meta-layer fluffy classifier and prepared a base-layer fluffy
classifier for each element. Chai et al. [18] utilized a Markov irregular field (MRF) for low-level demonstrating of unearthly information and checked point forms for abnormal state displaying of structures. They improved the outcomes utilizing reenacted toughening so as to section structures from the foundation by consolidating these models. O. O. Karadag et al. [19] proposed "Division combination for building identification utilizing space particular data," information particular that was separated by the MRF system to the specific appearance of structures, for example, shadow, rectangularity, and vegetation, was additionally utilized into building recognition.
At long last, Femiani et al. [20] exploited vegetation limitations and shadow data to drive a diagram cut calculation toward an effective building division. N. Dalal and B. Triggs et al. [21] "Histogram of situated angles with the end goal of Human recognition" In a thick system, the procedure relies upon surveying all around institutionalized neighborhood histograms of picture slant presentations. A settled course of action of 12180 patches tried erratically from 1218 man free getting ready photos gave the basic negative set. A preliminary identifier is set up for each locator and parameter mix and the 1218 negative getting ready photos are chase exhaustively down false positives. On the off chance that vital, The game plan of hard delineations is subsampled so the descriptors of the last getting ready set fit into 1.7 Gb of RAM for SVM planning. The execution of each pointer is on a very basic level upgraded by this retraining technique. Indeed, even the little upgrades in miss rate are equivalent to huge grabs in FPPW at enduring miss rate as the DET twists are regularly extremely shallow.
2. PROPOSED METHODOLOGY
The proposed approach can be part in two modules: the HOG– LBP marker and the region refinement framework. The HOG– LBP locator is used both in the arrangement and in the testing time of the computation. HOG– LBP descriptors are expelled from the arrangement pictures and used for the readiness of a SVM show using the cosine-based partition work. Perfect Platt parameters are in like manner gotten the hang of in the midst of the arrangement stage to change the SVM respects probabilities. In the testing stage, HOG– LBP descriptors are gained from rectangular regions through thick inspecting of a photo and are organized in two classes, specifically the building and non-building class. The region refinement strategy is used just in the testing stage and is stressed over the division of an attempted picture, the figuring of the vegetation and
water covers, and the improvement of the last building zone candidates by picking the destined to contrast with a building picture locale for each positive HOG– LBP rectangular revelation. The proposed framework depicted rapidly above is presented in Fig. 1.1, where the two modules close by their amidst affiliation are appeared.
The testing times and the course of action of the calculation are moreover delineated.
A. HOG-LBP DETECTOR MODULE
The calculation of the HOG– LBP building indicator is clarified in detail in this segment. Contentions are introduced for its utilization as apiece for the SVM classifier in he cosine-based separation work is investigated the execution of the proposed. By the presentation of another edge and by utilizing the Platt scaling HOG– LBP building indicator is progressed.
1) HOG– LBP Descriptor: First presented in a picture [22] as a way to distinguish people on foot and is a fruitful and strong component vector. It is chosen as an appropriate detector for building displaying and location in view of its predominant discriminative power. In a picture locale the HOG locator is figured that is additionally separated into rect-precise sub areas, which are called cells. A 1– D histogram of the introductions of the power slopes exhibit inside the cell is figured in every cell. The created HOG locator can separate picture districts that contain structures from those that don't as the parameters that influence the calculation of the HOG histograms can be ideally chosen.
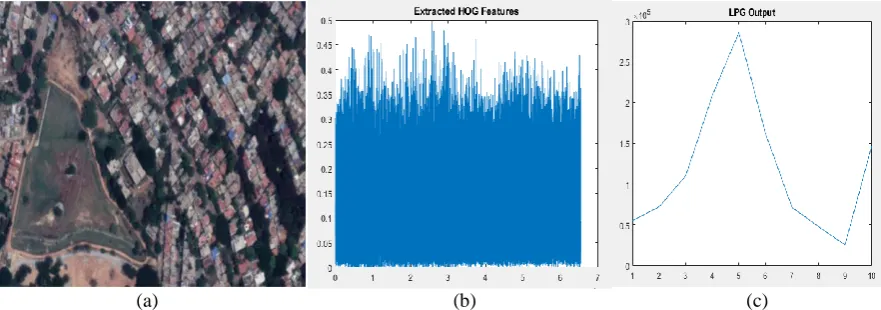
3401 (a) (b) (c)
Fig. 2. (a) Original Image (b) Extracted HOG Features (c) LBP Feature Vector Fig 2(b) shows that with the end goal of question identifier it
is an element locator utilized as a part of PC vision and picture handling. Events of slope introduction in limited parts of a picture are checked by the method. Edge introduction histograms are like this strategy, scale-invariant component change descriptors, and shape settings, distinction is in processing on a thick lattice of consistently separated cells and covering neighborhood differentiates
standardization for enhanced exactness is utilized and in fig 2(c) The LBP Feature vector, in this figure, is in its least difficult shape, is made in the accompanying way:
- Windows are divided into cells (e.g. every cell in 16x16 pixels).
- Contrast the pixel with every one of its 8 neighbors for every pixel in a cell. Take after the pixels along a circle.
- Neighbor's esteem when the middle pixel's esteem is more prominent, state "0". Else, express "1". This gives an 8-digit twofold digit.
- Cipher the histogram, over the phone, of the continual of each "value" happening. This histogram can be viewed as a 256-dimensional element vector.
- Standardize the histogram.
- Sequence histograms of all cells, which give a component vector for the whole aperture.
- The include vector would be able to be prepared utilizing the Support vector machine, outrageous learning machines, or some other machine-learning calculation to characterize pictures. Such classifiers can be utilized for confront acknowledgment or surface investigation.
B. REGION REFINEMENT MODULE
By utilizing an unsupervised pixel grouping procedure he picture is at first split in homogeneous locales. By utilizing surely understood vegetation and a novel water file, separately vegetation and water veil are additionally extricated. We can at a later stage dispose of building locales with a lot of pixels marked as either vegetation or water by recognizing vegetation and water. To derive the most plausible to speak to structures picture locales. We exploit the yield of the HOG– LBP locator. To frame the last building competitors these underlying building hopefuls are handled.
1) Vegetation Mask: To extricate vegetation in multispectral pictures is the NDVI list it is a standout amongst the most exact and understood strategies, which has been effectively connected as a marker of vegetated regions in various remote-detecting applications. To distinguish where vegetation exists, the preferred standpoint is taken from this list by the close infrared (NIR) band that most satellites give. The utilization of NDVI depends on the way that light is preferable ingested from vegetation over man-made
structures. For vegetated locales and low positive or negative qualities for non-vegetated zones. Thusly, this file delivers high positive qualities. Utilizing the NIR and red approach as demonstrated as follows, where ρNIR and ρR are the NIR and red channels, NDVI is figured.
NDVI =
[image:4.595.81.522.100.255.2]
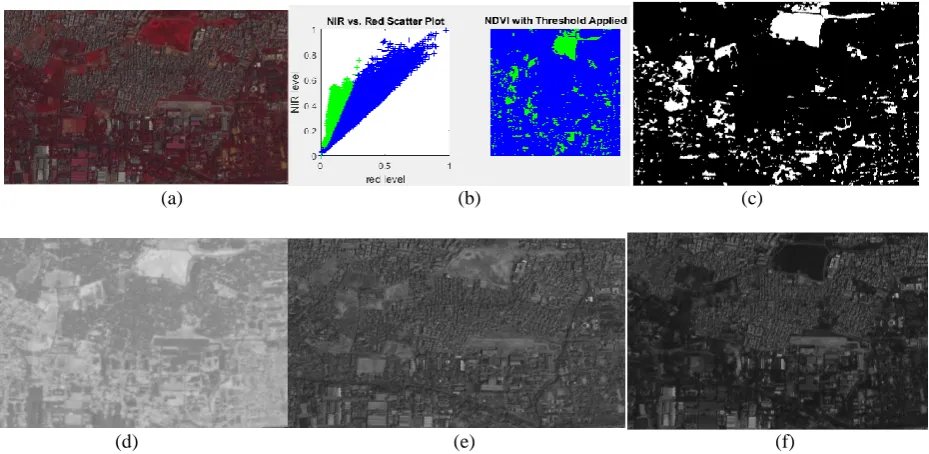
3402 (a) (b) (c)
(d) (e) (f)
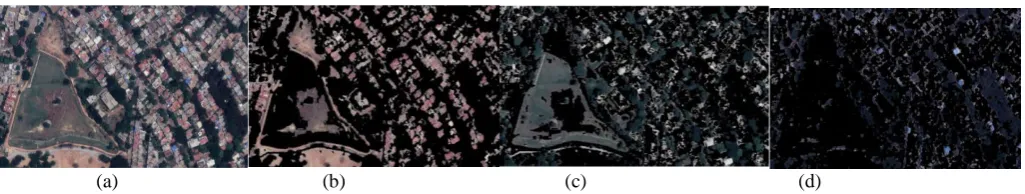
Fig. 3. (a) Original Image. (b) NIR vs. Red Scatter Plot and NDVI with Threshold Applied. (c) Image obtained after applying NDVI with threshold. (d) Normalized Difference Vegetation Index. (e) Near Infrared Band. (f) Visible Red Band.
In Fig 3(b) There is a great deal of interest about near-infrared, both from a scientific and artistic perspective. Here are some applications that use NIR signal obtained from a digital camera.In photography proper, NIR delivers sharp images with sometimes a dramatic outlook. Indeed, sky and water are black, clouds stay white, and vegetation becomes very bright. The reason for these differences with the visible are, very diverse. In vegetation this is due to the cellular structure of the leaves; water absorbs near-infrared radiation; clouds are composed of droplets that scatter incoming light according to Mie's law (the angle of scattering is independent of the wavelength); sky is dark for the same reason it is blue: very small particles scatter light but the scattering angle is proportional to the inverse fourth power of the wavelength (Rayleigh scattering), thus blue is the most scattered and near-infrared the least. Rayleigh scattering is also the reason why, in landscape images, distant objects become blurred and have a blue colour cast. This phenomenon, atmospheric haze, is almost absent from near-infrared images, yielding haze-free images that have a larger optical depth. In Fig 3(c) Imaging systems may be provided with image sensors for capturing information about incident light intensities in the visible and infrared bands of light. The means of capturing information about visible light may be unintentionally and undesirably influenced by infrared light. Similarly, the means of capturing information about infrared light may be unintentionally and undesirably influenced by visible light. Storage and processing circuitry may correct for the undesired influence of infrared and visible light on the signal data from the visible and infrared sensors, respectively. The correction may be determined or chosen based on a detection of the illuminant type of the imaged scene. The correction may alternatively be universal, and applicable to images of scenes illuminated by any illuminant. In Fig 3(d) The portion of the electromagnetic
spectrum perceived by the human visual system is generally called the "visible spectrum" and ranges from (about) 380 to 700 nanometres in wavelength. The near-infrared spectrum is located just after the red wavelength and comprises wavelengths that range from 700 to 1100 nanometres. Even though the NIR band is located next to the visible one, there is, in general, almost no correlation between a visible and NIR signal (i.e., knowing the colour and brightness of an object gives no information about its NIR response). In Fig 3(e) In this figure, carefully choosing dyes also allows one to design warmer, or cooler, clothing. Everyone knows that, in the sunshine, a black garment is warmer to wear because it absorbs the sunlight, but this is true only to an extent. The black dye absorbs (with certainty) the part of the sun light that is emitted in the visible spectrum. The sun having a significant emission in the near-infrared, there can thus be a large difference in how warm a black item feels depending on its NIR absorption. In Fig 3(f) In this figure, while the human visual system is unable to capture near-infrared radiation, a camera can. Near-infrared films have been produced by a number of manufacturers but their use has always been limited to enthusiasts because of the precautions needed in operating them as well as the very long exposure times needed (up to a minute depending on the environment). Digital cameras on the other hand have silicon-based sensors that are very sensitive to NIR
[image:5.595.70.535.99.326.2]3403 bodies and the expulsion of swimming pools can prompt
false alert diminishment of a building identification approach. The standardized distinction water list can normally be connected that can separate the water class from different classes. The NDWI record is figured utilizing the green and NIR channels as demonstrated as follows, where ρtt and ρNIR are the green and NIR approach, separately:
NDWI =
Pixels with NDWI esteems over that limit can be marked, as water and a low positive edge, for example, 0.3, can be set. As there is pixels that don't have a place with water pools yet are erroneously perceived all things considered, we saw that a solitary edge couldn't work in specific pictures of our dataset. Moreover, the outcomes uncovered that it couldn't adequately separate the water and no water estate; the same sum of non-water pixels is distinguished to have a place with the water class, when we tried Otsu thresholding of the NDWI veil. We trust this happens on the grounds where water pixels are generally excessively very few with deference, making it impossible to alternate class and this makes inclination the partition of the binary classes utilizing Otsu's strategy.
We master serve a novel technique that depends on the perception that water bodies typically indicate considerably higher qualities for the green and blue approach, as opposed to the red and NIR approach to appropriately recognize water in multispectral pictures. Given the red approach ρR, the green approach ρtt, the blue approach ρB, and the NIR approach ρNIR, the proposed water veil is characterized.
It rejects the greater sector of the false positives that the NDWI record creates by the proposed strategy for water extraction appears to miss a couple of pixels having a place with the water class. A water location technique that shows a lower review yet a higher exactness is best as our introduced strategy disposes of the areas having a place with the water class. In the previously mentioned twofold water cover, in an indistinguishable form from in the vegetation extraction strategy a morphological opening, trailed by a morphological shutting activity, is at last connected to expel little "gaps" or "islands".
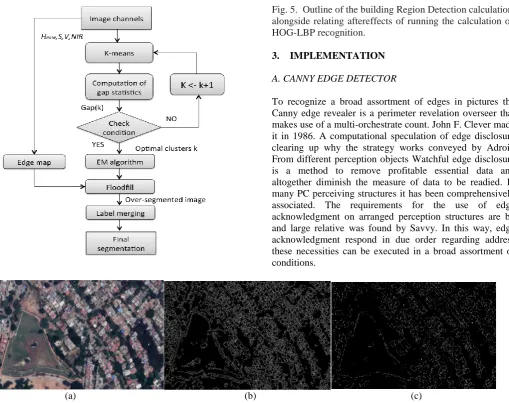
3) Image segmentation:Although it creates an arrangement of hopeful rectangular picture districts where structures are probably going to exist, the proposed HOG– LBP identifier can't perceive building limits. Precise picture division is important to make the change from the extraction of these rectangular identifications to the last outline of structures. To an arrangement of associated segment areas, whose pixels share regular multispectral properties, apportioning of the picture is the motivation behind the proposed picture division technique. We utilize the EM calculation in our
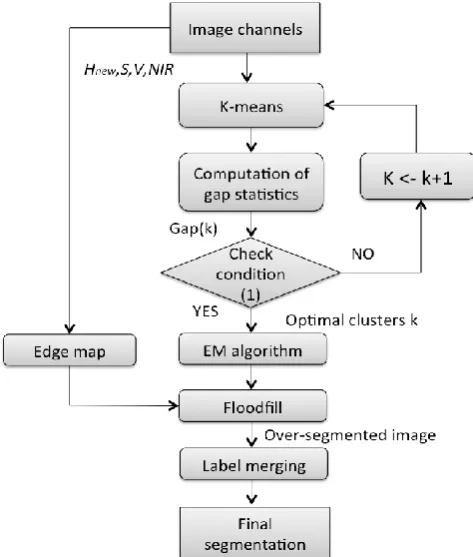
[image:6.595.324.561.309.588.2]approach, since it delivers more homogeneous locales than the k-implies calculation. The other picture division approaches are additionally viewed as, for example, mean move and super pixels, a parameter that we can characterize both in an ideal and programmed mold; we didn't have any significant bearing them because of the way that their reliance on parameters varies from the quantity of classes. Since a settled sum of bunches can't depict enough the ghostly varieties in every single satellite picture of our dataset are not portrayed by the settled sum of groups, To characterize in an unsupervised way the ideal sum of groups for exclusive tried picture independently we propose the utilization of hole measurement. The hole measurement can be considered as the factual formalization of the "elbow" heuristic process and prompts a sudden tumble to the whole of point-to-group separations, which thinks about the ideal sum of bunches.
Fig 4: Flow chart of the Image segmentation method.
These are: Ramp edge, Step edge, Roof edge, Spike edge. Step edge is an unexpected change in power level. Incline edge is a steady change in force. Spike edge is a Speedy change in power and after those profits promptly to a unique force. Rooftop edge isn't instantaneous over a short separation. Edge based picture division strategy falls under auxiliary systems.
To counter this, an area combining technique is a short time later connected, where every area with estimate littler than a limit Tsmall is converged with one of its neighboring locales, with which it has the best shading similitude.
3404 locator should choose.The most famous and generally
utilized technique for picture division is thresholding strategies. In this strategy, picture pixels are partitioned with the assistance of force level of a picture. This strategy is essentially used to recognize the frontal area objects from foundation pictures. In this articles are lighter than its experience.
Determination of this strategy relies on our earlier an associated pixel that is found on the limit of the locale is called an edge. So these pixels on an edge are known as edge points. Edge can be figured by finding the subsidiary of a picture work. A few edges are anything but difficult to discover. These are: Ramp edge, Step edge, Roof edge, Spike edge. Step edge is an unexpected change in power level. Incline edge is a steady change in force. Spike edge is a Speedy change in power and after those profits promptly to a unique force. Rooftop edge isn't instantaneous over a short separation. Edge based picture division strategy falls under auxiliary systems.
Using the Within-dispersion proportion Gap statistic is enumerated if the collected picture pixel and then it measures Wkb, b=1 … B evaluated from B triggered subgroup of picture pixels. The initiative sets of picture pixels are drawn uniformly.
Gap( ) ∑ ( ) ( ) (1)
Understanding log-probability is given by utilizing logarithm that is inside scattering sum. The prime arrangement of pixels is thought about when the age of the B subsets of pixels prompts the arrangement of a normal allusion circulation to which. The bigger the quantity of subsets B, the more exact the allusion circulation. The log (Wk) drops the most remote beneath the normal reference
conveyance accordingly; the ideal sum of groups is equivalent to the littlest estimation of k. By utilizing the whole measurement on the yield of the k-implies computation for expanding estimations of k, the ideal sum of bunches kˆ is resolved. Particularly for expansive
estimations of k the k-implies is computationally quicker than its EM partner, in this way it is our chosen grouping approach at this stage. To prepare kˆ, we utilize kˆ Gaussian models for the EM calculation, which delivers the last picture detachment. Not at all like the RGB shading space, the segments of the HSV shading space are free of each other and the tone (H) and immersion (S) channels are force and shadow invariant, for two fundamental reasons, every pixel is marked in light of their shading esteems, where rather than the red-green-blue (RGB) shading space, the tone immersion esteem (HSV) shading space is utilized; along these lines, the detachment strategy in view of HSV(S,V,NIR).
(
) (2)
4) Building Region Detector:
The determination of the picture districts that have the most elevated prospect to relate to structures in view of the yield of the HOG– LBP identifier is the reason for the proposed novel building locale indicator, their shading contrast to their neighboring areas, and their rectangularity. The point of this is to accomplish a progress from the location got to the exact pixel-based depiction of the structures in a satellite picture utilizing the HOG– LBP descriptors. A piece outline of the building area locator alongside an illustration imagining the work of the proposed strategy on a HOG– LBP discovery in as appeared in the Fig.5.
The scoring of the picture districts that are framed by the picture division network is researched in the initial step of the proposed approach. The proposed HOG– LBP identifier is a perfect question locator is expected in the accompanying properties:
3405 Fig. 5. Outline of the building Region Detection calculation, alongside relating aftereffects of running the calculation on HOG-LBP recognition.
3. IMPLEMENTATION
A. CANNY EDGE DETECTOR
To recognize a broad assortment of edges in pictures the Canny edge revealer is a perimeter revelation overseer that makes use of a multi-orchestrate count. John F. Clever made it in 1986. A computational speculation of edge disclosure clearing up why the strategy works conveyed by Adroit. From different perception objects Watchful edge disclosure is a method to remove profitable essential data and altogether diminish the measure of data to be readied. In many PC perceiving structures it has been comprehensively associated. The requirements for the use of edge acknowledgment on arranged perception structures are by and large relative was found by Savvy. In this way, edge acknowledgment respond in due order regarding address these necessities can be executed in a broad assortment of conditions.
(a) (b) (c)
Fig 6: (a) Original Image (b) Canny Edge Detector (c) Sobel Edge Detection
The process of the Canny Edge Detection: The Canny edge territory calculation process can be framed into 5 specific advances:
- With a specific genuine target to expel the hubbub apply Gaussian channel to smooth the photograph.
- Power purposes of the photograph ought to be found.
- To dispose of fake reaction to edge affirmation apply non-most silly mask.
- To pick potential edges apply twofold edge.
- Track edge by hysteresis: by covering the diverse edges that are slight and not related with solid edges settle the region of edges.
B. SOBEL EDGE DETECTION
The manager make use of two 3×3 pieces, which are intertwined with the principal picture to figure alikeness of the auxiliaries – one is for the, level changes, and one is for vertical. In case we portray An as the source picture, and Gx
and Gy are two pictures which at each point contain the even
and vertical backup approximations independently, the figurings are as per the following: Since the power limit of a propelled picture is simply known at discrete concentrations, subordinates of this limit can't be described unless we acknowledge that there is a fundamental determined power work, which has been investigated at the photo centers. With some additional suppositions, the subordinate of the reliable
3406 characteristics for the coefficients which weight the photo forces to make the edge estimation.
C. K MEANS CLUSTER
In this Fig.8(a) Initially from picture handling k-implies grouping is a strategy for vector quantization in this figure, in information digging it is prominent for bunch investigation. Segment n perceptions into k groups in which every perception has a place with the bunch with the closest mean, filling in as a model of group is pointed by k-implies grouping. Segregation of the knowledge space into Voronoi cells will be come about. The issue is counting troublesome (NP-hard); in any case, in fig 8(b) there are productive analytical calculations that are regularly utilized and merge rapidly to a neighborhood ideal. Both k-means and Gaussian Mixture Modeling generally like the desire boost calculation for blends of Gaussian dispersions by means of an renewal refinement approach utilize these. Moreover, they both
utilize group focuses to demonstrate the information; be that as it may, k-means clustering be liable to discover groups of similar spatial degree, while the desire amplification instrument enables bunches to have diverse shapes. In Fig.8(c), In k-closest neighbor classifier the calculation has a free association with it, for arrangement with k-implies a familiar machine learning system is frequently befuddled in view of the k in the name. To arrange new information into the current groups, on the bunch focuses acquired by k-implies one can apply the 1-closest neighbor classifier. It is studied as closest centroid classifier or Rocchio calculation.
(a) (b) (c) (d)
Fig. 8. (a) Original Input Image. (b) K-means Clustering1. (c) K-means Clustering2. (d) K-means Clustering3.
4. EXPERIMENTAL RESULTS
On the Athens datafile of satellite pictures that is presented was tried by our proposed strategy and results are introduced and talked about. We present our proposed fabricating discovery strategy and look at the variations. Afterward, to prepare the issue of building location our proposed strategy is contrasted and cutting edge building recognition methodologies and protest identification strategies that were balanced. At last, to changes in parameter design, we examine the favorable circumstances and impediments of our approach in the building identification errand to break down the affectability of the proposed technique.
A. Dataset and Metrics
Twenty-nine multispectral orthorectified satellite pictures are available in the Athens data file, portraying urban territories of Athens in Greece. QuickBird satellite was utilized to catch the majority of these satellite pictures (17 in number), which have four multispectral stations (red, green, blue, and NIR) and keeping in mind that 12 pictures were taken by the WorldView-2 satellite it displayed a spatial determination of 0.6 m for every pixel, which have eight multispectral line (red, green, blue, yellow, beach front, red-edge, NIR1, and NIR2) and present a spatial determination of 0.5 m for each pixel. The pictures of the Athens dataset were part in an approval set that comprises of 5 pictures (3 QuickBird and 2 WorldView-2 pictures) and a test set that
comprises of 24 pictures (14 QuickBird and 10 WorldView-2 pictures). The preparation set was the same as the one utilized in [21], comprising of physically marked picture fixes that were divided from a QuickBird picture 700 positive and 1400 negative, unique in relation to the pictures utilized as a part of the approval and test set. Our proposed procedure to have the capacity to apply to the two sorts of satellite pictures without adjustments, we utilize just the four normal multispectral stations. Clarified by human specialists on partitioned floor truth covers the test set contains 5105 structures.
Both at the protest and pixel stage the assessment of the systems on the data file is performed. The basic measures of review, exactness, and F1-score to quantify execution are utilized, where,
Recall =
(4a)
Precision =
(4b)
F1 – score =
(4c)
[image:9.595.43.556.327.424.2]3407 building description system, the question-based outcomes
are figured by tallying the quantity of effectively recognized and dishonestly eminent structures (TP and FP, individually). For pixel-based outcomes, TP remains for the quantity of accurately famed building pixels, FP remains for the quantity of erroneously named constructing pixels, and FN remains for the quantity of missed building pixels.
B. Correlation of HOG– LBP Detector Variants
On the satellite pictures of the Athens dataset we break down and think about the HOG– LBP detector variations that we actualized and tried. Utilizing C++ and the OpenCV library, from which a few implicit capacities have been utilized our procedure is executed. To recognize structures of different sizes in a picture, every single tried system utilize looking windows of various sizes (scales) extending from 200x200 pixels. In light of the determination of satellite pictures with sizes in the interim 50– 8000 m2 these sizes are sufficient for the identification of structures. The removal between two sequential seeking windows (walk) is equivalent to 5 pixels, while the proportion between two back to back scales is chosen to be equivalent to 1.1, as in our past work [21].
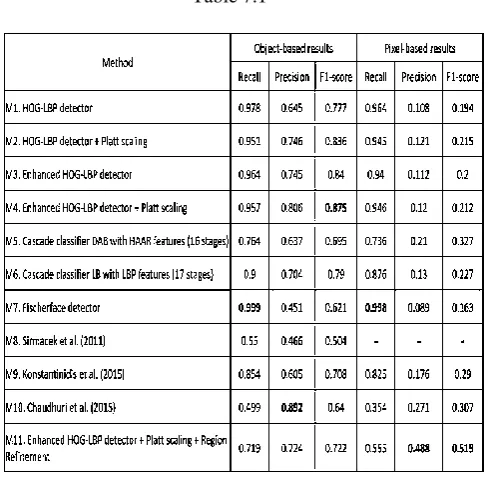
[image:10.595.43.288.431.673.2]At object and pixel level total recall, precision, and F1 -score of the tried approaches in the Athens information record. In strong are demonstrated the best face esteems
Table 7.1
With the presentation of the cosine-based difference measure as it was characterized and comes in the primary separation in our proposed approach. The calculation of the separation between the HOG– LBP descriptors indicated basically as HOG– LBP identifier, while the calculation of the separation between the HOG– LBP descriptors utilizing the cosine-based uniqueness measure offers ascend to the upgraded HOG– LBP indicator utilizing the l2-standard
offers ascend to the traditional HOG– LBP finder. Platt scaling is worried by the second and last separation of the HOG– LBP identifiers. The utilization of the Platt scaling permits the modification of the SVM score to likelihood Instead of the utilizing normal SVM finder, where the identifications with score higher than the limit of zero are acknowledged as positive recognitions. To separate amongst positive and negative identifications another edge can be set, which is equivalent to 0.5, infers that we acknowledge just the location that have bigger likelihood to have a place with the building class than not. The ideal Bayes edge esteem given equivalent misfortune for false positives and false negatives considers the edge esteem and has the preferred standpoint the that it isn't required to be resolved physically by exploring different avenues regarding the dataset.
The four HOG– LBP finder variations (M1– M4) is raised by these two separations, which are actualized and tried in the pictures of the Athens dataset. At the protest and pixel level are outlined in Table is the execution of the strategy, where the normal question based review, exactness, and F1-score and their comparing standard deviations in the information set are exhibited. As markers of the vigor of the tried techniques in the pictures of the Athens dataset the standard deviations are utilized. We trust it is essential to figure such qualities where the pictures fluctuate altogether in enlightenment and spatial determination (two sorts of satellite are utilized).
3408 addition, all HOG– LBP variations (M1– M4) are fit for
recognizing dangerous instances of structures with unearthly varieties in their housetops or structures incompletely secured by vegetation.
B. Correlation with Other Techniques
Our proposed procedure is contrasted and other protest and building recognition techniques in this area,. From our test set we depict the actualized and tried strategies and assess their execution on the satellite pictures.
1. Course classifier with HAAR highlights (M5): It is a structure of a few straightforward classifiers; to expand the execution of an indicator their votes are accumulated. Such a course classifier, to the point that utilizes HAAR highlights was at first proposed] and was later made strides. In the Athens dataset the course classifier was prepared and utilized for the location of structures. The Discrete Adaboost, the Real Adaboost, the Logitboost, and the Gentle Adaboost are th four boosting techiniques which were tried.
Moreover, the classifier did tried expanding the quantity of course arranges with a specific end goal to recognize which parameter design accomplishes the best execution on the building identification assignment. The outcomes are appeared, where one can deduce that the Discrete Adaboost classifier with 16 courses arranges accomplishes somewhat preferred outcomes over the Real Adaboost with 16 phases and much preferable outcomes over other parameter designs.
2)Cascade classifier with LBP highlights (M6): It utilizes an indistinguishable thought from the beforehand-introduced course classifier, with the main distinction living in the utilization of LBP includes rather than HAAR highlights. Like the HAAR course classifier, tests were keeping running for a wide range of boosting strategies and a few courses arranges with a specific end goal to recognize which parameter setup accomplishes the best execution on the building location errand. The outcomes are exhibited, where one can derive that the Logitboost classifier with 17 courses arranges accomplishes somewhat preferred outcomes over the Forbearing Adaboost with 17 phases and more preferable outcomes over an unlike criterion setups.
3) Fisherfaces (M7): To supplant the Eigenfaces strategy as an elective answer for the face approvememnt exercise this technique was proposed. Class-particular proportionally lessening is accomplished trying to expand the segregation amongst category and in this way, the computation of a question identifier utilizing Fisher's differentiate examination. For the exerciseof building identification in the Athens data file Fisherfaces were balanced and utilized.
4) Sirmacek and Unsalan include combination (M8) [6]: By intertwining different unmistakable highlights a builing identification philosophy is proposed. Harris and FAST corner highlights, GMSR districts and Gabor-sifting nearby highlights were utilized by the creators to distinguish building focuses not at all like alternate calculations, the main strategy that can't recognize building applicant areas however just building centers.
Hence, the execution of this procedure must be assessed at the protest level and not at the pixel level. The protest level assessment depends on single-pixel cover of a registered
building focus with the ground truth-building zone, since the technique does not give any information of the size of the building.
5) Konstantinidis et al. Hoard locator (M9): We utilized all multispectral data of a satellite picture in our previous work, and utilized HOG finder and utilized all multispectral data of a satellite picture in our previous work, concatenating the HOG descriptors processed for each multispectral station independently. Besides, an ideal parameter design for the errand of building identification was stop mined in view of the approval set.
6) Chaudhuri et al. building indicator (M10): A manufacturing finder in view of inside dark fluctuation (IGV) and morphology tasks is proposed. IGV highlights are extricated and the edge pixels that don't compare to man-made items are rejected. At that point, shadow discovery is utilized to evacuate false alerts and the rest of the edges frame the applicant districts out of which, structures are extricate. We actualized their technique with the special case that their proposed shadow location technique was supplanted by the calculation of Liu et al. for panchromatic pictures, as their shadow recognition technique was not sufficiently clear to be actualized. We experimented with different parameter esteems to discover that the qualities proposed in their paper yield the best outcomes in the Athens dataset. The execution of the already depicted philosophies (M5– M10) is assessed at the question and pixel level in the Athens dataset and the aggregate measures of review, exactness, and F1 - score are compressed. Besides, the normal question based review, exactness, and F1 - score and their comparing standard deviations are appeared. Strategies M5– M9 can be depicted as question based techniques since no building outline is endeavored. Consequently, the performance of these techniques can be straightforwardly contrasted with the performance of our proposed improved HOG– LBP identifier with Platt scaling (M4). The outcomes at the question level demonstrate the superiority of our protest based building finder (M4) over alternate techniques.
In the Athens information file the execution of the already portrayed philosophies (M5– M10) is reevaluated at the question and pixel level and the aggregate rectification of review, exactness, and F1-score are abridged. Moreover, the normal protest based review, accuracy, and F1-score and their relating standard deviations.
3409 dataset the low accuracy of technique M7 prompts average
F1-score and in this way, fair execution. The least standard deviation in the F1-score with an estimation of 0.058, trailed by the techniques M5, M6, and M9 is accomplished by our proposed calculation (M4) that performs comparatively with a somewhat bigger estimation of 0.067. Concerning light and spatial rectification changes display in the pictures of the Athens dataset where the technique M4 indicates more prominent power than alternate strategies.
A correlation of the pixel-based execution of the techniques M4– M9 uncovers that the course-supported classifier with HAAR highlights (M5) accomplishes the best exactness and F1 - score. However, the measure of review is much lower than that of different approaches, making it an unfortunate building finder in the Athens dataset. Konstantinidis et al. Hoard indicator (M9) accomplishes the second best accuracy and F1 - score, yet its review isn't as high as the review that our proposed HOG– LBP identifier (M4) accomplishes. The purpose for the low pixel-based exactness of the systems M4– M7 and M9 is credited to the way that these strategies distinguish locales where structures are probably going to exist and they can't perceive and separate building limits.
The course-supported classifier with HAAR highlights (M5) accomplishes the best fidelity and F1-score is uncovered by a correlation of the pixel-based computation of the techniques M4– M9. Making it an unfortunate building locator in the Athens dataset, the measure of review is much lower than that of different philosophies. The second best exactness and F1-score, yet its review isn't as high as the review that our proposed HOG– LBP finder (M4) is accomplished by Konstantinidis et al. Hoard indicator (M9). These strategies identify locales where formation are probably going to exist and they can't perceive and remove building limits as the purpose for the low pixel-based exactness of the techniques M4– M7 and M9 is ascribed. The shortcomings are uncovered by the appraisal of the tried techniques M5– M9 and their relating brings about the building recognition assignment. Under different lightning conditions HAAR highlights entirety up forces in rectangular locales and along these lines they are touchy to enlightenment changes, modification fundamentally the aftereffects of building location in pictures. The classes can be straightly isolated in a picture subspace is expected by the Fisherfaces. Notwithstanding, this can't be effortlessly ensured in a few query identification undertakings. On the combination of corner and inclination highlights is depended by Sirmacek and Unsalan strategy (M8). To effectively distinguish building focuses, the pictures of the Athens dataset experience the ill formation of commotion and low differentiation of organization to foundation and thusly, this strategy neglects to extricate enough corners. At long last, the course classifier with LBP highlights (M6) and the Konstantinidis et al. Hoard locator (M9) are effective in discriminating shape from foundation was utilized by the proposed assembling finder (M4) yet their execution is still outmatched by the corresponding utilization of both HOG and LBP highlights. Our proposed philosophy is contrasted and the expansion of the locale refinement technique (M11)
with another pixel-based building identification strategy (M10). From the satellite pictures it is anything but difficult to precisely distinguishing and separating formation utilizing these two techniques. Over the calculation created by Chaudhuri et al. (M10) both at the question and pixel level The outcomes exhibited show the predominance of our proposed fabricating identifier (M11). By very nearly 12.8% and 69%, separately, in examination with the execution of the approach M10 in the Athens dataset our technique enhances the protest based and pixel-based F1-score. The most elevated protest based exactness from all tried query and pixel-based systems in the Athens dataset is the place the calculation (M10) accomplishes our approach is mediocre just in the question based exactness.
We conclude that our proposed methodology (M11) achieves the lowest standard deviation in the F1-score by comparing the standard deviations, with a value of 0.041, meaning that it is more robust than any other tested method,
including the method of Chaudhuri et al. (M10). A
WorldView-2 satellite image of the Athens dataset are presented by the building detection results of our proposed building detection framework (M11) and the algorithm of Chaudhuri et al. (M10) in a Quickbird.
In the Athens dataset the inferior performance of the Chaudhuri et al. building detector (M10) can be attributed to three main reasons. First, by the selection of a suitable building template that enhances the contrast between the buildings and other objects in a satellite image the methodology is strongly affected. To get optimal results, we experimented with various templates, but a selection of a non-representative template can significantly affect the results. Second, in the Athens dataset the extraction of building edges that play a key role to the performance of the building detector can be severely effected by noise and low contrast present. Lastly shadow is present not only near buildings but also near other objects, such as tall trees and fences in high-resolution satellite images. As a result, to belong to buildings, leading to a drop in the performance of the
building detector, non-building edges can be wrongly
assumed.
Next, the comparison between our proposed pixel-based building extractor (M11) and our proposed object-based building detector (M4). The pixel-based performance of the algorithm M11 is significantly better than the performance of the method M4 are shown in the results, as several false detections are removed and building boundaries are correctly identified. Unfortunately, leading to a drop in the pixel-based recall and the object-pixel-based performance of the algorithm M11 in the Athens dataset some buildings are lost in the process. In cases of noise in the satellite image or buildings with similar color information to the background the loss of buildings can be attributed to the quality of image segmentation can be severely degraded. Some buildings are discarded either during the formation of the initial building candidates or by the employment of the rectangularity threshold as there are some buildings with irregular shapes that do not present high rectangularity values.
3410 variations in their rooftops (i.e., buildings within the white
circles) and buildings partially occluded by vegetation (i.e., buildings within the orange circles) exist. The cascade classifiers (methods M5 and M6), similar to the HOG–LBP variants have no problem detecting such ―problematic‖ cases of buildings are reveled by the results. Hardly any "standard" or incorrectly recognized structures (i.e., sig-nificant bit of a location is secured by foundation) appear to be missed by the course classifiers. To recognize "dangerous" instances of structures, the Fisherfaces strategy (M7) likewise oversees anyway to the detriment of delivering a few false cautions around them. Then again, Sirmacek's approach (M8), while it additionally neglects to distinguish a few "general" structures, bombs in recognizing one of the structures with ghostly varieties in its housetop. Additionally, it neglect to distinguish a building that presents phantom varieties, while the two calculations effectively recognize structures that are in part covered by vegetation both Konstantinidis et al. Hoard indicator (M9) and Chaudhuri et al. technique (M10). At long last, every one of the structures that present either unearthly varieties in their housetops or are halfway blocked by vegetation are distinguishes accurately by our proposed philosophy (M11). The technique M4 effectively catches such "risky" instances of structures and the district refinement strategy does not dismiss them as false alerts.
D. Affectability to Parameters
Keeping in mind the end goal to figure out which LBP is at first variation accomplishes the best change in the execution of the building finder, tests were made when it is joined with the HOG descriptor. Traditional LBP include vectors, trailed by the marginally more awful execution of the uniform LBP highlight vectors accomplishes the aftereffects of the experimentation with the LBP variations are appeared and uncover that the best execution of our proposed fabricating identifier. The quantity of created information subsets B that influence the exactness of the registered whole measurement is set equivalent to 20. The proposed system is hearty to changes to the quantity of created information subsets B since high qualities influence marginally the exactness of the whole measurement is uncovered by the analyses,
Fundamentally it will expand the computational time. Amid the development of the last vegetation and water veils are performed utilizing a square-organizing component of size 5x5 in pixels as the morphological tasks connected to it. To stifle little points of interest this size is sufficiently expansive and gaps in the covers and to keep away from noteworthy misclassification blunders it is sufficiently little. The execution of the proposed fabricating finder is affected by the parameters and ought to be legitimately characterized are the recurrence of the cosine-based uniqueness measure α, the factor of deviation Fdev, In the picture division method Tsmall the base territory of acknowledged picture locales, the level of building competitor's pixels that should have a place with either vegetation or water so the building hopeful is disposed of Tover, the weight vector w, and the
rectangularity edge Trect. These parameters are characterized by experimentation on the 5 satellite pictures of our approval set and in light of the streamlining of the pixel-based execution of our proposed assembling indicator are picked (M11). So as to consider nonhomogeneous housetops the base territory of a picture district Tsmall
ought to be set littler than the measure of the littlest building. The esteem can be set corresponding to the extent of the underlying seeking window of the HOG– LBP calculation since we have officially utilized a HOG– LBP building identifier, Tsmall. The weight vector w is dictated by a framework look for part esteems in the range [0,1] with a stage of 0.05. As we are intrigued for which locale this total gets the most noteworthy score, this is conceivable on the grounds that the outright estimation of the weighted total given is immaterial for the examination between the picture areas. Taken after by the cover of a picture district and the relating identification of the HOG– LBP calculation tests demonstrate that the most critical scoring term is the shading contrast of a picture locale to its neighbors. At long last, the recurrence of the cosine-based separation work differs in the range [0,1.99] with ventures of 0.01 is controlled by the parameter.
It is vital imperative as the determination of a proper incentive for the recurrence of the cosine-based disparity measure α. The execution of the proposed philosophy can be seen as it increments just for estimations of α littler than 0.4. The measure of commotion in the preparation set isn't critical and slight varieties in the figured HOG– LBP descriptors are essential for the separation amongst positives and negatives is implied for the ideal estimation of 0.09 for the parameter α. Our proposed procedure is very strong in these parameters' qualities changes. Amid the past strides of the philosophy and expanding the rectangularity limit does not prompt a noteworthy increment in the exactness of the calculation with low rectangularity scores the greater part of the areas have just been rejected. It is watched that the rectangularity edge is set to too high qualities, a drop in the pixel-based execution of the proposed strategy. At long last, the execution of the calculation is fundamentally influenced by the measure of the littlest acknowledged image region.
E. Limitations
3411 be improved. There can in any case be non-building locales
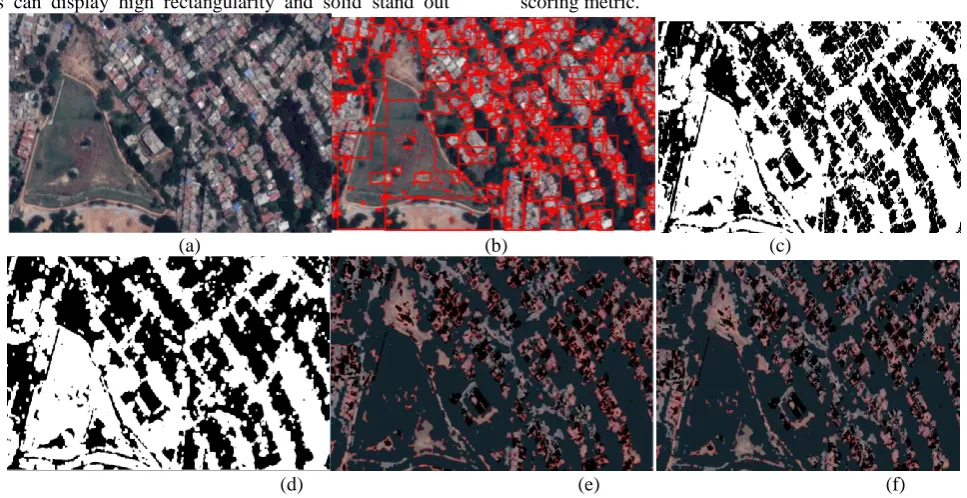
that accomplish higher score than the building districts albeit in excess of one scoring terms are accumulated. False positives that depict little street fragments or land fix our rejected by our strategy. The separated picture areas in such cases can display high rectangularity and solid stand out
from the foundation. On the off chance that means are taken in the bearing of fragmenting a satellite picture precisely Such issues can anyway be lightened, from that point forward streets and land fields will reach out of the HOG– LBP identifications and they will be cheapened by the scoring metric.
(a) (b) (c)
(d) (e) (f)
Fig. 10. (a) Original Image. (b) Buildings Detected in Rectangular Box (c) Background Subtraction with Grey Scale Output Image. (d) Removed Unwanted Region using Grey Scale Threshold. (e) Boundary Outline. (f) With Some Filtering.
(a) (b) (c)
Fig. 11. (a) Original Image. (b) Building Detection using Threshold Value 7, assigned between 5/100. (c) Building Detection using Threshold Value 210, assigned between 200 to 400
5. CONCLUSION
In this paper, we propose a novel building location strategy called from satellite pictures. Our strategy utilizes linked HOG and LBP highlights utilizing a novel separation work in the preparation and testing of the SVM classifier. Besides, we receive a novel methodology to characterize a powerful limit utilizing Platt scaling to figure out which discoveries are acknowledged as positives and which are disposed of as false alerts. The new limit gives a critical lift to the execution of the HOG– LBP indicator. At last, we
propose a novel way to deal with precisely identify building limits. The locale refinement strategy depends on the consequence of a picture division method, the utilization of the yield of the HOG– LBP locator and the work of novel scoring measurements to decide the areas that will probably relate to structures.
[image:14.595.55.539.162.411.2] [image:14.595.72.525.455.590.2]3412 building locator, faces issues keeping the high review of the
HOG– LBP detector, as a couple of structures are lost all the while. Likely the majority of these issues can be relieved by a precise picture division technique.
REFERENCES
[1] L. Theng, ―Automatic building extraction from satellite imagery,‖ Eng.Lett., vol. 13, no. 3, pp. 1–5, Nov. 2006. [2] K. Karantzalos and D. Argialas, ―A region-based level
set segmentation for automatic detection of man-made objects from aerial and satellite images,‖ Photogramm. Eng. Remote Sens., vol. 75, no. 6, pp. 667–677, 2009. [3] D. Singh, R. Maurya, A. Shukla, M. Sharma, and P.
Gupta, ―Building extraction from very high resolution multispectral images using NDVI based segmentation and morphological operators,‖ in Proc. Students Conf. Eng. Syst., Mar. 2012, pp. 1–5.
[4] T. Hermosilla, L. Ruiz, J. Recio, and J. Estornell, ―Evaluation of au-tomatic building detection approaches combining high resolution im-ages and LiDAR data,‖ Remote Sens., vol. 3, no. 6, pp. 1188– 1210, 2011.
[5] B. Sirmacek and C. Unsalan, ―Urban-area and building detection using SIFT keypoints and graph theory,‖
IEEE Trans. Geosci. Remote Sens., vol. 47, no. 4, pp. 1156–1167, Apr. 2009.
[6] B. Sirmacek and C. Unsalan, ―A probabilistic framework to detect build-ings in aerial and satellite images,‖ IEEE Trans. Geosci. Remote Sens., vol. 49, no. 1, pp. 211– 221, Jan. 2011.
[7] P. Hough, ―Method and means for recognizing complex patterns,‖ U.S.Patent 3 069 654, Dec. 18, 1962. [8] T. Kim and J. Muller, ―Development of a graph-based
approach for building detection,‖ Image Vision Comput., vol. 17, no. 1, pp. 3–14, 1999.
[9] D. Haverkamp, ―Automatic building extraction from IKONOS imagery,‖ in Proc. Amer. Soc. Photo Remote Sens., 2004, pp. 23–28.
[10] D. Woo, Q. Nguyen, Q. N. Tran, D. Park, and Y. Jung, ―Building detection and reconstruction from aerial images,‖ in Proc. Int. Soc. Photogramm. Remote Sens. Congr., Beijing, China, 2008, pp. 713–718.
[11]S. Vinson, L. Cohen, and F. Perlant, ―Extraction of rectangular buildings in aerial images,‖ in Proc. Scand. Conf. Image Anal., 2001.
[12]K. Karantzalos and N. Paragios, ―Recognition-driven two-dimensional competing priors toward automatic and accurate building detection,‖ IEEETrans. Geosci. Remote Sens., vol. 47, no. 1, pp. 133–144, Jan. 2009. [13]O. Benarchid et al., ―Building extraction using
object-based classification and shadow information in very high resolution multispectral images, a case study: Tetuan, Morocco,‖ Can. J. Image Process. Comput. Vision, vol. 4, no. 1, pp. 1–8, Jan. 2013.
[14]S. Kluckner and H. Bischof, ―Image-based building classification and 3d modeling with super-pixels,‖ in
Proc. Int. Soc. Photogramm. Remote Sens. Photogramm. Comput. Vis. Image Anal., 2010, pp. 291– 296.
[15]A. Shackelford and C. Davis, ―A combined fuzzy pixel-based and object-pixel-based approach for classification of high-resolution multispectral data over urban areas,‖
IEEE Trans. Geosci. Remote Sens., vol. 41, no. 10, pp. 2354–2363, Oct. 2003.
[16]Z. Sheng-hua, H. Jian-jun, and X. Wei-xin, ―A new method of building detection from a single aerial photograph,‖ in Proc. 9th Int. Conf. Signal Process., Oct. 2008, pp. 1219–1222.
[17]C. Senaras, M. Ozay, and F. T. Y. Vural, ―Building detection with decision fusion,‖ IEEE J. Sel. Topics Appl. Earth Observ. Remote Sens., vol. 6, no. 3, pp. 1295–1304, Jun. 2013.
[18]D. Chai, W. Forstner,¨ and M. Y. Yang, ―Combine Markov random fields and marked point processes to extract building from remotely sensed images,‖ in Proc. ISPRS Ann. Photogramm. Remote Sens. Spatial Inf.Sci., 2012, pp. 1219–1222.
[19] O. O. Karadag,˘ C. Senaras, and F. T. Y. Vural, ―Segmentation fusion for building detection using domain-specific information,‖ IEEE J. Sel. TopicsAppl. Earth Observ. Remote Sens., vol. 8, no. 7, pp. 3305– 3315, Jul. 2015.
[20] J. Femiani, E. Li, A. Razdan, and P. Wonka, ―Shadow-based rooftop segmentation in visible band images,‖