Volume 3, No. 4, July- August 2012
International Journal of Advanced Research in Computer Science
RESEARCH PAPER
Available Online at www.ijarcs.info
Comparative Study on Different Multi-Criteria Decision Making Tools in Software
project selection scenario
Santanu Kumar Misra*
Dept. of Computer Science and Engineering Sikkim Manipal Institute of Technology
Majitar, East-Sikkim, India. [email protected]
Amitava Ray
Dept. of Mechanical Engineering Sikkim Manipal Institute of Technology
Majitar, East-Sikkim, India. [email protected]
Abstract: The methods that are usually employed to select the Enterprise Resource Planning (ERP) software package are tedious and inefficient. Selection of inappropriate software packages can lead to complexity and overrun cost which affects the organisation in the long run. This paper mainly focuses on (i) Software evaluation criteria (ii) Comparison between different methods and, (iii) Sensitivity Analysis model to assist the decision-makers to choose efficient software packages. The comparative study facilitates selection of robust software along with the best methodology employed. Four methods have been selected for comparison: Analytic Hierarchy Process (AHP), Technique for Order Preference by Similarity to Ideal Solution (TOPSIS), Combination of DEMATEL and TOPSIS and Complex Proportional Assessment (COPRAS). In addition to this, a mathematical model known as Sensitivity Analysis is conducted to rate the software packages based on index value. The approach is modeled to assist the decision-makers in selecting the appropriate software packages. A numerical application at the end illustrates the proposed methodology.
Keywords: AHP, DEMATEL, TOPSIS, COPRAS, Sensitivity analysis, ERP.
I. INTRODUCTION
A reliable and qualitative software package is critical for an organization. Selection of inappropriate methodology leads to poor performance in the organization. The task of software package selection has become more complex due to (i) difficulty in accessing applicability of software packages to the business needs of the organization due to availability of large number of software packages in the market, (ii) Existence of incompatibilities between various hardware and software systems, (iii) lack of technical knowledge and experience to decision makers, and (iv) ongoing improvements in information technology [1]. Multi-criteria decision making (MCDM) is concerned with structuring and solving decision and planning problems involving multiple criteria. MCDM tool refers to selecting the efficient methodology on the basis of multiple criteria. Goal of MCDM is: (i) to help decision-makers to choose the best alternatives, (ii) to sort out the alternatives that seems good among the set of available alternatives, and (iii) to rank the alternatives in decreasing order of performance [2].
The process of evaluation and selection of the software packages involves simultaneous multiple attributes to rank the available alternatives and select the best one. Therefore, evaluation and selection of the software packages can be considered as multi criteria decision making problem [3]. The task of software selection is often assigned under schedule pressure and evaluators may not have time or experience to plan selection process in detail. A proper ERP selection can deliver many benefits within time and budget allotted. The comparative study between methods which help the decision-makers in identifying the appropriate software that caters to the need of the organization. Thus, the main aim would be to obtain the best solution for the decision-makers. Sensitivity
Analysis test is taken at the end which helps the decision-makers to select the methodology in order of priority. Thus, the method with the highest value in the sensitivity plot is considered to be the best. Hence, this paper mainly focuses on comparing the four methodologies: Analytic Hierarchy Process (AHP), Technique for Order Preference by Similarity to Ideal Solution (TOPSIS), Combination of DEMATEL and TOPSIS and Complex Proportional Assessment (COPRAS). These methods are compared to extract the compatible methodology along with the robust and efficient software package for the organization.
II. LITERATURESURVEY
packages, aimed at comparing two tools supported methods AHP and case-based ranking (CBRank)[9].
The comparison is based on three measures: the ease of use, the time consumption, and accuracy. The results showed that for the first two measures CBRank overcomes AHP, while for accuracy AHP performs better than CBRank, even if the resulting ranks from the two methods are very similar [10]. d A strategy to select model-based testing approaches for software projects, called Porantim has been discussed in a study [17]. Porantim is based on a body of knowledge describing model-based testing approaches and their characterization attributes and a process to guide by adequacy and impact criteria regarding the use of this sort of software technology that can be used by software engineers to select model-based testing approaches for software projects. Petri Kettunen and Maarit Laanti [18] in their literature proposed a comparative selection model. Some real-life project case examples are examined against this model.
Other observations based on review of literature are:(1) there is a little work done on developing decision making framework comprising: methodology for selecting software packages, criteria for evaluating software packages, technique for evaluating software packages, (2) there is need of system/tool having inbuilt knowledge of software evaluation criteria and evaluation technique which will assist decision makers not only in software selection but also increase efficiency, and brings consistency and transparency in the process of software selection, (3) although, functional criteria for software selection are different for different software packages, other criteria related to the quality, cost and benefits, vendor, hardware and software requirements, opinion of different stakeholders about the software package, and output characteristics of the software package are common and can be used for evaluation of any software package[11]. Alike AHP, TOPSIS, COPRAS, and DEMATEL are also multi criteria decision making approach can be applied for software selection tenacity. This paper is based on comparison of four methods. The results obtained by these methods generate the preferred alternatives and comparison among the preferred alternatives introduces the best MCDM method for software selection. This study will help the decision makers to establish an overall level of satisfaction for an organization. The study reduces the risk of making inappropriate selection of software packages. By generating the efficient methodology, the study minimizes the work load on decision makers.
III. PROPOSEDMETHODOLOGY
Applying Multi-Criteria Decision Making, we evaluate different optimal and feasible criteria to choose the best software package for organization. In our proposed methodology, the best software package is chosen from each method and a sensitivity analysis test is done taking into consideration the Subjective Factor Measure (SFM) and the Objective Factor Measure (OFM). And finally the best methodology is selected considering the index values in the sensitivity plot.
The proposed methodology has been illustrated with the help of a flow diagram:
Sensitivity Analysis
Figure 1: Flow Diagram
A. Explanation of Flow Diagram:
Step1: We set a committee of decision-making team. Step2: The decision-making criteria are listed. Step3: We rate how well each decision alternative satisfies each criterion.
Step4: Assign weight to each criterion for TOPSIS and COPRAS methodologies. DEMATEL approach is used to determine the (r+c) values (as described in Step 4 of DEMATEL approach).
Step5: The (r+c) values obtained from DEMATEL approach and the feasible alternatives are combined into TOPSIS method to determine the priority values. And the other three methods i.e AHP, TOPSIS and COPRAS are evaluated.
START
READ CRITERIA
READ ALTERNATIVES
READ ELEMENTS
READ WEIGHT
DISPLAY THE RESULT
RANKING THE METHODOLOGIES
COMPARE THE METHODS
DISPLAY THE BEST
Step6: The priority values are obtained from all four methods and the alternative with the highest priority value is considered to be the best alternative for that method.
Step7: The values of the best alternatives(software packages) as obtained using different methods is considered to be the Subjective Factor Measure(SFM) and the costs of those best software packages are incorporated into Objective Factor Measure (OFM) of Sensitivity Analysis model. Substituting the priority values and the costs in the Sensitivity Analysis model, the Software Index (SI) value is obtained for each methodology.
Step8: Based on the highest Software Index (SI) value obtained from sensitivity analysis, the appropriate method is selected.
IV. APPLIEDMETHODS
A. Analytic Hierarchy Process(AHP):
The Analytic Hierarchy process (AHP) developed by Thomas Saaty’s, is a very popular method to solve complex multi criteria decision problems by ranking the decision alternatives and selecting the best one when the decision maker has multiple objectives or criteria [12].
Step 1: The Criteria and Decision Alternatives are listed. Step 2: A Pairwise Comparison Matrix is formed where numeric ratings from 1-9 can be assigned. A reciprocal rating is assigned when second alternative is preferred to first. Numeric rating 1 is assigned when the alternative is compared to itself.
Step 3: A Normalized Matrix is developed by dividing each number in a column of the pairwise comparison matrix by its column sum.
Step 4: The Priority Vector is then evaluated by taking the average of each row of the normalized matrix.
Step 5: The Consistency Ratio is then calculated [CI, RI, and CR].
A consistency ratio of less than 0.1 is preferred. For ratios which are greater than 0.1, the subjective input should be re-evaluated.
Step 6: Calculation of a Priority Matrix.
The column entries are the priority vectors for each criterion. Step 7: The Criteria Pairwise Development Matrix is formed by listing the decision alternatives horizontally and criteria vertically.
Step 8: The Overall Priority Vector is calculated by multiplying the criteria priority vector (from step 7) by the priority matrix (from step 6).
a. Determining the Consistency Ratio:
Step 1: For each row of the pairwise comparison matrix, a weighted sum is determined by summing the multiples of the entries by the priority of its corresponding (column) alternative.
Step 2: For each row, its weighted sum is calculated by dividing the priority of its corresponding (row) alternative.
Step 3: The average is determined, λmax, of the results of step
2.
Step 4: The consistency index, CI, is computed of the n alternatives by:
CI=(λmax-n)/(n-1)
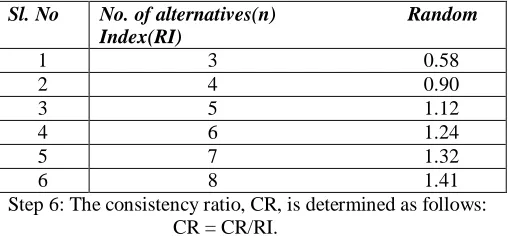
[image:3.612.320.575.109.227.2]Step5: The random index, RI, is determined as follows:
Table 1: Random Index
Sl. No No. of alternatives(n) Random Index(RI)
1 3 0.58
2 4 0.90
3 5 1.12
4 6 1.24
5 7 1.32
6 8 1.41
Step 6: The consistency ratio, CR, is determined as follows: CR = CR/RI.
B. Decision-Making Trial and Evaluation Laboratory (DEMATEL):
This method is one of the structural modeling techniques which can identify the interdependence among the elements of a system through a casual diagram by portraying the basic concept of contextual relationships and the strength of elements among the elements [13]. The procedure of DEMATEL method is as follows:
Step 1: Compute the average matrix. Each respondent was asked to evaluate the direct influence between any two factors by an integer value from 0, 1, 2 and 3, representing no influence, low influence, medium influence and high influence, respectively. The notation of xij represents the degree to which the respondent believes factor i affects factor j .For i=j, the diagonal elements are set to zero. For each respondent, an [n x n] non-negative matrix can be presented as Xk= [xkij], where, k is the number of respondents with 1<k<H and n is the number of factors. Thus, X1, X2, X3,…., XH are the matrices from H respondents, the average matrix A=[aij] is as follows:
aij= (1)
Step 2: Calculate the normalized initial direct-relation matrix D by
D=A*S (2) Where,
S=
and each element in matrix D falls between zero and one. Step 3: Calculate the total relation matrix T by
T=D (I-D)-1 (3) Where I is the identity matrix .Define r and c be n and 1 n vectors representing the sum of rows and sum of columns of matrix T, respectively. Suppose ri be the sum of i-th row in matrix T, the ri summarizes both direct and indirect effect given by factor i to other factors. If cj denotes the sum of j-th column in matrix T, then cj shows both direct and indirect effects by factor j from the other factors.
C. Technique for Order Preference by Similarity to Ideal Solution (TOPSIS):
In this method two artificial alternatives are hypothesized: Ideal alternative: the one which has the best level for all attributes considered.
Negative ideal alternative: the one which has the worst attribute values. TOPSIS selects the alternative that is closest to the ideal solution and farthest from negative ideal alternative. TOPSIS assumes that we have ‘m’ alternatives (options) and ‘n’ attributes/criteria and we have the score of each option with respect to each criterion [14].
Let xij score of option i with respect to criterion j. The score is to be selected between 0 to 9. Now form a matrix
X = (xij) [m x n] matrix. Let J be the set of benefit attributes or criteria (more is better). Let J' be the set of negative attributes or criteria (less is better).
Step 1: The normalized decision matrix is established by using the formula below:
rij= xij/ ( ) 1/2 for i=1,..,m; j=1,…,n (4) And normalized matrix is , Rij= (rij),which is a [m x n] matrix. Step 2: The weighted normalized decision matrix is determined by multiplying each column of the normalized decision matrix by its associated weight. An element of the new matrix becomes:
vij= wj rij (5) Where, wj denotes the weight.
Step 3: The ideal and negative ideal solutions is determined in the following manner:
Ideal solution: A* = { v1* , …, vn*}.
Negative ideal solution: A' = { v1' , …, vn' }. Where
vi* =[max (vij)_if_jЄJ; min(vij)_if_jЄJ'] i
vi` =[min (vij)_if_jЄJ; max(vij)_if_jЄJ'] i
Step 4: The separation measures for each alternative is calculated:
The separation from the ideal alternative is:
Si * = [ ∑ (vj*– vij)2 ] ½ i = 1,…, m. (6) j
Similarly, the separation from the negative ideal alternative is:
S'i= [ ∑ (vj'–vij)2 ] ½ i=1,..,m. (7) j
Step 5: Calculate the relative closeness to the ideal solution Ci*.
Ci* = S'i / (Si* +S'i ) ,0 <Ci*< 1 (8) Select the option with Ci* closest to 1.
D. Complex Proportional Assessment (COPRAS):
The complex proportional assessment (COPRAS) method is used to prioritize the alternatives on the basis of several criteria along with the associated criteria weights. This method selects the best decision alternatives considering the ideal and worst-ideal solutions. This method works on a step wise ranking and evaluation procedure of the alternatives in terms
of their significance and utility degree [15]. The algorithm consists of the following steps:
Step 1: To normalize the decision matrix using the formula:
xij= (9)
Step 2: To determine the weighted normalized decision matrix,
D’= (10)
Where , is the normalized performance value of ith alternative on jth criteria and is the associated weight of the jth criteria.
Step 3: The sums Si+ and Si- of weighted normalized values are computed for both beneficial and non-beneficial criteria respectively. For beneficial criteria, higher value is better and for non-beneficial criteria, lower value is better for the attainment of goal. These sums Si+ and Si- are calculated using the following equations:
Si+= (11)
Si-= (12)
Step 4: To determine the relative importance or priorities of the candidate alternative Qi by the following equation:
Qi= + (13)
The relative importance Qi of an alternative shows the extent of satisfaction attained by that alternative. Among the alternatives, one with the highest relative importance value is the best choice.
Step 5: To calculate the performance index (Pi) of each alternative
Pi= x100% (14)
Step 6: We normalize the result.
Result = (15)
E. Sensitivity Analysis:
A mathematical model is also applied here to combine the weighted rating obtained from different MCDA model with the cost of alternatives, to get the appropriate solution of the proposed model [16].
(16)
Where,
OFM is the Objective Factor Measure. OFU is the Objective Factor Utility which is the cost values of alternatives. SFM is the Subjective Factor Measure. SI is the Software Index. ‘α’ is the objective factor decision weight, α
≥0 bu t α ≤ 1. ‘n’ is the number of alternatives. Using Eq .
number (16) Software Index can be calculated. The choice of
V. NUMERICALANALYSIS
All four methodologies are evaluated and finally a comparison is done in order to find the best methodology.
In the comparative study, we have taken four alternatives (A1, A2, A3, and A4) and four criteria (C1, C2, C3, and C4).
We take the input matrices and follow the respective steps as mentioned above for all four methods. The outputs evaluated are shown in tabular form.
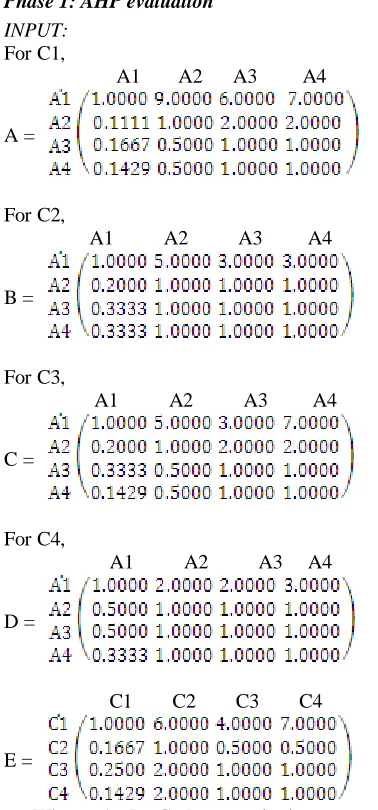
Phase 1: AHP evaluation INPUT:
For C1,
A1 A2 A3 A4
A =
For C2,
A1 A2 A3 A4
B =
For C3,
A1 A2 A3 A4
C =
For C4,
A1 A2 A3 A4
D =
C1 C2 C3 C4
E =
Where, A, B, C, D are pairwise comparison matrix for software packages and E is the pairwise comparison matrix for criteria.
Now, following the steps as mentioned above we get the below Output for AHP.
Table 2: AHP Output
Alternatives Priority Rank
A1 0.6287 1
A2 0.1524 2
A3 0.1141 3
A4 0.1048 4
Therefore, the best alternative using AHP is A1 with priority value 0.6287.
Phase 2: TOPSIS Evaluation
INPUT:
C1 C2 C3 C4
A =
We took the weight as:
[image:5.612.34.223.167.572.2]Wj = (0.2 0.4 0.3 0.1).
Table 3: TOPSIS Output
Alternatives Si* Si΄ Ci* RANK
A1 0.0001 0.4796 0.9980 1
A2 0.4390 0.0530 0.1077 2
A3 0.4758 0.0108 0.0222 3
A4 0.4774 0.0062 0.0127 4
[image:5.612.321.576.326.599.2]Phase 3:Combination of DEMATEL AND TOPSIS INPUT: We took matrix A for DEMATEL and the weight obtained from it is used in TOPSIS Methodology. C1 C2 C3 C4 A = Table 4: DEMATEL Output Sl. No Criteria ( r+c) values 1 C1 0.2569 2 C2 0.2205 3 C3 0.2510 4 C4 0.2716 These (r+c) values are combined into TOPSIS and further evaluation is done. B is the input matrix used for TOPSIS method. INPUT: C1 C2 C3 C4 B = Table 5: Combination of DEMATEL AND TOPSIS Output Alternatives Si* Si΄ Ci* RANK A1 0.0360 0.4239 0.9217 1
A2 0.3393 0.0916 0.2126 2
A3 0.4009 0.0268 0.0627 3
A4 0.4517 0.0246 0.0516 4
Therefore, the best alternative using COMBINATION OF DEMATEL AND TOPSIS is A1 with priority value 0.9217.
Phase 4: COPRAS
C1 C2 C3 C4
A =
[image:6.612.329.570.53.253.2]We took the weight as: Wj = (0.2 0.4 0.3 0.1)
Table 6: COPRAS Output
Alternatives Si+ Si- Qi Result Rank
A1 0.7117 0.0636 0.8688 0.2224 3
A2 0.1302 0.0182 0.6802 0.1741 4 A3 0.0807 0.0091 1.1807 0.3022 1
A4 0.0774 0.0091 1.1774 0.3013 2
Therefore, the best alternative using COPRAS is A3 with priority value 0.3022
Now, the best alternative from each methodology is taken and a sensitivity analysis test is taken.
VI. RESULTSANDDISCUSSION
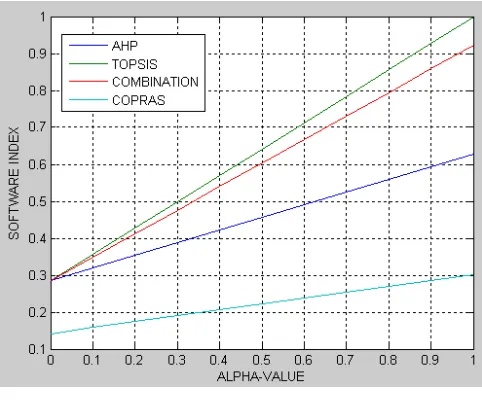
Sensitivity Analysis based on Eq. (16) is conducted considering all rank1 alternatives from different methods, with their obtained result as subjective factor measure (SFM) and respective cost as the Objective Factor Utility (OFU).We assume the cost of the alternatives as given below:
A1= $150, A2= $250, A3= $300, A4= $200
A1 is the best alternative for AHP, TOPSIS and combination of DEMATEL AND TOPSIS methodologies, and A3 is the best alternative from COPRAS. The four methods, their best feasible alternatives and the cost of those alternatives are shown in TABLE 7.
[image:6.612.31.290.66.270.2]The conversion from objective factor utility to objective factor measure is done through the Eq. (16). The SFMi and OFMi from these four methods for their respective feasible alternatives are represented in TABLE 8.
Table 7: Cost of Alternatives
Method Alternative Cost
AHP A1 $150
TOPSIS A1 $150 Combine DEMATEL and
TOPSIS
A1 $150
COPRAS A3 $300
Table 8 : Subjective and Objective Factor Measure
Method Alternative SFMi OFMi
AHP A1 0.6287 0.285
TOPSIS A1 0.9980 0.285 Combine DEMATEL
and TOPSIS
A1 0.9217 0.285
COPRAS A3 0.3022 0.142
Figure 2: Sensitivity Plot
Finally, from Eq. (16) we plot the graph as shown above. Thus, from the graph, we can clearly see that TOPSIS is the best feasible methodology. And alternative 1 (A1) is the best software package for TOPSIS (as we can see from Table 8).
VII.CONCLUSION
Literature survey reveals varieties of software selection models. An efficient assessment system is essential for appropriate software selection problem. Firstly, in all previous models, the main focus was given to the simplicity of the selection procedure. But for an organizational perspective where multiple criteria are considered for suitable selection the simplicity cannot meet the robust decision. Number of times all the above mentioned methods have been used for selection purpose. But in point of robust and optimal selection TOPSIS method perform a better result than others. This paper focuses on comparison of four methods. The results obtained by these methods determine the preferred alternative and the best MCDM method. This study will help the decision-makers to establish an overall level of satisfaction for an organization. The study reduces the risk of making inappropriate selection of software packages. By generating the efficient methodology, the study minimizes the workload on decision-makers.
VIII.REFERENCES
[1]. Anil S. Jadhav,Rajendra M.Sonar.Framework forevaluation
and selection of software packages:A hybrid knowledge based system approach.2011.
[2]. Molaghasemi,M.,Pet-Edwards, J.,1997. Technical briefing:
making objective decisions. IEEE computer Society Press, Los Alamitos,CA.
[3]. Lin H.-Y, Hsu, P.-Y.Sheen, G.-J,2006. A fuzzy-based
decision making procedure for data-warehouse system selection. Expert System with Application.
[4]. Badri, M. A., & Davis, D. A comprehensive 0–1 goal
[image:6.612.29.294.155.247.2]Journal of Project Management, 19(4),243–252. (2001
[5]. Karsak, E., & Ozogul, C. O. An integrated decision making
for ERP system selection. Expert Systems with Applications. 2007
[6]. Bernroider, W. N., & Stix, V.. Profile distance method -A
multi-attribute decision making approach for information system investments. Decision Support Systems, 42(2), 988– 998. 2006.
[7]. Buyukozkan, G., Kahraman, C., & Ruan, D. A fuzzy
multi-criteria decision approach for software development strategy selection. International Journal of General Systems, 33(2-3), 259–280. 2004.
[8]. Blanc, L.A., Korn, W.M.,. A structured approach to the
evaluation and selection of CASE tools. In: ACM. 1992.
[9]. Cochran, J.K., Chen, H.,. Fuzzy multi-criteria selection of
object-oriented simulation software for production system analysis. Computers and Operations Research 32, 153–168. 2005
[10]. Blanc, L., Jelassi, M.,. DSS software selection: a multiple
criteria decision methodology. Information and Management 17, 49–65. 1989.
[11]. Ossadnik, W., Lange, O.,. based evaluation of
AHP-software. European Journal of Operational Research 118, 578–588. 1999.
[12]. Hsin-Hung Wu, Jiunn-I-Shieh, Yen Li and Hsuan-Kai Chen.
A Combination of AHP and DEMATEL in Evaluating the Criteria of Employment Service Outreach Program Personnel .2010.
[13]. Tzeng , G.H. Chiang and C.W. Li,. Evaluating intertwined
effects in e-learning porgams: A novel hybrid mcdm model based on factor analysis and dematel. Exp. Syst. Appl., 32: 1028-1044.2007
[14]. Dhar, Sourav, Ray, Amitava, Bera, Rabindra Nath. A Context
Aware Vertical Handover Algorithm For Vehicular Communication.2011.
[15]. Das, Manik Chandra, Sarkar, Bijan, Ray, Siddhartha. A
framework to measure relative performance of Indian technical institutions using integrated fuzzy AHP and COPRAS methodology. 2011.
[16]. Ray, A, Sarkar, B and Sanyal, S. A holistic approach for
production outsourcing,Strategic Outsourcing: Int. J., vol. 1, no. 2, pp. 142– 153. 2008.
[17]. Dias-Neto Arilo Claudio and Travassos Guilherme Horta,
(2009), Model-based testing approaches selection for software projects. Information and Software Technology 51 (2009) 1487–1504.
[18]. Kettunen Petri and Laanti Maarit (2005).How to steer an