Volume 3, No. 4, July- August 2012
International Journal of Advanced Research in Computer Science
RESEARCH PAPER
Available Online at www.ijarcs.info
ISSN No. 0976-5697
Weighted Coupling Support (WCS): A Metric to predict the fault proneness of Object
Oriented Application
Amjan.Shaik*
Research Scholar,Department of CSE, JNTUH, Hyderabad,
Andhra Pradesh, India. [email protected]
Dr.C.R.K.Reddy
Professor and HOD of CSE CBIT, Gandipet,Hyderabad,
Andhra Pradesh, India [email protected]
Dr.A.Damodaram
Professor of CSE and
Director, Academic Audit Cell,JNTUH,Kukatpally, Hyderabad, Andhra Pradesh, India.
Abstract: This paper presents a novel metric called Weighted Coupling Support (WCS) metric for predicting fault proneness. Our metric measures a new measurement unit called weighted coupling support for each class of the object to rank them based on their fault proneness, which is based on the well-known HITS algorithm that measures hub and authority weights in link analysis. One advantage of the proposed metric is that it can be computed in a simpler (and in many cases, programming language independent) way as compared to some of the structural metrics. We empirically studied WCS for predicting fault-proneness of classes in a large open source systems and fault prediction sensitivity compared with CBO. As the result, we found that the proposed WCS can predict fault proneness nearly with 98.7% sensitivity, which is around 42% sensible when compared to CBO.
I. INTRODUCTION
An all-inclusive majority of coupling and accord metrics abound in the abstract relies on structural information, which captures relations, such as adjustment calls or attributes usages. Coupling and accord measures abduction the amount of alternation and relationships a allotment of antecedent cipher elements, such as classes, methods, and attributes in acquisitive (OO) software systems. The effort appear in this paper arose as allotment of an abstraction whose ambition is to advance a statistical study model to adumbrate the degree of fault proneness in OO systems. However, these structural metrics abridgement the adeptness to analyze the impact weight of the each class with CBO and awful accountability decumbent coupled classes. The action of WCS altitude is motivated by HITS link analysis algorithm [1].
Cohesion is the coverage to which the functions performed by a subsystem are related. One of the capital goals abaft OO analysis and design is to apparatus a software arrangement area classes accept top cohesion and low coupling a part of them. However, few studies had been done application coupling and cohesion to assess reusability of objects because of their limitations and the difficulties to appraise the reusability of objects. These class conceptions facilitate apperception activities, testing efforts, reuse, and continuance tasks. A fit premeditated object, in which the functionality has been appropriately disseminated to its assorted reliant objects, is acceptable to be fault free and will be easier to adapt. If they are extremely inter-reliantthen revolutionizing one are likely to have cogent furnishings on the behavior of others. These metrics have been accepted advantageous in altered tasks, such as, evaluation of design quality [2], [3], collision analysis [5], [6],[8], forecasting
software quality [7], anderrors[8], [9], [10], namingthedesign patterns [11] etc. Many metrics have been proposed to quantify the coupling and cohesion to adumbrate the fault proneness and maintainability of software. Hence soaring cohesion is a appropriate of a fine premeditated object. Coupling is the coverage to which the assorted objects interact. If a depended object is amenable for amount of different functions then the functionality distribution is ailed to dependent objects.
Appropriate distribution of function inspires two key concepts of object-oriented design: coupling and cohesion. Hence loose coupling between relied objects is aadvantageousfeature of an object.To fill this gap here in this paper we propose a metric called Weighted Coupling Support (WCS).
The rest of the paper organized, which exploring the related work in section II , Proposed WCS metric measuring process in section III and section IV explores the process with an example, section V revealed the results analysis, the section VI concluding the proposal that followed by references in section VII.
II. RELATED WORK
conferences and journals, it is evident that the CBO and other CBO related metrics are not sensual to consider as metrics to predict fault proneness.
Obtainable research illustrated that software metrics can be used as good indicators for the fault proneness of classes in OO systems [3], [8], [9], [10], [14], [15], [16], [17], [18].More specifically, some of the obtainablemodels also utilized machine learning [9] and logistic regression analyses [3], [9], [14], [15], [16], [17], [18] to build metric-based models for fault forecast. Hence here we proposed a metric called weighted coupling support that measured by a novel statistical measuring approach, which is defined under motivation of HITS algorithm[1].
III. WEIGHTED COUPLING SUPPORT (WCS)
METRIC
A. Hypothesis:
High CBO is undesirable [19]. Excessive coupling between object classes is detrimental to modular design and prevents reuse [19][20]. The more independent a class is, the easier it is to reuse it in another application [19][21][22]. In order to improve modularity and promote encapsulation, inter-object class couples should be kept to a minimum. The larger the number of couples, the higher the sensitivity to changes in other parts of the design, and therefore maintenance is more difficult [23]. A high coupling has been found to indicate fault-proneness; Rigorous testing is thus needed [23]. A class with more import coupling is more prone, and a class with more export coupling fault-prone as compared to them[24].
In the facts of analysis [24] the metric CBO is with high sensitivity in predicting fault proneness that compared to other metrics,but the results indicating that CBO conclude the possibility of the fault proneness but predicting the fault proneness and ranking the objects by their fault proneness is not sensual. Hence the metric weighted coupling support proposed to predict the fault proneness with high sensitivity. The description of the WCS measurement process fallows.
B. Assumptions:
Let set of classes
c c c
1, 2, 3,...,
cn
Let two classes ‘
ci
’ and ‘cj
’, ‘ci
’coupled with ‘cj
’if and only if any of the methods those belongs to ‘ci
’are invoking any of the methods those are belongs to’cj
’[19].Build a directed graph with classes as vertices and edges between classes. An edge between two classes is possible if at least one method of source class invoking the method of the target class.
Each path of the graph that representing set of classes as vertices and connected with edges will be considered as one connected transaction
ct
.The set of classes that are vertices in a connected transaction will be considered as connected set
cs
.Here after the set of all connected sets will be referred as ‘
SCS
’.C. Process:
[image:2.595.376.493.58.238.2]In the process of detecting the ‘
wcs
’ of each class, initially we build a bi parted graph between all possible connected sets belongs to set of connected setsSCS
and set of all classes. [image:2.595.343.529.283.360.2]Figure 1: Bipartite graph between connected sets and classes
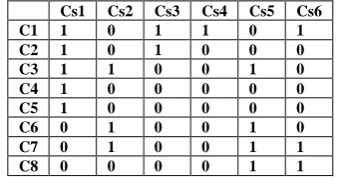
Table 1: matrix A as fallow that represents the connection between a class and each connected set
cs
.C1 C2 C3 C4 C5 C6 C7 C8
Cs1 1 1 1 1 1 0 0 0
Cs2 0 0 1 0 0 1 1 0
Cs3 1 1 0 0 0 0 0 0
Cs4 1 0 0 0 0 0 0 0
Cs5 0 0 1 0 0 1 1 1
Cs6 1 0 0 0 0 0 1 1
Table 2: Transpose matrix
A
'
of matrixA
as fallow that represents the connection between a class and each connected setcs
.Cs1 Cs2 Cs3 Cs4 Cs5 Cs6 C1 1 0 1 1 0 1 C2 1 0 1 0 0 0 C3 1 1 0 0 1 0 C4 1 0 0 0 0 0 C5 1 0 0 0 0 0 C6 0 1 0 0 1 0 C7 0 1 0 0 1 1 C8 0 0 0 0 1 1
Let consider set of connected sets
SCS
as a database and depict it as a bipartite graph without loss of information. LetSCS
=
{
cs cs cs
1,
2,
3,....,
cs
m}
be a list of connectedsets and
C
=
{ ,
c c c
1 2, ,..., }
3c
n be the corresponding set of classes. Then, clearlySCS
is equivalent to the bipartite graphG
=
(
SCS C E
, , )
where{( , ) :
,
,
}
E
=
cs c
c
∈
cs cs
∈
SCS c
∈
C
.In the bipartite graph (see Figure 1), the coupling support of a class c is proportional to its degree. Here comes the question of how to acquire weights in a set of connected sets. The graph representation (see Figure 1) of the set of connected sets is inspiring.
[image:2.595.352.522.391.483.2]coupling weights for different connection sets in order to reflect their different importance. It gives us the idea of applying link-based ranking models to the evaluation of connected sets. Regarding the connected sets as "pure" hubs and the classes as "pure" authorities, we can apply HITS to this bipartite graph. The following explored the process:
Let matrix representation of connected sets and class connections as binary matrix 'A'(see table 1).Value 1represents that this class
c
is existing in target connected setcs
If
c
∈
cs
then matrix value is 1 Else ifc
∉
cs
then matrix value is 0Consider the matrix
u
that representing each hub initial value as 1 (seeFigure 2). [image:3.595.318.524.57.263.2]1 1 1 1 1 1 1 1 1 1
Figure 2: Initially consider the each hub weight as 1 by default as fallow and represent them as matrix u.
Transpose the matrix A as A’
Find Authority weights by multiplying
A
'
withu
as'
v
= ×
A u
(Matrix multiplication between A’ and u gives a matrix v that representing the authority weights)Now find the original hub weights through matrix multiplication between
A and v
.
u
= ×
A v
Then the wcs of class c can be measured as fallow
1
1
{ (
) :
}
( )
(
)
m
i i
i m
i i
u cs
c
cs
wcs c
u cs
=
=
∈
=
∑
∑
Then the wcs of coupling between classes
c
iandc
jcan be measured as fallow1
1
{ (
) : ( , )
(
)
}
(
)
(
)
m
i j k i j k i
i
j k m
i i
u cs
c c
cs
c
c
cs
wcs c
c
u cs
=
=
⊂
∧
→
∈
→
=
∑
∑
IV.RANKING OBJECTS AND FIND FAULT PRONE
COUPLING USING WCS: AN EXAMPLE
Let’s consider the bi-partite graph in figure 1, the table 1 is the matrix A generated from that bi-partite graph and the table 2 is transpose matrix A’ of matrix A.
Initial hub values:
1 1 1 1 1 1
u =
The resultant matrix
v
generated fromv
= ×
A u
'
is 42 3 1 1 2 3 2
v =
Then measure the original hub values as
u
= ×
A v
and resultant hub values are11 8 6 4 10 9
[image:3.595.373.502.383.506.2]u =
Table 5: WCS values of the classes in example Bi-Partite graph
Class wcsvalue
C1 0.625
C2 0.354
C3 0.604
C4 0.229
C5 0.229
C6 0.375
C7 0.562
C8 0.396
Here in this table 4 we listed the wcs value of the each class. If these classes ranked by their highest to lowest WCS value, the ‘
c
1’ is highly fault prone. The coupling between ‘1
[image:3.595.374.501.604.775.2]c
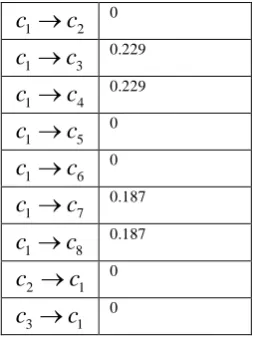
’ to other classes listed in table 6Table 6: WCS of ‘
c
1’ to other classes (export coupling)1 2
c
→
c
01 3
c
→
c
0.2291 4
c
→
c
0.2291 5
c
→
c
01 6
c
→
c
01 7
c
→
c
0.1871 8
c
→
c
0.1872 1
c
→
c
03 1
4 1
c
→
c
05 1
c
→
c
06 1
c
→
c
07 1
c
→
c
08 1
c
→
c
0We can find the WCS of connection to other classes from
c
1in table 6. Based on results explored in table 6, it isclear evident that though
c
1is ranked high as fault prone butits fault proneness limited to
c c c c
4,
5,
7,
8. And degree of fault pronenessdfp c
( )
for a classc
can be measured as fallow1
{
(
)
(
) :
}
( )
( )
m
i j j i
j i
i
wcs c
c
wcs c
c
i
j
dfp c
wcs c
=
→
+
→
≠
=
∑
In the case of class
c
1, the degree of fault proneness is 1.3312.V. RESULTS ANALYSIS
We conducted experiments on applications build by fallowing SDLC standards. We make sure the heterogeneity in number of classes of the applications considered for experiments.We measured the Fault proneness prediction accuracy of the
wcs
as fallow:Classes correctly predicted as fault prone
S(wcs)
Classes actually fault prone
[image:4.595.37.280.487.685.2]=
Figure 3: percentage of Fault proneness prediction accuracy
Here in Figure 3 we can observe the performance of the WCS in predicting degree of fault proneness, which stands with approx. 90% and miles ahead when compared to CBO.Sahraoui, Godin &Miceli[23] concluded from their empirical studies that CBO>14 is too high. In our experiments we observed that “
dfp
” value more than 4.65 indicates the severity in fault proneness.VI. CONCLUSION
Here in this paper we proposed a metric calledWeighted Coupling Support (WCS)which is a part of our intension to find a novel methodology to predict degree of fault proneness in object oriented system. Our research considered hypothesis quoted in research papers of software engineering [19][21][22][20][23][24] that the metric CBO value is proportional to fault proneness. But the accuracy of fault proneness prediction accuracy is still theoretically hyped. And the past research is not having any proper evidence about the detecting role of a class with high CBO value. Hence we proposed a navel metric that measures the weighted coupling support of each class and associative classes that are coupled. The descending order of the classes by their WCS indicates the order of their fault proneness from high to low as individual classes. The experiments evident that WCS of individual classes alone not significant to conclude the fault proneness, and WCS of coupled classes helps to predict the degree of fault proneness with average 91% accuracy, which is miles ahead when compared to CBO. In our future work we can fallow the similar statistical strategy to find the weighted cohesion support to predict the degree of fault proneness.
VII. REFERENCES
[1]. J.M. Kleinberg, "Authoritative Sources in a Hyperlinked Environment," J. ACM, vol. 46, no. 5, pp. 604-632, 1999
[2]. Bansiya, J. and Davis, C. G., "A hierarchical model for object-oriented design quality assessment", IEEE TSE, vol. 28, no. 1, pp. 4-17., 2002
[3]. Briand, L. C., Wüst, J., Daly, J. W., and Porter, V. D., "Exploring the relationship between design measures and software quality in object-oriented systems", Journal of System and Software, vol. 51, no. 3, pp. 245-273., 2000
[4]. Briand, L., Wust, J., and Louinis, H., "Using Coupling Measurement for Impact Analysis in OO Systems", in IEEE ICSM'99, pp. 475-482., 19996
[5]. Poshyvanyk, D., Marcus, A., Ferenc, R., and Gyimóthy, T., "Using Information Retrieval based Coupling Measures for Impact Analysis”, Empirical Software Engineering, vol. 14, no. 1, pp. 5-32., 2009
[6]. Wilkie, F. G. and Kitchenham, B. A., "Coupling measures and change ripples in C++ application software", JSS, vol. 52, pp. 157-164., 2000.
[7]. Lawrie, D., Feild, H., and Binkley, D., "Leveraged Quality Assessment Using Information Retrieval Techniques", in ICPC'06, pp. 149-158., 2006
[8]. El-Emam, K. and Melo, K., "The Prediction of Faulty Classes Using Object-Oriented Design Metrics", NRC/ERB-1064, vol. NRC 43609, 1999.
[9]. Gyimóthy, T., Ferenc, R., and Siket, I., "Empirical validation of OOmetrics on open source software for fault prediction", TSE, vol.31/10,Oct' 2005.
[10]. Quah, T.-S. andThwin, M. M. T., "Application of neural networks for software quality prediction using OO metrics", in ICSM'03,pp. 116-125.
Software", in Proc. of 5th IEEEMETRICS'98, Bethesda, MD, pp. 23 - 34., 1998
[12]. http://promisedata.org/ [13]. http://msr.uwaterloo.ca/
[14]. Arisholm, E., Briand, L. C., and Foyen, A., "Dynamic coupling measurement for OO software", IEEE TSE, vol. 30, no. 8, pp. 491-506., 2004
[15]. Basili, V. R., Briand, L. C., and Melo, W. L., "A Validation of OO Design Metrics as Quality Indicators", IEEE TSE, vol. 22/10, Oct., pp. 751-761., 1996
[16]. Briand, L., Melo, W., and Wust, J., "Assessing the Applicability of Fault-Proneness Models across OO Software Projects", TSE, vol.28/7,706-720., 2002
[17]. Olague, H., Etzkorn, L., Gholston, S., and Quattlebaum, S., "Empirical Validation of Three Software Metrics Suites to Predict Fault-Proneness of Object-Oriented Classes Developed Using Highly Iterative or Agile Software Development Processes", IEEE TSE, vol. 33, no. 6, pp. 402-419., 2007
[18]. Subramanyam, R. and Krishnan, M. S., "Empirical Analysis of CK Metrics for Object-Oriented Design Complexity: Implications for Software Defects", IEEE TSE, vol. 29, no. 4, pp. 297-310., 2003
[19]. Shyam R. Chidamber, Chris F. Kemerer. A Metrics suite for Object Oriented design.M.I.T. Sloan School of
Management E53-315. 1993. http://uweb.txstate.edu/~mg43/CS5391/Papers/Metrics/OO
Metrics.pdf
[20]. Lionel C. Briand, John W. Daly, and Jürgen Wüst: A Unified Framework for Coupling Measurement in Object-Oriented Systems. Fraunhofer Institute for Experimental Software Engineering. Kaiserslautern, Germany. 1996. http://www.iese.fraunhofer.de/network/ISERN/pub/technic al_reports/isern-96-14.pdf
[21]. Victor Basili, Lionel Briand and WalcelioMelo.A Validation of Object-Oriented Design Metrics as Quality Indicators.IEEE Transactions on Software Engineering. Vol. 22, No. 10, October 1996.
http://www.cs.umd.edu/users/basili/publications/journals/J 60.pdf
[22]. Roger Whitney: Course material. CS 696: Advanced OO. Docs 6 & 8, Metrics.Spring Semester, 1997.San Diego StateUniversity.
http://www.eli.sdsu.edu/courses/spring97/cs696/notes/metr
ics/metrics.html and http://www.eli.sdsu.edu/courses/spring97/cs696/notes/metr
ics2/metrics2.html
[23]. HouariA.Sahraoui, Robert Godin, ThierryMiceli: Can Metrics Help Bridging the Gap Between the Improvement of OODesign Quality and Its Automation? http://www.iro.umontreal.ca/~sahraouh/papers/ICSM00.pd f
[24]. K.K.Aggarwal, Yogesh Singh, ArvinderKaur, RuchikaMalhotra; Investigating effect of Design Metrics
on Fault Proneness in Object-Oriented Systems; JOURNAL OF OBJECT TECHNOLOGY; Online at http://www.jot.fm. Published by ETH Zurich, Chair of Software Engineering ©JOT, 2007.
Short Bio Data for the Authors
Amjan.Shaikis a Research Scholar,
Department of Computer Science and Engineering, JNTUH, Hyderabad, India. He has received M.Tech. (Computer Science and Technology) from Andhra University. He has been published and presented good numberof Research and Technical papers in International Journals, National and International Conferences. His main research interests are Software Metrics, Software Engineering, Software Testing, Software Quality and Object Oriented Design.
Prof.Dr.C.R.K. Reddy is working as a Professor and HOD of Computer Science and Engineering at ChaitanyaBharathi Institute of Technology (CBIT), Gandipet, Hyderabad, India. He has received M.Tech. (Computer Science and Engineering) from JNTUH, Hyderabad and Ph.D in Computer Science and Engineering from Hyderabad Central University (HCU). He has been published and presented wide range of Research and Technical Papers in National, International Journals and National, International Conferences. At present 8 Research Scholars are doing Ph.D under his esteemed guidance. His main research Interests are Program Testing, Software Engineering , Software Metrics , Software Architectures, Neural Networks and Artificial Intelligence.