Volume 9, No. 1, January-February 2018
International Journal of Advanced Research in Computer Science
RESEARCH PAPER
Available Online at www.ijarcs.info
ISSN No. 0976-5697
A MULTISTAGE APPROACH FOR EXUDATES DETECTION IN FUNDUS
IMAGES USING TEXTURE FEATURES WITH k-NN CLASSIFIER
Parashuram Bannigidad
Department of Computer Science Rani Channamma University
Belagavi, Karnataka, India
Asmita Deshpande
Department of Computer Science Rani Channamma University
Belagavi, Karnataka, India
Abstract: Human eye is one of the common organs affected by diabetes. Diabetic retinopathy is a retinal disease that is characterized by vascular changes causing swellings of capillaries known as microaneurysms and exudates. Exudates are an accumulation of lipid due to vascular leakage in the vitreous humor. The focus of the work presented in this paper is to detect exudates which are an important symptom for Diabetic Retinopathy. The proposed algorithm consolidates morphological operations for blood vessel removal, segmentation and optic disk removal followed by Exudates detection. The proposed technique extracts texture features and uses k-NN classifier to segregate diseased and healthy images. It demonstrates promising outcomes with higher PPV, specificity and sensitivity values. It is observed from experimentation that the average values of PPV, specificity is 100% and sensitivity yielded 98.2% for DIARETDB0 database.
Keywords: Diabetic retinopathy, Fundus images, Preprocessing, Morphological operations, Feature Extraction
I. INTRODUCTION
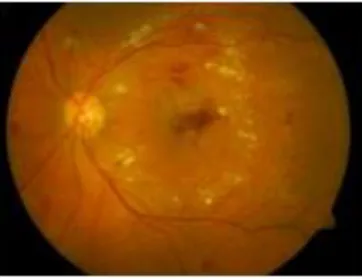
[image:1.595.81.263.572.711.2]Diabetes is a major medical problem all over the world that deteriorates the functioning of a number of human organs including the human eye. Diabetic patients develop ophthalmic complications such as Diabetic Retinopathy, Glaucoma and macular Edema. Such diseases can be diagnosed by ophthalmologists by examining the affected portion of retina. A Heidelberg Retina Tomograph or a non-mydriatic fundus camera an also be employed to diagnose these disorders. The interior of the eye which include fovea, optic disc, macula and retina can be documented by a fundus camera. The earliest clinical symptoms of Diabetic retinopathy are microaneurysms. They are characterized by swellings of the capillaries and appear as small red dots. As the disease progresses exudates appear on the retina as a result of breakdown of the vessels, leaking serum proteins or lipids. Exudates are the yellow lesions of irregular shape and size, spread all over the fundus image nearer to blood vessels. A fundus image with exudates is shown in Figure 1.
Figure 1. Fundus image with exudates
Most of the researchers have explored image processing techniques to detect exudates in a fundus image. Chen et. al. [1] have prominently used Histogram based segmentation and
II. MATERIALS AND METHODS
For the purpose of implementation, the digital fundus images are obtained from a publicly available database, namely DIARETDB0 [15]. DIARETDB0 is public database for benchmarking diabetic retinopathy detection from digital images. The current database consists of 130 color fundus images of which 20 are normal and 110 contain signs of the diabetic retinopathy (hard exudates, soft exudates, microaneurysms, hemorrhages and neovascularization). Images are captured with a 50 degree field-of-view digital fundus camera with unknown camera settings.
III. PROPOSED METHOD
[image:2.595.310.560.141.264.2] [image:2.595.59.232.324.690.2] [image:2.595.370.498.589.692.2]Our proposed method is a multi-stage approach to detect and identify exudates present in a fundus image. The multistage process initially performs preprocessing, blood vessel removal, segmentation, optic disk removal, and exudates detection followed by feature extraction and classification. The proposed method is depicted in the flow diagram shown in the below Figure 2.
Figure 2. Flow diagram of the proposed method
A. Preprocessing
The principle objective of preprocessing in a fundus image is to highlight smaller details in the fundus like blood vessels lesions and exudates. Most fundus images suffer from
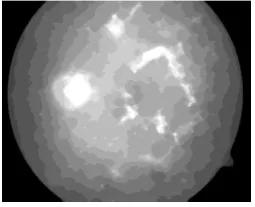
During the preprocessing stage, the input image is resized to 576 X 720 standard size and converted into grayscale. The contrast of the grayscale image is enhanced by transforming the values. The image intensity level is mapped to higher intensities so as to increase the contrast between foreground and background. Figure 3(a) shows the grayscale image and Figure 3(b) shows the contrast adjusted image.
(a) (b) Figure 3. (a) Grayscale Image (b) Contrast adjusted image
Canny edge detection is further applied to the contrast adjusted image to highlight the edges. This is followed by detection and masking of outer circular border of the fundus image. Now thresholding is applied and the image is binarized.
B. Blood Vessel Removal
In order to highlight the affected portion of retina comprising of exudates it is necessary to detect the entire vasculature of blood vessels and eliminate it. The vessel path is detected and closed using morphological operations. A disc shaped structuring element is chosen and morphological opening and closing operations are applied as follows:
A(x,y) = (I⊕S) (x,y) = max{I(x-x’, y-y’) + S(x’,y’) } (1)
B(x,y) = (I
ɵ
S) (x,y) = min{I(x+x’, y+y’) – S(x’,y’) } (2)In = A(x,y) – B(x,y) (3)
where, I(x,y) is the image obtained after external border masking during preprocessing and S(x’,y’) is the structuring element. This alternating opening and closing operations increase the size of exudates and remove other components like blood vessels. Next, a ball shaped structuring element is defined and once again morphological closing operation is applied to eliminate blood vessels completely. The image obtained after removal of blood vessels is shown in Figure 4.
Figure 4. Image after blood vessel removal
C. Segmentation and Optic Disc Removal
performed on In. The image is then converted to binary and the fixed threshold is applied to filter the lesions.
I(x, y) = 1 if p(x, y) > 𝑇 (4)
I(x, y) = 0 if p(x. y) < 𝑇 (5)
where, T = 0.45. In the grayscale image In, pixels with intensity p(x, y) that lie between 0.45 - 1 is converted as white and pixels with intensity p(x, y) that lie between 0.45 - 0 is converted to black. Exudates and Optic disc are the brighter regions of the retina and hence represented as white pixels in the binarized image.
Optic disc is the brightest spot on the retina. It is a normal circular anatomical structure present near the left or right border of the retina. Identification of the optic disc poses an important challenge in processing of fundus images because the exact location of the optic disc is not fixed. The optic disc not only needs to be identified but eliminated too since it may wrongly be identified as exudates region.
To locate the optic disc, largest connected component in the segmented image is computed [18]. This largest connected component is the disc. The largest value of the columns of image and its coordinates is retrieved. The mask is computed with mesh grid vectors x and y as well as the medians of row and column coordinate vectors based on the equation of a circle as follows:
𝐼𝑚 = √(𝑥 − 𝑚𝑐)2 − (𝑦 − 𝑚𝑟)2 (6)
The mask is subtracted from the segmented image I(x, y) to eliminate optic disc.
𝐼𝑛𝑑 = 𝐼(𝑥, 𝑦) − 𝐼𝑚
(7)
Next the outer circular border is eliminated from Ind to obtain image Inc. Now, morphological closing operation is used to get accurate shape of exudates.
𝐼𝑒𝑥 = 𝑓(𝐼𝑛𝑐) (8)
Further, contrast enhancement is applied using CLAHE in order to distinguish between exudates and non exudates region. ɸ(Iex) complements the image and converts white pixels to black and vice versa. This is followed by inverting, ψ(Iex) to highlight all dark feature pixels. A simple ‘AND’ operation on these two images extracts all the white pixels within the connected region of the exudates.
𝐼𝑒 = 𝐴𝑁𝐷(𝜑(𝐼𝑒𝑥), ψ(𝐼𝑒𝑥) (9)
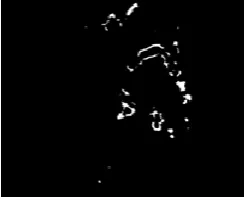
[image:3.595.379.503.55.155.2]The segmented image after the optic disc is elimination is shown in Figure 5.
Figure 5. Image after segmentation and optic disc removal
D. Feature extraction and classification
This algorithm explores texture features [4] for classification as they play an important role in medical image analysis. These features are particularly useful in applications that involve automatic extraction of features that distinguish a normal tissue from an abnormal tissue. Texture analysis describes an image as rough, smooth, silky etc. The various features extracted in the proposed algorithm are Local Range of an image, Local Standard Deviation, and Local Entropy of a grayscale image. The characterization of texture of an image is possible with these features because they provide information about variation in local intensity. The proposed method also considers standard deviation, variance, skewness and kurtosis.
The proposed method employs k-NN classifier to distinguish the images as diseased or healthy. The k- nearest neighbour algorithm is a non-parametric method of classification.
IV. EXPERIMENTAL RESULTS AND DISCUSSION
For the purpose of experimentation digital fundus images were obtained from publicly available database DIARETDB0 [15], which is treated as standardized database and many researchers have worked on it. In all, 114 images are tested from DIARETDB0 database. The proposed algorithm is implemented using MATLAB R2015b and Intel Core i3 processor. The Figure 6(a) shows original fundus image form DIARETDB0 database and Figure 6(b) depicts the segmented image after application of the proposed algorithm.
(a) (b)
Figure: 6. (a) Fundus image from DIARETDB0 database (b) Segmented image
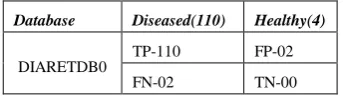
[image:3.595.321.554.539.657.2]Table 1. Clinical test parameters for DIARETDB0 database
Database Diseased(110) Healthy(4)
DIARETDB0 TP-110 FP-02
FN-02 TN-00
The proposed algorithm is evaluated based on the following performance evaluation measures [16]:
• Sensitivity (Se): It measures the proportion of True Positives (TP) correctly identified from a given set of images.
Se = TP/(TP + FN)
(10)
•
Specificity (Sp): It measures the proportion of False Negatives (FN) correctly identified from a given set of images.Sp = TN/(TN + FP) (11)
•
Positive Predictive Value (PPV):It indicates the percentage of population that actually shows the symptoms of the disease.
PPV = TP/(TP + FP) (12)
[image:4.595.29.289.465.567.2]The comparison of results of clinical test statistics based on the test parameters on DIARETDB0 database is given in the Table 2.
Table 2. Comparison of results of clinical test statistics based on the test parameters on DIARETDB0 database
Sr no
Authors PPV Specificity Sensitivity
1. Mohammed Omar et. al.[4] 94.81% 98.68%
2. Garcia et. al. [2] 85.7% 95.9%
3. Lin P., Bing-Kun Z [8] 87.5% 84.8%
4. M. Usman Akram et. al.[5] 97.5% 98.3% 93.7%
5. Proposed Method 100% 100% 98.2%
V. CONCLUSION
This paper presents a multistage approach for exudates detection in fundus images. The proposed algorithm consolidates morphological operations for blood vessel removal, segmentation, optic disk removal and exudates detection. The proposed technique extracts texture features and uses k-NN classifier to segregate diabetic retinopathy images as diseased or healthy. It demonstrates promising outcomes with higher PPV, specificity and sensitivity values. It is observed from the experimentation that the average values of PPV, specificity are achieved 100%, and sensitivity 98.2% for DIARETDB0 database. The results of the proposed method are compared with the results obtained by other authors and verified by medical experts and ophthalmologists. Hence, it proves the effectiveness of the proposed method
.
VI. ACKNOWLEDGEMENT
fundus image analysis and visualization. The authors are also grateful to the developers of DIARETDB0 database.
VII. REFERENCES
[1] Chen X, Bu W, Wu X, Dai B, Teng Y, “ A novel method for automatic hard exudates detection in color retinal images”, International Conference on Machine Learning and Cybernetics (ICMLC), 2011, China, pp. 1175-1181.
[2] Garcia M, Valverde C, Lopez MI, Poza J, Hornero R, “Comparison of logistic regression and neural network classifiers in the detection of hard exudates in retinal images”, International Conference on Engineering in Medicine and Biology Society,Japan,2013, pp. 5891-5894.
[3] Kemal AKYOL, Baha SEN, Safak BAYIR, Hasan Basari CAKMAK, , “ Assessing the importance of features for detection of Hard Exudates in Retinal Images”, Turkish journal of Electrical Engineering and Computer Sciences, 2017, pp. 1223-1227.
[4] Mohamed Omar, Fouad Khelifi, Muhammad Atif Tahir “ Detection and Classification of Retinal Fundus Images Exudates using Region based Multiscale LBP Texture Apprach”, IEEE International Conference on Control, Decision and Information Technologies, 2016, pp. 227-232. [5] Mohamed Omar, Fouad Khelifi, Muhammad Atif Tahir, “
Detection and Classification of Retinal Fundus Images M. Usman Akram, Anam Tariq, M. Almas Anjum, and M. YounusJaved, “Automated detection of exudates in colored retinal images for diagnosis of diabetic retinopathy”, Applied Optics , Vol. 51, No. 20, 2012, pp. 4858-4866
[6] NB Prakasha and D Selvathi, “An efficient approach for detecting exudates in diabetic retinopathy images”, Biomedical Research, Special Issue, 2016, pp. S414-S418. [7] Mukherjee N., Dutta H.S. (2015) A New Approach for Color
Distorted Region Removal in Diabetic Retinopathy Detection. In: Gupta S., Bag S., Ganguly K., Sarkar I., Biswas P. (eds) Advancements of Medical Electronics. Lecture Notes in Bioengineering. Springer, New Delhi pp. 85-97.
[8] Lin P., Bing-Kun Z, “ An Effective Approach to Detect Hard Exudates in Color Retinal Image”, Recent Advances in Computer Science and Information Engineering. Lecture Notes in Electrical Engineering, Vol. 124. Springer, Berlin, pp. 541-546.
[9] Qing Liu, Beiji Zou, Jie Chen, Wei Ke, Kejuan Yue, Zailiang Chen,Guoying Zhao, “A location-to-segmentation strategy for automatic exudates segmentation in colour retinal fundus images”, Computerized Medical Imaging and Graphics, 2017, pp. 78–86.
[10] Ravitej Rekhi, Ashish Issac,Malaykishore Dutta, Carlos M. Travieso, “ Automated Classification of Exudates from Didigtal Fundus Images”, International Conference and Workshop on Bioinspired Intelligence, 2017.
[11] Swati Gupta and Karandikar AM, “Diagnosis of Diabetic Retinopathy using Machine Learning”, Research and Development, Vol. 3. Issue 2. pp. 2-6.
[12] Anuj C. Somkuwar, Tejas G. Patil, Sanika S. Patankar, Jayant V. Kulkarni, “Intensity Features Based Classification of Hard Exudates in Retinal Images”, Annual IEEE India Conference, 2015, pp. 1-5.
[15] Obtained from the website: http://www.it.lut.fi/project/imageret/diaretdb0/
[16] Obtained from the website: https://en.wikipedia.org/wiki/Sensitivity_and_specificity
[17] Parashuram Bannigidad and Asmita Deshpande, “ A Hybrid Approach for Digital Fundus Images using Image Enhancement techniques”, International Journal of Computer
Engineering and Applications, Vol. XII, Issue I, 2017, pp.122-131.